
A robust core business, superb free cash flow margins, and industry-leading earnings-per-share growth power a bullish case. More upside ahead for DexCom?
Long Trade Idea
Enter your long position between $65.20 (a minor horizontal support level) and $68.18 (yesterday’s intra-day high).
Market Index Analysis
- DexCom (DXCM) is a member of the NASDAQ 100 and the S&P 500.
- Both indices trade inside bearish chart patterns with decreasing bullish trading volumes.
- The Bull Bear Power Indicator of the S&P 500 shows a negative divergence and does not support the uptrend.
Market Sentiment Analysis
The Santa Claus rally stumbled out of the gate to start the last trading week of 2025, led lower by NVIDIA and Tesla. Adding to intra-day volatility was erratic trading in silver, which surged to an all-time high above $80 before dropping by over 5%. Pending home sales posted their biggest gain since 2023, but mortgage rates remain elevated. Today’s FOMC meeting could set the tone for the rest of the week, amid a vacuum of market-moving data. Futures are moving lower this morning, while excessive bullish sentiment for 2026 is a rising concern.
DexCom Fundamental Analysis
DexCom is a leader in continuous glucose monitoring (CGM). Its G7 device is the most accurate CGM approved in the US, and DexCom is at the core of the MAHA (Make America Healthy Again) movement.
Top Regulated Brokers
So, why am I bullish about DXCM after its latest breakout?
I am bullish on DexCom after it received FDA clearance for Dexcom Smart Basal, the first and only CGM-integrated basal insulin dosing optimizer for Type 2 diabetes. A slew of analyst upgrades adds to bullish momentum. Its core business is healthy and does not require costly acquisitions. Profit and free cash flow margins are rising, and DXCM is expanding its reach through partnership agreements.
Metric | Value | Verdict |
P/E Ratio | 37.48 | Bearish |
P/B Ratio | 9.65 | Bearish |
PEG Ratio | 0.89 | Bullish |
Current Ratio | 1.56 | Bearish |
ROIC-WACC Ratio | Positive | Bullish |
DexCom Fundamental Analysis Snapshot
The price-to-earnings (P/E) ratio of 37.48 makes DXCM an expensive stock. By comparison, the P/E ratio for the S&P 500 is 29.47.
The average analyst price target for DXCM is $85.27. It suggests excellent upside potential with acceptable downside risks.
DexCom Technical Analysis
Today’s DXCM Signal
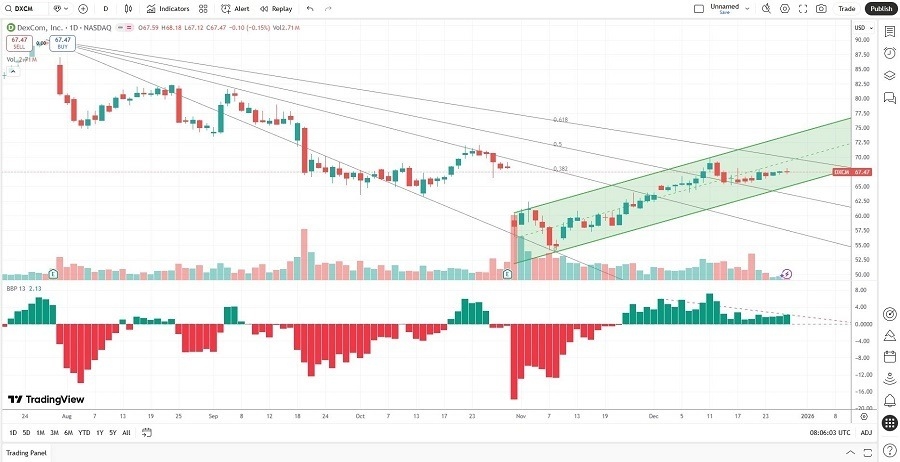
DexCom Price Chart
- The DXCM D1 chart shows a price action inside a bullish price channel.
- It also shows price action between its descending 50.0% and 61.8% Fibonacci Retracement Fan levels.
- The Bull Bear Power Indicator is bullish with a negative divergence, suggesting potential near-term volatility ahead.
- The average bullish trading volumes are higher than the average bearish trading volumes.
- DXCM rallied with the S&P 500, a bullish confirmation.
My Call on DexCom
I am taking a long position in DXCM between $65.20 and $68.18. While valuations are thin, the 5-year PEG ratio suggests the company is undervalued. I remain bullish about its core business and excellent operational metrics, led by its EPS growth.
- DXCM Entry Level: Between $65.20 and $68.18
- DXCM Take Profit: Between $85.27 and $89.96
- DXCM Stop Loss: Between $56.45 and $60.36
- Risk/Reward Ratio: 2.29
Ready to trade our analysis of DexCom? Here is our list of the best stock brokers worth checking out.