The following are the most recent pieces of Forex technical analysis from around the world. The Forex technical analysis below covers the various currencies on the market and the most recent trends, technical indicators, as well as resistance and support levels.
Most Recent
The S&P 500 did pull back just a bit during the trading session on Wednesday, but still remains near all-time highs.
Gold market traders continue to get thrown around back and forth as the markets really have nowhere to be.
The Australian dollar rallied significantly during the course of the trading session on Wednesday, but it does have a significant amount of noise just above that could come into play and cause some issues.
Top Forex Brokers
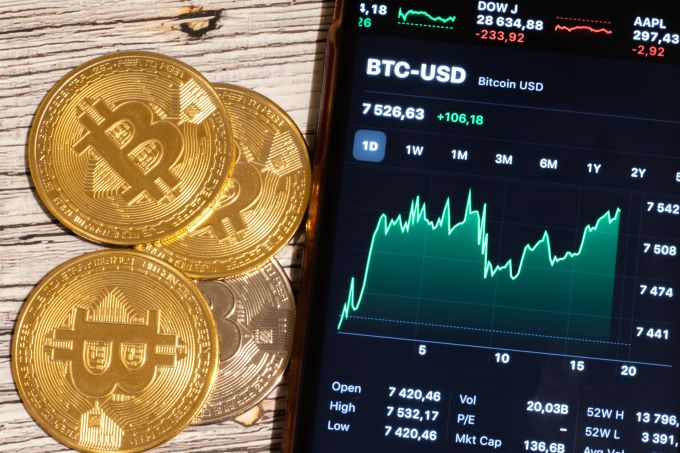
Bitcoin markets rallied during the trading session on Wednesday to reach towards the $65,000 level before pulling back.
Even though the crude oil markets broke down significantly, the Canadian dollar was essentially unchanged.
The West Texas Intermediate Crude Oil market broke out during the trading session on Wednesday, as we have cleared the top of the short-term range that we have been in.
The decline of the US dollar and in US bond yields contributed to gold's gains that reached the $1749 resistance level and stabilized around $1745 at the beginning of trading on Wednesday.
For four trading sessions in a row, the GBP/USD has been moving in a narrow range between the 1.3668 support level and the 1.3776 resistance level.
The USD/JPY pair abandoned the 110.00 psychological resistance despite the positive US inflation numbers, retreating to the 109.00 support level as of this writing.
Bonuses & Promotions
Risk appetite and a lull in the dollar's gains, despite the better-than-expected results of US inflation figures, contributed to more gains for the EUR/USD.
The USD/BRL has moved higher the past few days after challenging short-term lows on the 8th of April and is near important resistance.
The past five days of trading within the USD/ZAR have produced choppy results as key support levels remain firm.
Subscribe
Sign up to get the latest market updates and free signals directly to your inbox.The USD/INR continues to devastate resistance levels which technically stand in the way and is now challenging values seen in mid-July 2020.
The USD/SGD remains within the higher value range of its three-month technical chart, but it is certainly touching important support.
The S&P 500, and Wall Street in general, are seemingly willing to overlook almost anything right now, as we continue to see buyers come in on the dips.


