The following are the most recent pieces of Forex technical analysis from around the world. The Forex technical analysis below covers the various currencies on the market and the most recent trends, technical indicators, as well as resistance and support levels.
Most Recent

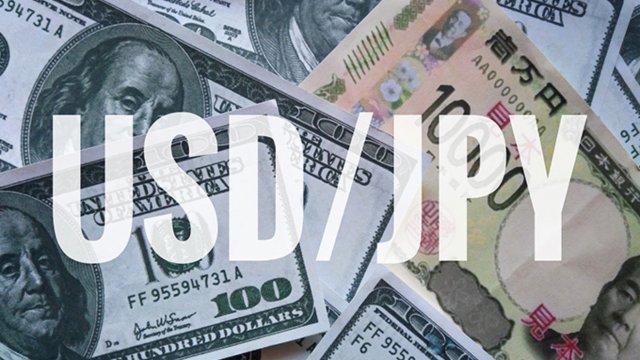

USD/JPY has been acting like it was shot out of a cannon lately, blasting through various resistance areas with impunity. The recent break of the 80 level was one of the biggest moves in the Forex markets that we have seen in some time, and certainly has gotten the attention of the traders around the world.
One of the favored commodity trades by currency traders is to buy and sell the Kiwi dollar accordingly. The biggest reason is that the currency will follow the general attitude of the markets, and not just a small amount of commodities.
At the start of every week, I have a look at weekly charts to get a feel for the potential market direction. While there are many interesting candle formations across the multitude of currency pairs this week, I am especially interested in the CHF/JPY.
Top Forex Brokers
It may be the weekend, but this EUR/USD signal allows you to prepare for this week's trades.
Let this USD/CAD signal help you take advantage of this Forex pair to find profits.
See where the EUR/USD is headed from this free Forex Signal Update based off the original signal!
The recent price action has been fairly tight, and this is mainly because of the fact that we are sitting right at a major support level in the neighborhood of the 1.30 handle. Get the full analysis and video here!
The USD/CHF pair has seen resurgence over the last several sessions as the bulls have taken back control of the market. The recent bounce from the 61.8% Fibonacci retrace of the uptrend. Get the full analysis here.
How you play this pair will vary on your time frame quite frankly. The fact is that this pair cannot be sold, so having said that it is your time frame that will dictate the exit strategy. Get the full analysis here.
Bonuses & Promotions
This USD/JPY Signal update can still be helpful even if you missed yesterday's original. Check it out here!
The USD/CHF reversed right back to the 0.9225 level that it worked so hard to break out of for most of February. After 2 days of solid Bullish action price worked itself up to a strong resistance zone at 0.9310 where it stopped and today price did a 180 degree turn.
Based on Christopher Lewis's analysis of the EUR/USD and USD/CHF traders profited on a binary options platform
Subscribe
Sign up to get the latest market updates and free signals directly to your inbox.See where the US Index is headed based on Candlestick patterns.
Let this USD/JPY signal help you take advantage of this Forex pair to find profits.
The EUR/USD pair recently has been a headline driven currency pair to say the least.