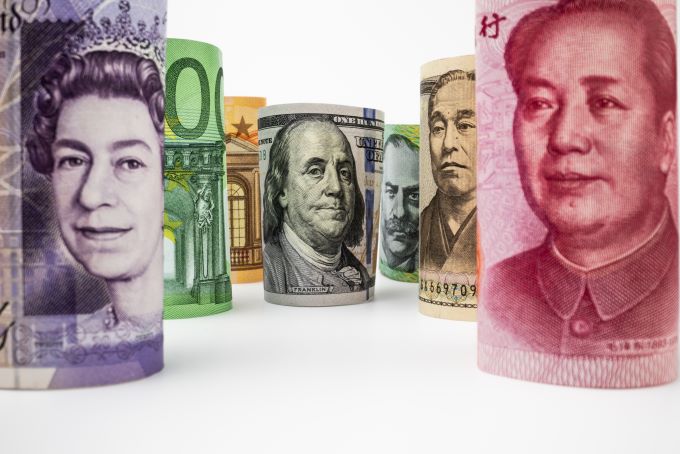
The following are the most recent pieces of Forex technical analysis from around the world. The Forex technical analysis below covers the various currencies on the market and the most recent trends, technical indicators, as well as resistance and support levels.
Most Recent
The EUR/JPY opens its new weekly candle just below the weekly 5 ema but far enough below that I think price will need to drift up a bit to it then continue its way down. The weekly 5 ema is at 102.51, the daily 21 ema is at 102.65 and the 38.2 fib of the recent swing down is at 102.82
The GBP/USD begins its new week right on the 5 ema. The stochastics is pointing up and I don't believe this pair is done rising. On the daily timeframe the stochastics is rising and pointing up and price is above the ema's.
The new weekly candle for the EUR/USD opens up around 120 pips below the weekly 5 ema. As I have stated time and time again and have been proven correct every single time, price needs to make its way back up to the 5 ema at least just to tap it.
Top Forex Brokers
The EUR/GBP starts out the new week in what I refer to as 'No Man's Land.' This means price is not up against resistance or down against support but in the middle. Of course, this is based on the weekly timeframe.
For the sixth week in a row the Swissy weekly candle opens nearly at but a bit below the 50.0 fib of the last move down around .9400 This is obviously a very, very important level. It has been breached on the weekly timeframe but we have not had a weekly candle close above that level.
EUR/USD spent most of the previous week trying to rally, but there simply wasn’t enough steam to hold onto gains. The 1.30 level continues to be very supportive, but the last several days have seen shooting stars form after rallies continue to fail.
As the last of the mince pies get eaten and new holes made in an already overworked belt, it’s time to put the last quarter’s volatile trading period behind us and look forward to a prosperous New Year.
Just like a few other pairs the GBP/USD daily candle was a Doji. It moved a total of 80 pips yesterday but the open and close were only 7 pips apart.
Yesterday was a very interesting day for the EUR/USD as it was with a few other pairs. Yesterday's daily candle for the EUR/USD was a Doji as it was with the EUR/GBP and the USD/CHF.
Bonuses & Promotions
Yesterday was a slow day for the EUR/JPY. Its range was only half of what it normally is. On the daily timeframe it is obvious price is heading up to make the retracement that is overdue, however, the last few days we have been making higher lows but at the same time we also been making lower highs which is just another way of saying we are in consolidation.
The Swissy yesterday, just like the EUR/GBP made a Doji. The only difference is that the EUR/GBP made its Doji at support and the USDCHF made its Doji at resistance. Interesting enough the difference between the open and close for the Swissy was just 5 pips and the EUR/GBP was 4 pips.
Yesterday the EUR/GBP produced a Doji at an area of support, the weekly 233 ema after a downtrend that has been lasting a couple weeks. I am sure you all already know that a Doji is a reversal candle.
Subscribe
Sign up to get the latest market updates and free signals directly to your inbox.Currency: USD/CAD Trend Expected Direction: Up Strategy: Ichimoku Kinko Hyo
See how a Pro trader turned today's Forex technical analysis into profitable trades on a binary options platform.
Find out where this major Forex currency pair is headed in this analysis from an expert trader.


