This might sound like a strange or tricky topic. It really isn’t! It is something you are probably already doing as a trader, without even being aware of it.
If you use Japanese candlesticks to help you make trading decisions, you are already examining time as a factor. For example, a candlestick that is described as strongly bullish or strongly bearish, is usually going to be one that has a long real body. Think about it – what does a long real body mean, except that the price moved a significant distance over a unit of time?
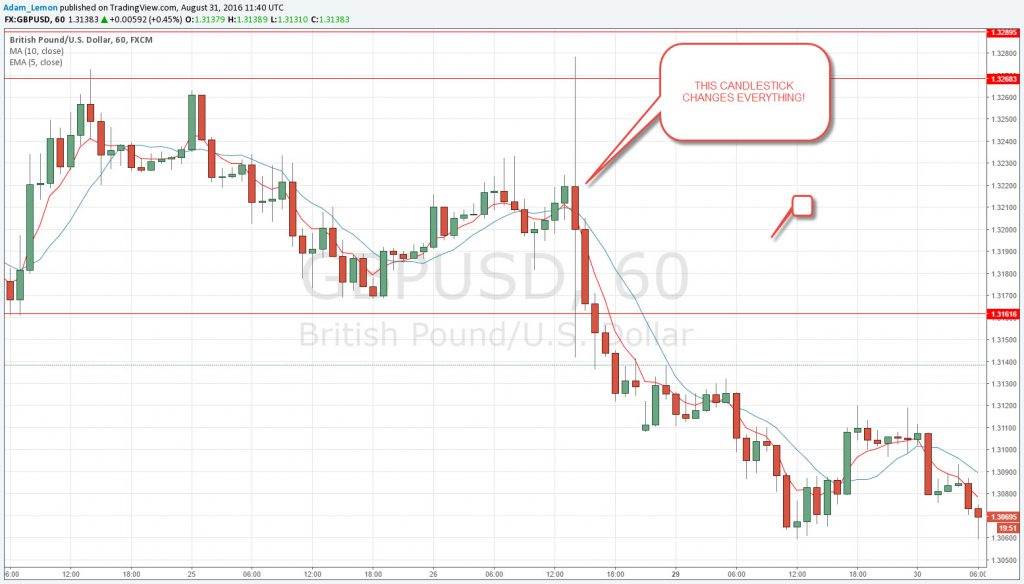
Another example could be, say, when the price is moving downwards over several even candlesticks that are all bearish and are all about 10 pips long. Suddenly, the next candle is a 30 pip long bullish candle. It is the change in the element of time that is a factor, and is the first sign that market conditions are changing.
A good example is shown in the chart below. Suddenly, there was a huge, bearish, doji-style candlestick, which broke up the chart pattern and started a new market condition:
If you want to use an indicator to help measure this instead of simply relying upon your own eyeballs, use the Average True Range indicator, and take note when a candle appears that is greater than the average number shown by the indicator. By the way, make sure you use a large sample within the indicator that covers at least a few days of time.
One way to test the importance of time in trading, is to conduct a simple back test. I have done this myself, so I know that it works! The back test should be as follows:
- Take any trading strategy that has as its goal, an attempt to predict a directional movement over several candlesticks, greater than the distance from the entry price to the stop loss.
- Conduct a back test that proves it is a profitable strategy.
- Now look at all the trades again, and pay attention to the ones where the first couple of candles moved strongly in the direction of profit (“winners”), and the ones where the opposite happened, but without the stop loss being triggered (“losers”).
- Now build another strategy based upon exiting those “losers” at the close of the second candle after entry, and entering another position likewise for the winners.
- If you use a sufficiently large sample, you are highly likely to find this is also a profitable strategy.
Therefore, it is said “cut your losers short, and add to your winners”!
Notice that it is more important that the trade move in the desired direction quickly, than the fact that it moves in the desired direction at all.
There are other reasons in trading why speed is good.
Firstly, the quicker a trade completes, the less mental stress you might be exposed to in worrying about its outcome.
Secondly, in Forex trading, we usually have half a pip or so of our position deducted by our broker if we hold it over 5pm New York time.
Now, if you have heard of Renko charts or Range Bars, you might be wondering what is the point of them if the element of time is so important? If you don’t know about them, they are both ways of charting that remove the element of time.
The answer is that the element of time is important in measuring the momentum of a move, but not in trading ranges between support and resistance, where action tends to be much slower and choppy.
If there is a strong trend happening somewhere to trade, it is usually going to give better odds than trading support and resistance levels in a choppy, ranging currency pair. However sometimes there are no strong trends, and these are the times when Renko charts or Range Bars can be most useful.


