The markets came back to life yesterday, with the U.S. stock market recording its largest one day fall since the U.S. Presidential election, and the USD/JPY currency pair also making a strong movement. Markets during the final few days of the calendar year often continue to move strongly in the direction of the prevailing trend, which currently is long stocks and the U.S. Dollar, but this does not currently seem to be the case.
I complain a lot about how too many traders do not study large amounts of historical data to get a rough idea of probabilities. With a widely available program like Microsoft Excel and its (free) equivalents, there is no real excuse! Today I am going to explore what I call “volatility profiles” of the major Forex pairs.
I have calculated how many times the range of a calendar day meets or exceeds the 20-day average true range (ATR). I use this as a benchmark as it is often used by traders, especially in selecting profit targets. For example, if the 20-day ATR is 100 pips, and a trader is long that pair and it has already moved 80 pips that day, they might look for another 20 pips before exiting. So, let’s see how often each pair makes its 20-day ATR of multiples of it up to 3, since 2001:

Clearly, all the pairs are more likely on any given day to not make their ATR 20 than make it. Note how rare it is for 2X ATR to be reached (perhaps 1 in every 40 days, or 25 days for USD/JPY), let alone 3X ATR which is reached at most one in every 125 days.
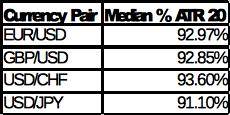
Neither does it make sense to use ATR 20 as a target. What makes sense is instead the median of the daily ATR 20 results, which are shown as a fraction of ATR in the table below:

One final note: we have seen over the past 15 years the greatest amount of volatile days in USD/JPY, and the least in GBP/USD.

