The Forex market was quiet today, which wasn’t a great surprise as there wasn’t much news scheduled. There was a reasonably large movement late on Monday, and these days the Forex week is often characterized by just two big moves. In fact, traders probably make 90% of their profits from these one or two big moves each week, but that’s a subject for another time.
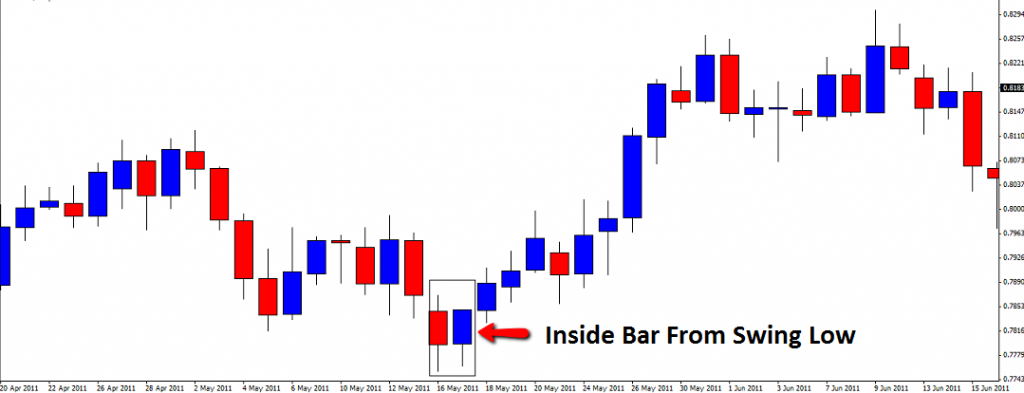
Turning to an evergreen topic in place of the dull market, I hadn’t thought for a long time about trading with inside bars (or inside candles, as I prefer to call as I trade with Japanese Candlestick charts and not bar charts), but it occurred to me to run some tests the other day and the results were quite impressive. Inside candles are candles with a lower high and higher low than the immediately previous candle. They can be interesting to traders for two reasons. Firstly, they can represent a period of consolidation within or at the end of a trend, giving an opportunity to trade a continuation or reversal, depending upon the bigger picture. So far so good, there is nothing special about that as there are a few candlestick formations which can fulfil the same function. It is the second factor that makes inside candles special: they tend to be small, or at least relatively so compared to an average true range of the past several candlesticks. It is their smallness that can make them a low-risk entry. It is old news, yet worth repeating, that a 100 pips profit with a 20 pips stop is twice as good a trade as the same profit with a 40 pip stop. Inside candles often provide an opportunity to enter with a very tight stop, if you just put the stop the other side of the inside candle, although in some situations where the price feels bouncier it can make sense to place the stop a little further away, usually at the other side of the mother candle (the immediately preceding candlestick).
How effective can they be? Well, here are the results of a back test of a trend trading system on the 4 major Forex currency pairs from 2001 to 2016 using the usual filters: 3-month and 6-month trends, faster moving average trend side of a slower moving average, RSI indicator trend side of 50 on all time frames. The results (using the tighter stop method) were as follows:

Note that what we see here is an even better result than what we got using the same system with volatility candles making the same highs or lows, or using a pull-back system with a volatility turn. That is meaningful and suggests inside candles are worth considering as an entry trigger.

