 Yesterday I wrote about how you can use a simple indicator, linear regression, to identify and measure trends. Trading with the trend is the most simple and enduring edge that new traders have available to exploit, and it can be done without great difficulty. I performed a back test on 16 years of historical daily EUR/USD data to show that an edge can be found using this tool on trends as short as 20 days. Today I’m going to look at weekly data, as longer-term trends tend to produce more positive results for trend-following strategies.
This back test looks at the previous 20 weeks and compares two metrics to determine the trend:
If the price is higher than it was 20 weeks ago; a long trade is entered and held for a week. If the price is lower than it was 20 weeks ago, a short trade is entered and held for a week.
If the slope of the linear regression is at a certain minimum positive level, a long trade is entered and held for a week, and vice versa for a short trade.
We then filter 2. by applying a minimum R Squared value.
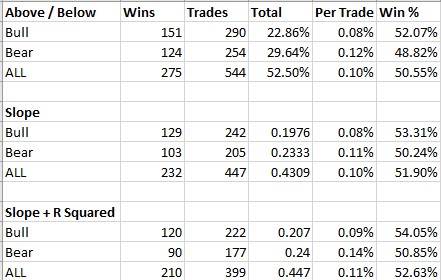
Here are the results for EUR/USD over the same period used yesterday, but using 20 weeks instead of 20 days:
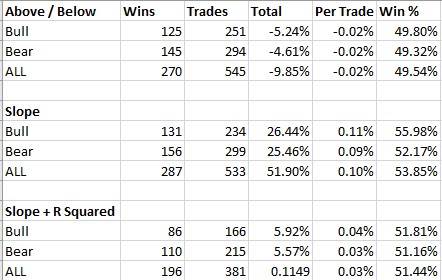
The results using linear regression indicators are very slightly better than just using the price itself looking back 20 weeks. Let’s look at another major currency pair, the USD/JPY:
The results are dramatically better here, although using R Squared as a filter significantly worsens the results. It does seem that overall, using a Linear Regression with a minimum slope as an indicator to determine the trend produces better results than a simple price look back.


