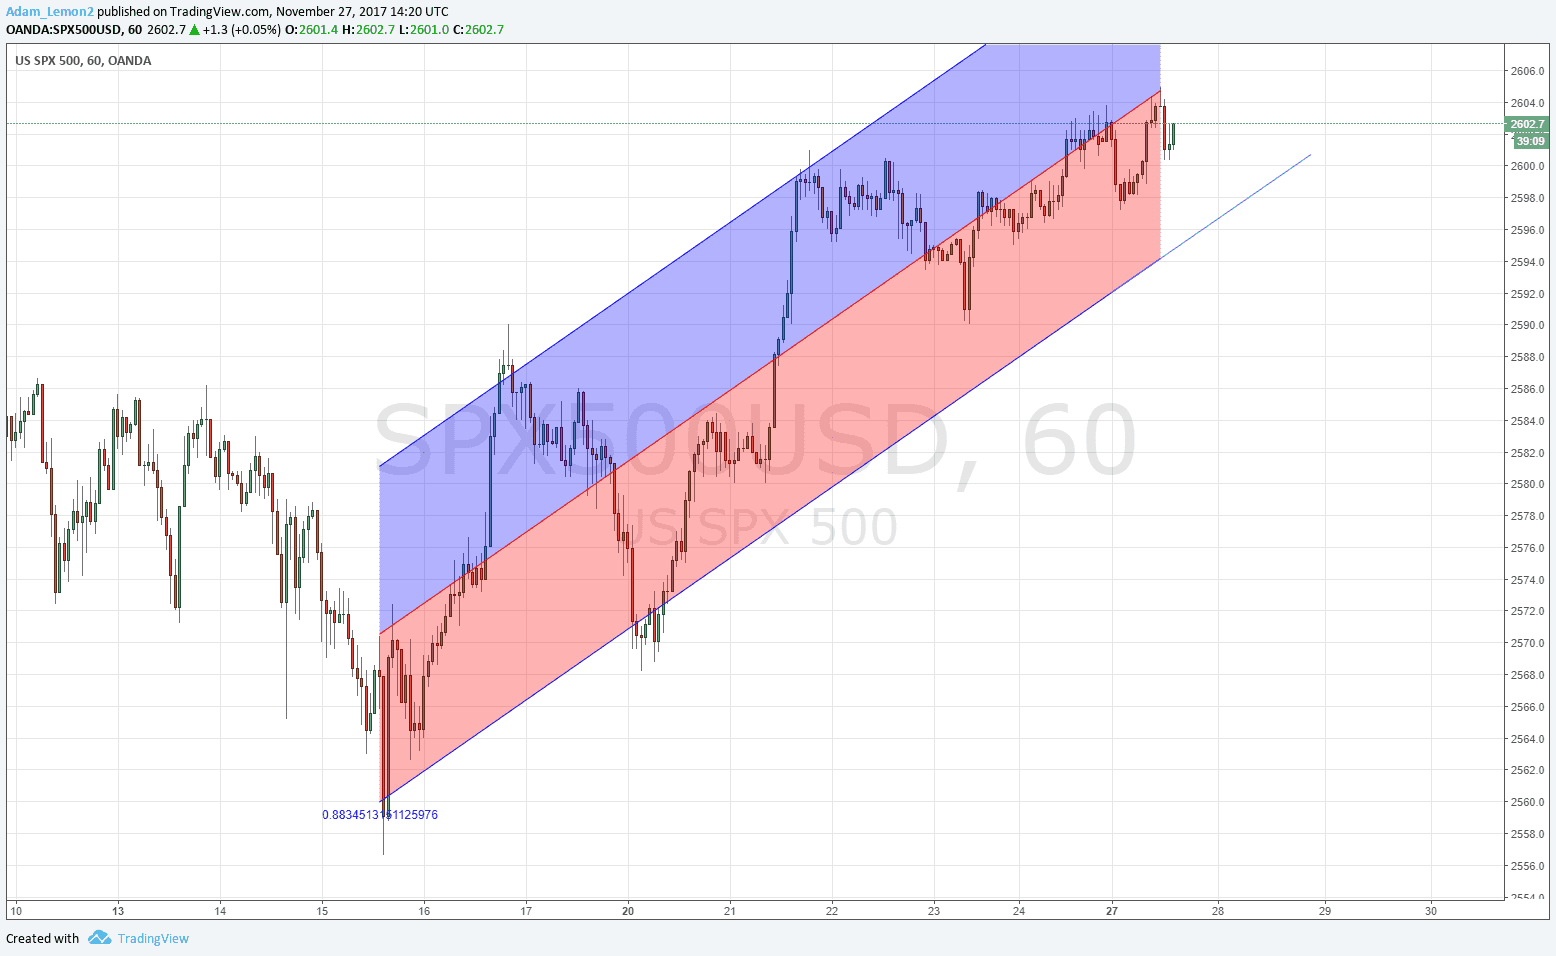
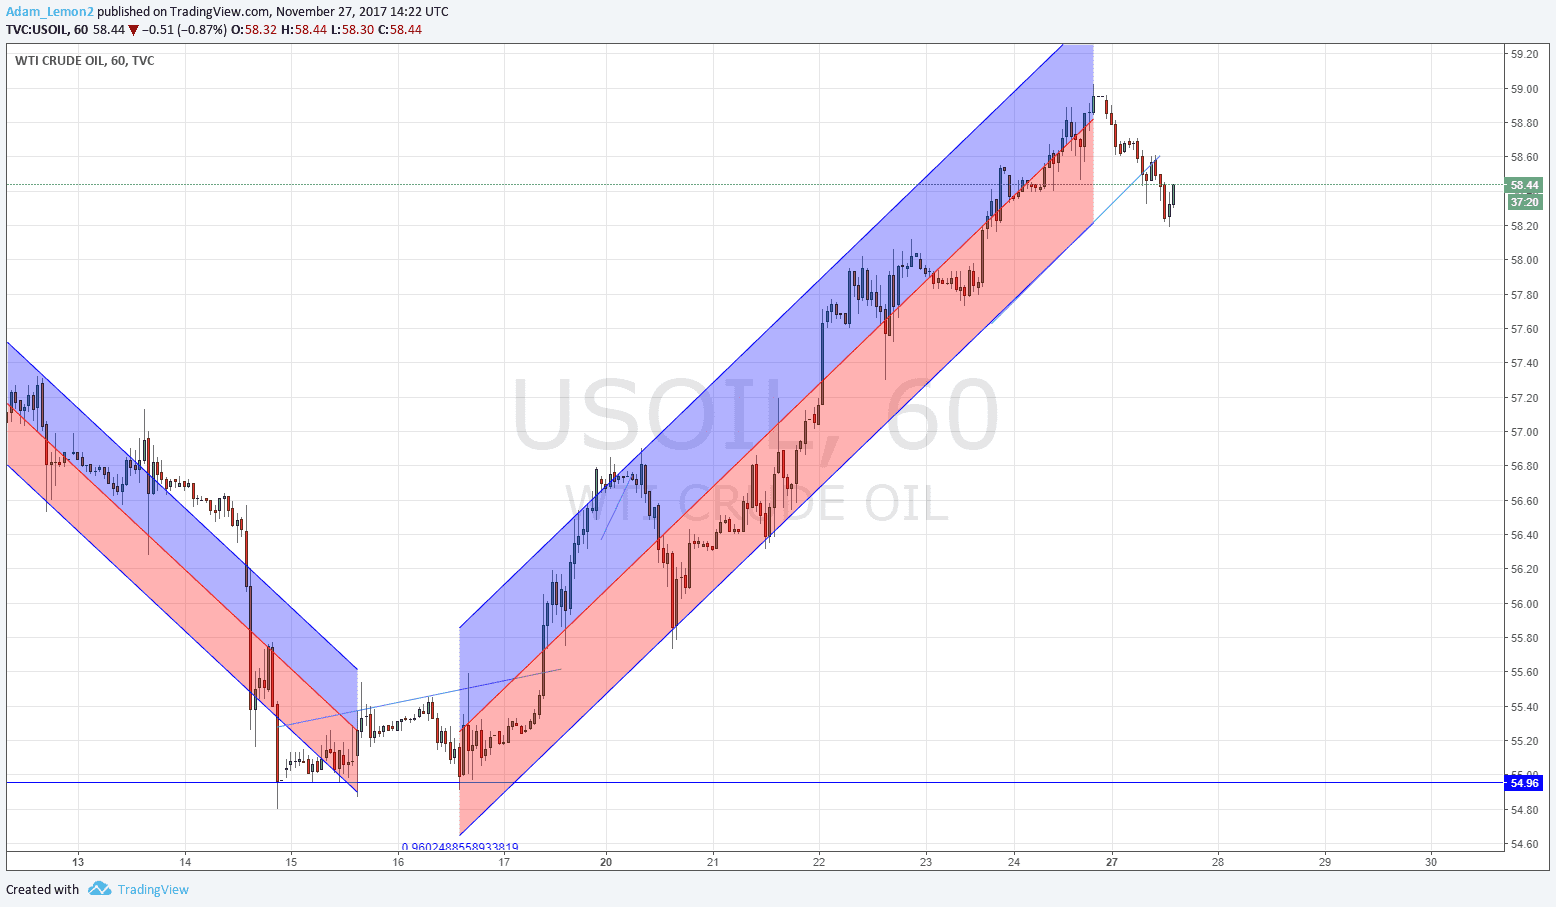
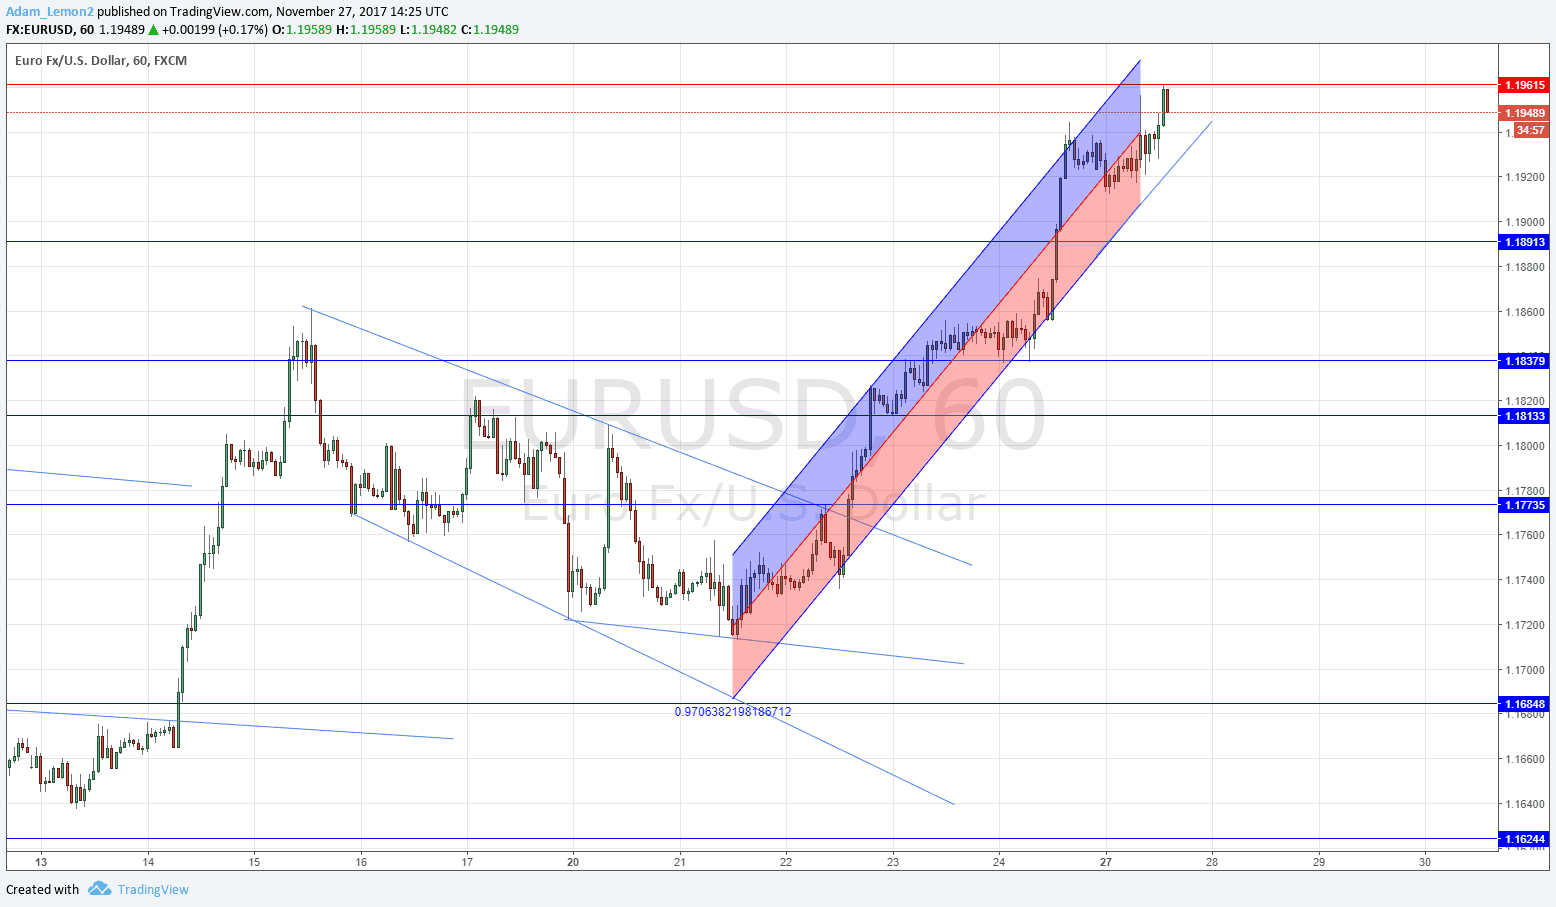
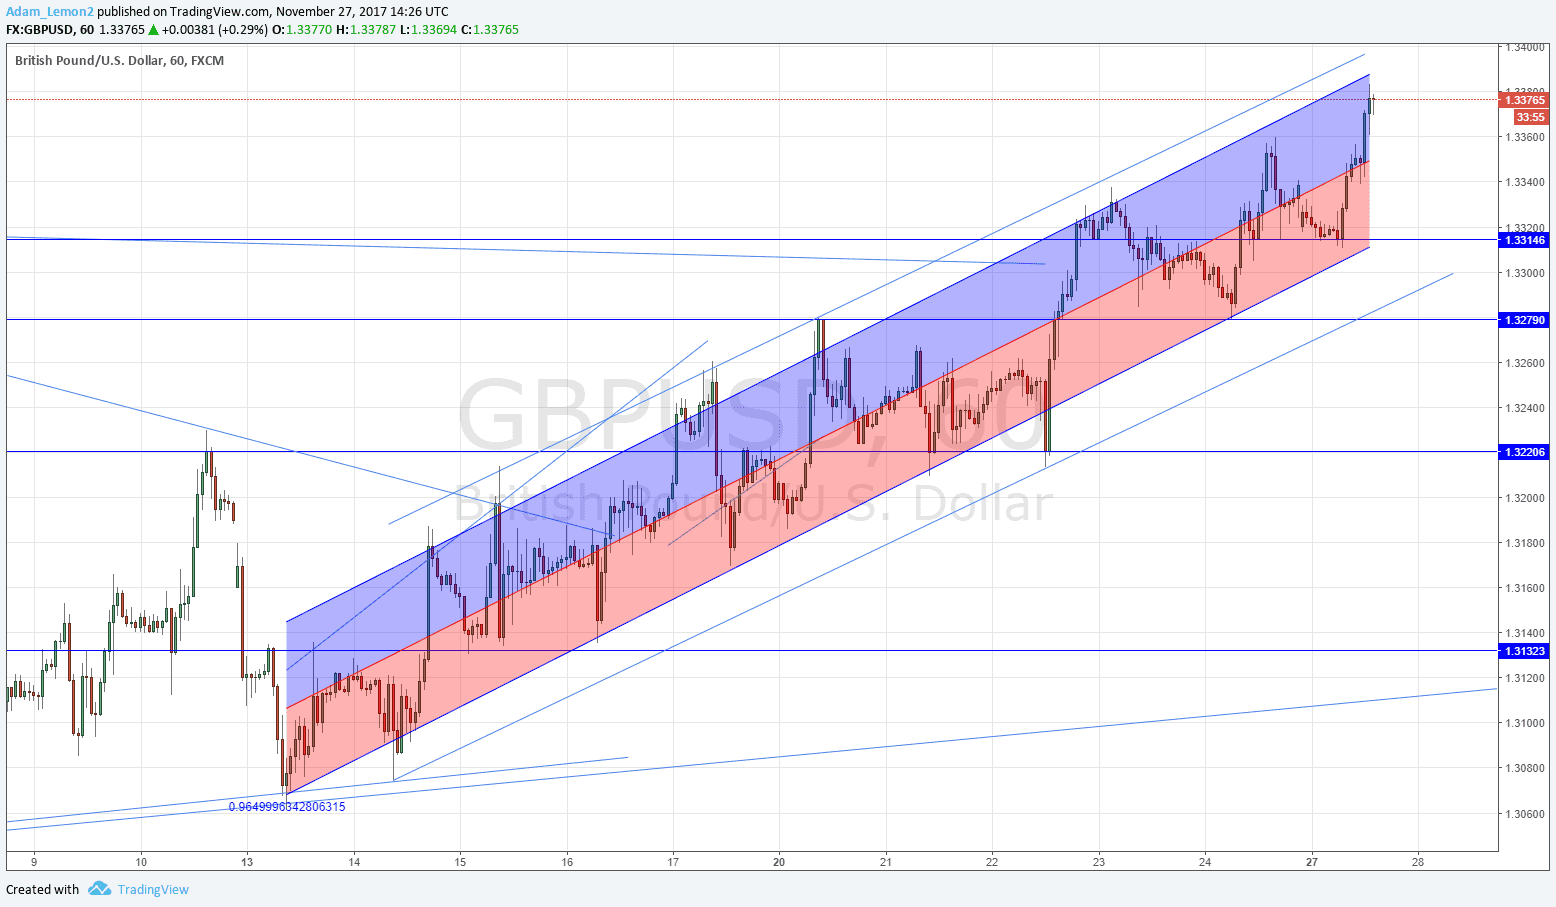
At the end of last week there were four clear trends holding steady over both short and long-term timeframes: EUR/USD, GBP/USD, Crude Oil, and the S&P 500 Index. They were all bullish trends. When you trade with the trend, it is often a problem to know when to exit a profitable trade. There is no easy answer, but there are some methods which seem to work better than others. Basically, if the trend is healthy and broadly moving in the right direction, it’s a good idea to stay in the trade. Experienced traders can do this with the naked eye, but a great indicator you can use is a linear regression price channel using some measure of standard deviation. Once the trade is in profit by a factor of about two, just draw the channel from the lowest point to the highest point, starting at the origin or the short-term price move which gave you entry. It is important to keep extending the channel as the price goes on to make new highs (or lows, depending upon whether it is a bullish or bearish trend.
Here is an example. Let’s say you are trading the S&P 500 Index long and the trade is now at a floating profit of about 2 to 1. We draw a linear regression channel from the low to the high, using 2 standard deviations in the indicator (this is relatively wide). The using a trend line, draw a continuation of the lower channel trend line. You exit the trade when the price breaks this trend line. More experienced traders might prefer to wait an hour or so and see if the price bounces back inside the channel – this can happen a lot.
Another one that was looking good last week was Crude Oil, but unfortunately (or fortunately, if you took a nice profit), the lower channel trend line has already broken:
Another two that are still in play are EUR/USD and GBP/USD, the latter of which has been in such a clear channel that you hardly need to draw the indicator (that’s the second chart below).
If you trade like this, it’s very important to pick trades that are in long-term trends lasting several months.


