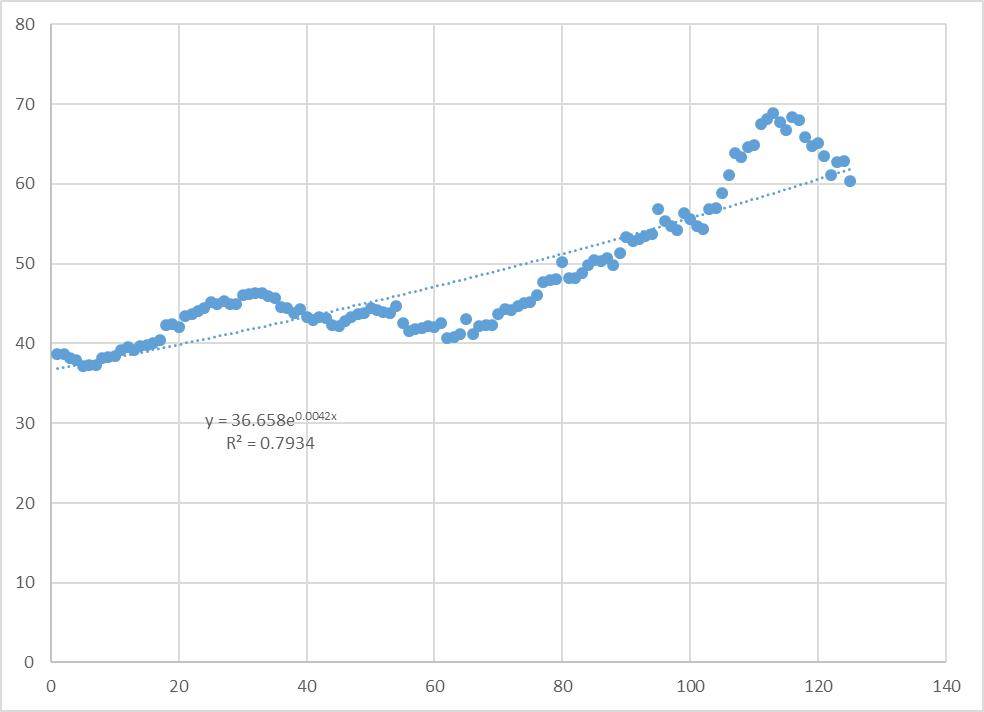
One of the best ways to make profit in the market over recent years is by buying leading stocks in the American stock markets, holding them through bull market cycles. It takes patience, but has delivered some excellent results, even without the use of any leverage. Of course, stocks are risky in a way that Forex is typically not, with major indices sometimes falling by as much as 22% in a day or two – yet the Swiss Franc episode in 2015 showed that a major currency could fall, effectively immediately, by 13% or even more. This would only be comparing stock indices with Forex currency pairs of course – individual stocks are even more risky, and can evaporate very quickly, at least in smaller companies, although even large S&P 500 members such as Enron were not immune to the same problem. Having several stocks in an investment portfolio can get rid of much of that type of risk, although no matter how diversified you are, stock investing can easily undergo 30%+ drawdowns for months at a time.
So, if you are going to buy and hold stocks during a bull market, what is the best way to go about doing it? Which stocks should you pick? The answer to that depends upon your own risk appetite and investing philosophy. If you are interested in academic research about stock markets, you will find that research have shown that stock markets do exhibit a time series momentum effect, especially on the long side, which usually performs better than selecting on value. So, is it just a question of ranking the stocks that have gone up the most over the past 6 months, year or whatever period you choose to use (6 months has worked best in recent years, by the way)? You can do it like that, but there is a filtering method for selecting momentum stocks that has improved results: run an exponential regression analysis on the recent price history, giving you an estimated daily percentage rise, then multiply it by the R squared value. This produces a variable (popularized by Andreas Clenow, who has lots of clever ideas on momentum and trend following)) which should identify how smoothly and exponentially. Then by applying a minimum threshold, investing in the top X number of stocks ranked by this value, you should be investing in the smoothest momentum.
By now you might be asking how to perform an exponential regression analysis. You won’t see this indicator on any normal platform and I have not seen a publicly available list ranking stocks by the variable. Yet there is an easy (though somewhat time consuming) way to do it yourself. Simply open an excel spreadsheet with one column of historical price data, ranked from oldest to newest. The time stamp should run in single increments (i.e. 1,2,3,4…). Select a scatter plot chart and create a graph by selecting the data. Then right click on the graph and choose “Add Trendline”, then format the trend line and select Exponential under Trendline Options. Select Suddenly, an exponential trend line is printed, and several numeric values are given. The value on the top right is the daily exponential price change, and Display Equation on Chart and Display R-squared Value on Chart. The equation value is given on the top right and is followed by an X, and the R-squared value is shown beneath that.
You do need a ranking of top performing stocks, working down from the top. You will find the ones that give the best exponential values are also top performers in regular percentage terms.

