 In February 2018, I wrote a piece highlighting the relative performances of the FAANG stocks (Facebook, Apple, Amazon, Netflix, and Google). These stocks were highlighted at the time because of their stunningly bullish performance over recent months and years, but some analysts were beginning to question whether they may be ripe for sharp falls and as such be good candidates for profit-taking or even short trades. As a technical trader, I am usually prepared to buy stocks making new all-time highs in an overall bull market, and some of these stocks fit the bill. I owned Amazon and Netflix at around this time and managed to cash out with some profit.
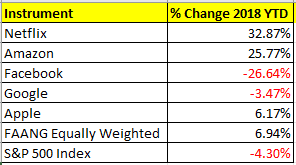
What a difference nine months makes, with the wider S&P 500 Index leading the American stock market to bear market territory (at least by the indicators I use, which tend to work better than the traditional “20% off the high benchmark”). Let’s have a look at the performances of the FAANG stocks compared to the S&P 500 Index since the start of 2018:
It’s interesting that amidst all the talk of collapsing FAANG stocks, all of them are still outperforming the index over this calendar year, except Facebook. However, when you use the traditional 20% decline from a high price indicator, the FAANG stocks are all in a bear market. My table above does not truly reflect recent sharp falls, especially in Netflix. Yet calling “bear market” in individual stocks is a little disingenuous.
Another noteworthy point is the relative underperformances from Apple and Google as well as Facebook. Everyone knows about Facebook’s structural and reputational problems which have emerged this year, but few would say the same about Apple and Google, so that’s a surprising statistic.
Turning finally to month to date statistics, the worst performer is Apple, followed by Netflix and Facebook which are tied in second place. It is often industry leaders such as Apple which fall the hardest in bear markets.

