As a long-time Forex trader and senior analyst at DailyForex.com, perhaps the most important thing I can tell you about my trading style is that I use technical analyses for my decision-making process. You'll soon notice that for my analyses, I primarily use the price chart, support and resistance levels and some key Fibonacci levels. I'm more price action-oriented, so I don't use any indicators, moving averages or RSI's, and I use FXTM and AvaTrade as my main brokers for Forex trades.
Let me give you a brief tour of my routine when doing a weekly analysis. I first start off by looking at the economic calendar, because I want to get a handle on what’s going to drive price action or charts in the next week or two ahead. Being a technical trader, I don’t look at the economic calendar in terms of trying to make price decisions and I don't made make predictions based on economic announcements. For example, I won't look at the CPI or an interest rate announcement and decide I can tell what the trade will be. Looking at the economic calendar is more to get an idea of what is likely to propel the chart. I also make sure not to get into a trade in the half-hour or hour before a key announcement, because often a pricing gap or the differential can be high.
Let's start with the economic calendar. This week is a relatively quiet week, especially given the last few weeks that we’ve had. Just over a month ago, the U.S. election took place. It was a very uncertain time. Nobody quite knew how it was going to unfold, and nobody quite knew how long it would take for the result to be properly announced. Although there is a 99 percent certainty that Joe Biden will be the next President of the United States, there is still an air of uncertainty as to how this transition process will go.
Tomorrow, Wednesday, December 9, 2020 at 3:00 PM (GMT) there will be a Bank of Canada statement and an overnight rate announcement. This is an interest rate announcement about key interest rate figures that will primarily affect the USD/CAD pair and any CAD-related pair. The following day, Thursday, December 10, 2020 at 12:45 PM, there will be a refinancing rate and a monetary policy statement that will affect the euro. About 45 minutes later, the European Central Bank will hold a press conference, probably to discuss what they just announced in the prior 45 minutes.
At the same time, coincidentally, the Consumer Price Index (CPI) and unemployment claims will be released by the U.S. that will affect every major pair. Come Friday afternoon at 1:30 pm, the United States Core Producer's Price Index (PPI) will be released, which is also a big gauge for inflation and interest rates.
This economic calendar tells us that there will be two big USD announcements later in the week that will affect every major pair, a couple of EUR announcements and a possibly large effect on the USD/CAD, depending on the gravity of the Bank of Canada announcement.
Now when it comes to looking at charts for weekly analyses, I do most of my trading based on the four-hour chart. I might zoom out to the daily chart, and very occasionally I’ll check the weekly chart for any key support and resistance levels, but I primarily use the four-hour chart. I might also zoom in to the one-hour or 15-minute chart.
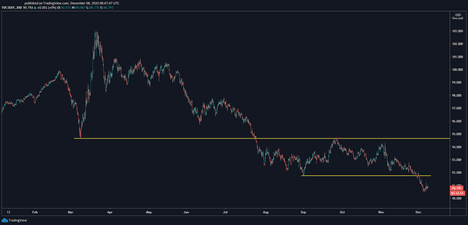
Let's start by taking a look at the US Dollar Index, because it’s broken a few key levels. The US Dollar Index (USDX) is an index that measures the strength of the U.S. dollar against a bunch of other pairs. I personally don’t trade this index. While it is tradable, and there are some Forex brokers and CFD brokers who actually trade the USDX, I use it because it tells me the direction of the overall U.S. dollar.
So if I think the USDX is looking bearish, which it is at the moment, then I’ll be looking for bearish U.S. dollar trades. Let's look at the daily chart for the U.S. Dollar Index:
US Dollar Index- Daily Chart
You can see this big support marked by the large yellow line that was made earlier in March, and you can see how the volatility really kicked in when the financial impact of coronavirus became apparent, but it broke that support and it tested it really neatly as resistance back in September.
This confirms that the support is now resistance and that we’re really looking at a bearish trend. The last support it made is marked by the smaller yellow line and it moved through it quite cleanly. So I’m looking at a bearish trend for the U.S. dollar. The USDX is going down, so my bias automatically will be to sell the U.S. dollar against various pairs. Being bearish the USD will be my main thesis going into the markets for the next week, and probably for the rest of December and maybe January.
Now if I’m bearish the USD, that means I’m going to be bullish the EUR/USD, because I’m buying the euro and selling the U.S. dollar. Let's look at the daily chart for the EUR/USD:
Daily Chart for EUR/USD
You can see the pair made a key resistance back on the 1st of September. That’s where I had marked the price for some weeks, and recently, in the last few days, it broke through that resistance. I’m bullish the EUR/USD, which is in line with my bearish U.S. dollar outlook. This trend started as a kind of impulse move and now is starting to correct, which you can see around the gray line.
Typically, a trend will have an impulse move and eventually a short correction. What we’re seeing is the price has moved up, busted through that prior resistance and is now correcting. I think this is probably a pretty good buy point. Should you want to, you could line it up with a key Fibonacci level (50 percent is where I like it to come down to). It’s not quite down there, but I don’t think it’s going to make it all the way down there. I think the EUR/USD will continue going up, so I’m bullish EUR/USD.
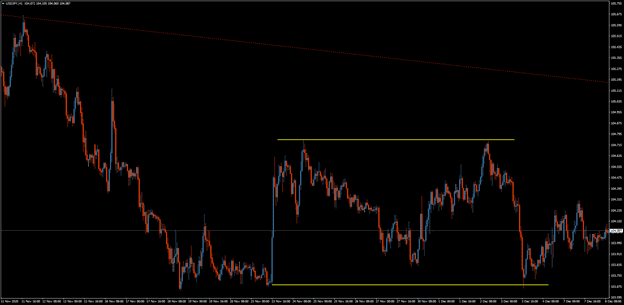
Now let's look at the USD/JPY. This pair is a lot messier, so we'll start with the four-hour chart:
4 Hour USD/JPY Chart
It’s in a downtrend, but it’s a very volatile and choppy downtrend. This is not a fantastic place to be in. I’ve drawn a red line line to mark the downtrend, which is in a bit of a triangle at the moment, but it is still moving down. You can see where I made a support level because this is where the price is really going to start moving up. I’m always looking to see where the price has reacted. It met the support line and then made a resistance, so it’s in a range. This is not a primary trade for me. It’s slightly bullish in the short term, for the next week or two, and not enough for me to want to trade it.
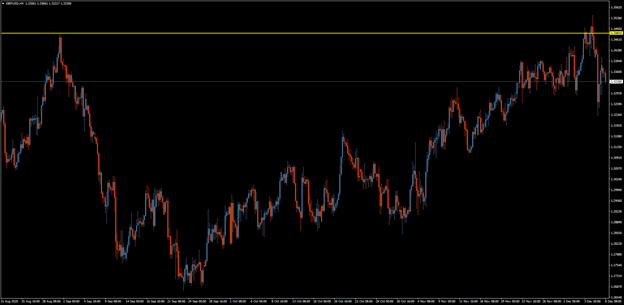
The GBP/USD is interesting because although I’m bearish the USD, I'm also bearish the GBP/USD in itself. This is because I think the pound is going to be more affected by Brexit than by the direction of the U.S. dollar, and I don’t think the Brexit talks will be particularly fruitful. There’s a lot of uncertainty and that’s never good for any currency. But let's look at it purely from a technical point of view on the four-hour chart:
4 Hour GBP/USD Chart
It made a resistance back on the 1st of September, then pushed down, came back up and bounced pretty hard against the resistance you see here on the right. It may actually be starting a new downtrend. The EUR/USD probably is a better trade right now, and my view of the GBP/USD is bearish.
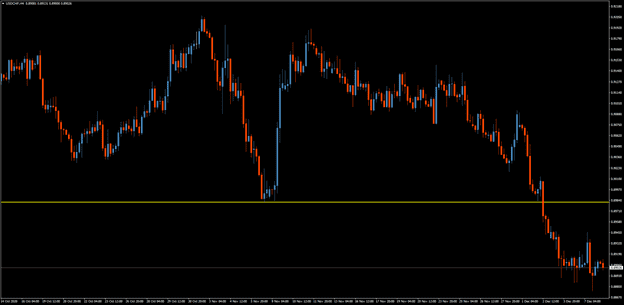
Let's look at the four-hour chart for the USD/CHF:
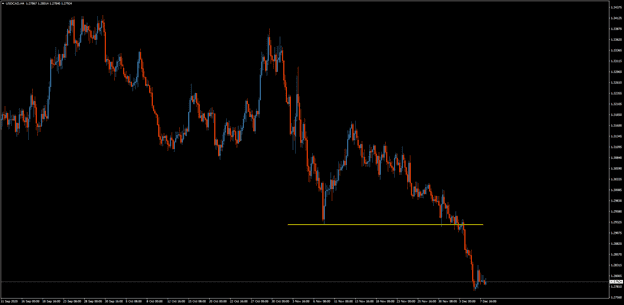
4 Hour USD/CHF Chart
It’s been in a downtrend for a very long time, then got into a range for a few months. You can see there was a support that was made around beginning of November and that it bounced pretty hard off that support. So it was obviously a key level and, when it came down to it, it moved swiftly through that support, which is now gone. There hasn't been support for a while now on the chart, so I’m bearish USD/CHF, which is in line with where the US Dollar Index is going as well. If you were to look at the hour chart for the USD/CHF you would see that it tried to make a move up and again was swiftly sold off.
Let's now turn to look at the four-hour chart for the USD/CAD pair:
4 Hour USD/CAD Chart
The key support level there was made around the same time as the USD/CHF. For the USD/CAD it was made on the 9th of November; the pair moved hard past it and broke the 50 percent level. So between the 50 and 61.8 percent level is a key level for me. I'd like to see the price come up to that before making the next wave down. To sell this, I would have really wanted it to come back up and test the support as resistance, but it moved down too hard, too fast and is just teetering there now. It's safe to say that I'm bearish USD/CAD – again, in line with my USDX thesis. Obviously there’s an announcement tomorrow, but I just can’t see the pair reversing direction.
Now let's switch to the AUD/USD pair by looking at the daily chart:
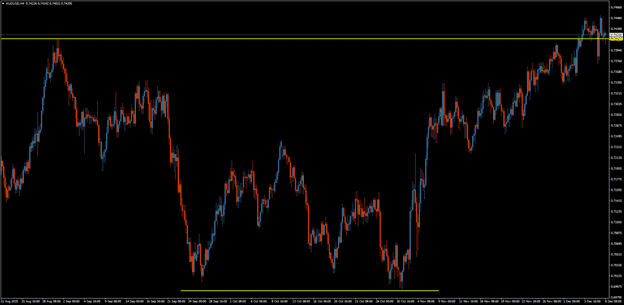
AUD/USD Daily Chart
The reason I’m looking at the daily chart is because it’s just broken a key resistance and I want you to see where that key resistance is coming from. You can see the key resistance up there where I've marked it with a yellow line. Between the end of September to the end of October it built a support area, confirming that the uptrend is holding, and then it broke through that resistance. That’s pretty much a high for the year that it has broken through. You'll also see at the end of the frame how it took a bit of a dip down and sold off within the same trading session. It found liquidity when order flow came in and is holding nicely above the resistance that it broke. So I’m bullish AUD/USD, again in line with being bearish the USD.
Let's move on to the NZD/USD, which you can probably imagine is going to be quite correlated to the Aussie dollar. Here is the four-hour chart for the NZD/USD:
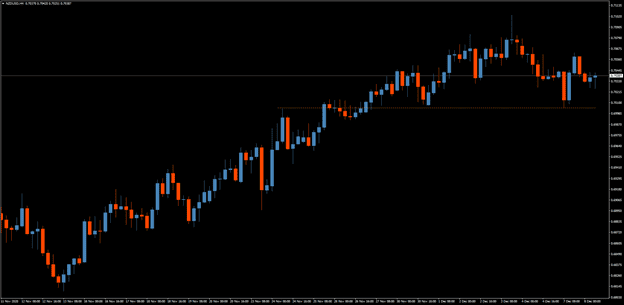
4 Hour NZD/USD Chart
It’s in a really nice uptrend, as you can see. I marked the mini-support it’s made with the dotted yellow line. It’s not a huge support – just a couple of four hour bars – and you can see that it ties in nicely with the small resistance on the way up. It’s making what I would call a non-volatile trend up, neat and compact. This is a nice place to buy the New Zealand Dollar, as it's trending up and has been doing so for a while. I'm actually hearing great things out of New Zealand, particularly how they’ve really got a handle on the coronavirus, which no doubt affects the currency.
I'll run through these major pairs again, just to give you a summary:
I'm bullish the EUR/USD after it broke a key resistance. The USD/JPY is just in a range and I wouldn’t trade it. I'm bearish the GBP/USD because Brexit is happening now and the pair hit a big resistance, and selling off sharply from that resistance tells me it’s bearish. I'm also bearish the USD/CHF – remember that it broke through that very key support, and when it tried to push back up, it sold off very quickly due to order flow. I'm bearish the USD/CAD, because it broke that key support level and pushed down through it, making its way down. I'm bullish the AUD/USD after it broke that key resistance from late August and is holding above it. And the NZD/USD, which we just covered, is in a nice uptrend. When you’re in a nice uptrend this is really where you can make money.
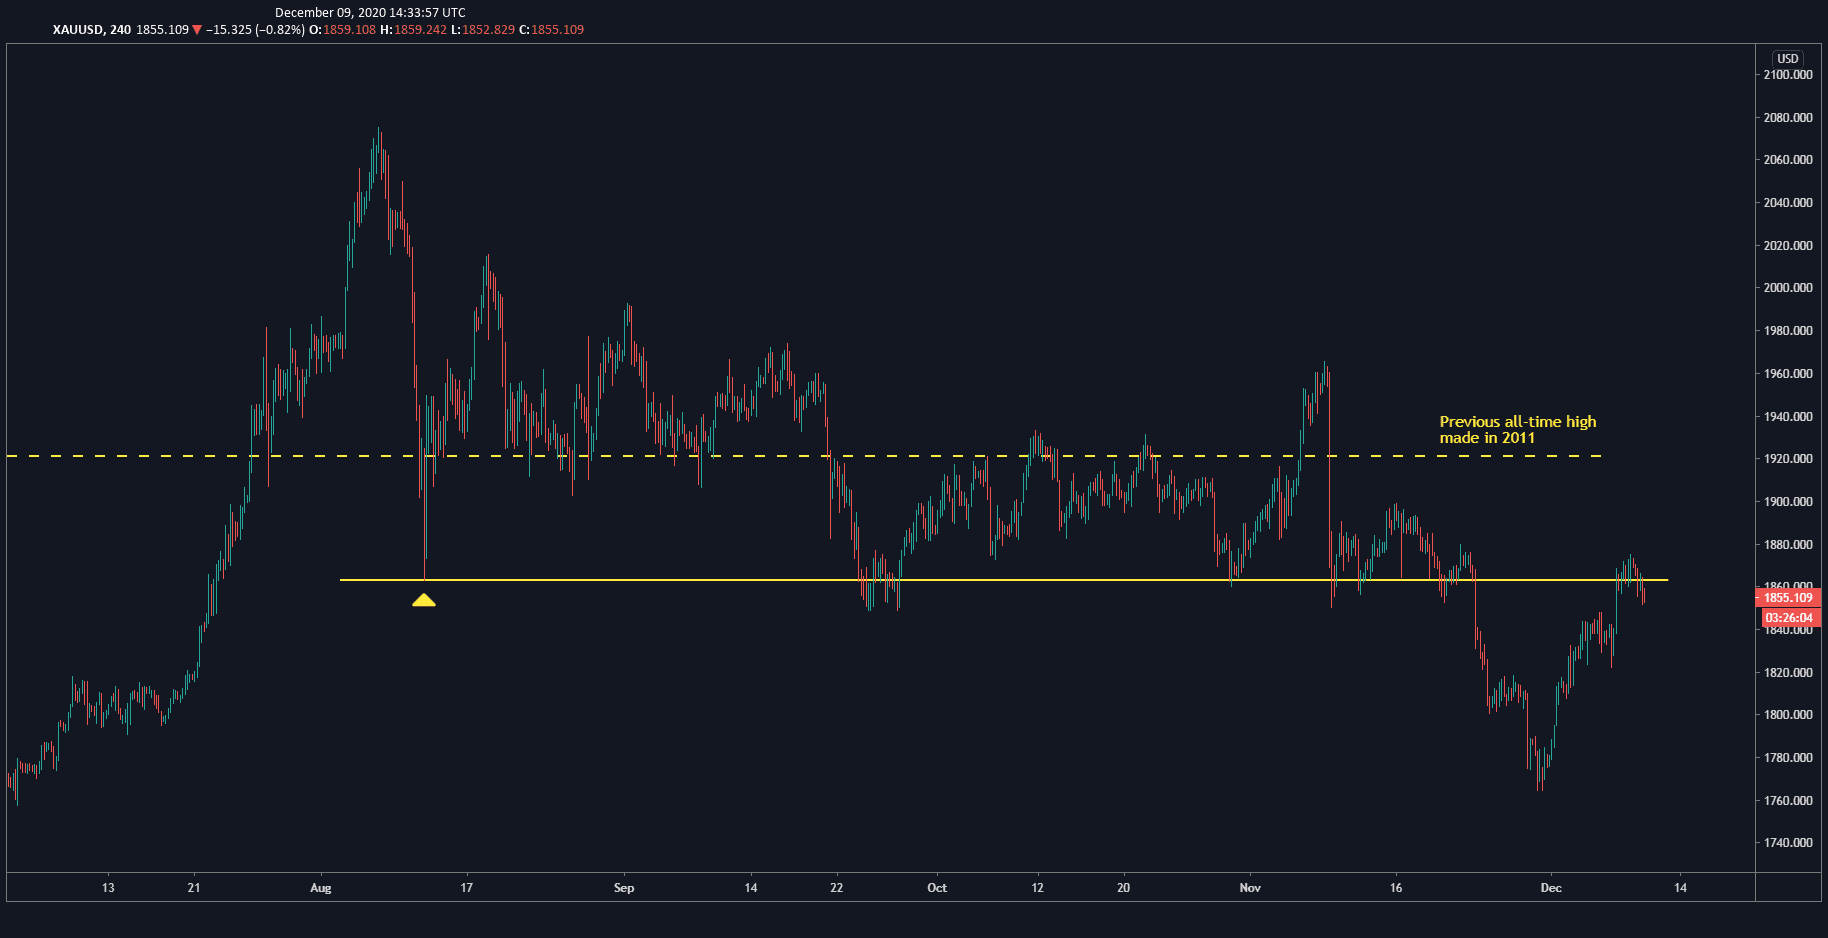
One last thing I want to show you is gold's performance, which I found really interesting to analyze. The dotted yellow line that you see is the all-time high it made back in 2011. From there, gold lost about a third of its value and over the years started slowly climbing back up. Back in July, it broke back above that all-time high, and for a couple of months it held. I thought it was going to continue rocketing up, but instead it broke back below the previous all-time high. Anytime you tried to perch above it, as you can see by the three peaks above the dotted line, it sold off after order flow came in very rapidly. More recently it broke the key support level marked by the solid yellow line. I marked it from there because that is really where the price reacted pretty hard when it pushed back up. Gold is now touching it as resistance and I think it’s going to fall back down, so I’m bearish gold.
Gold's performance
Some final thoughts:
If the chart isn’t clear to you, always stay away. There are plenty of opportunities. I’ve gone through the majors and you can see that I’m clear on some of them, and on some of them I really don’t know. So a general rule for trading is that if the chart isn’t clear, just stay away from that particular chart. Always mind your risk. I think the best practice is to carry a stop loss for every single trade and make sure that your potential reward or target will be higher or more than the value of the stop loss. You want a positive reward-to-risk ratio, which should be above 1, ideally 1.5, 2, 3:1, etc. It depends on your strategy, but ideally your reward will be at least one unit or greater than the value of your stop loss. And the other thing to do when you’re minding your risk is don’t put too much capital into a single trade. Decide a percentage of capital that you are going to risk on a single trade. It can be one percent, it can be three percent, two percent, whatever it is, and stick to that.


