You've probably heard about Fibonacci and the Fibonacci sequence. Most people have. What I want to do is teach you the theoretical basics of how Fibonacci numbers are constructed and how they can be applied to Forex trading and charts.
The Fibonacci sequence was introduced by an Italian mathematician named Leonardo Bonacci in the 12th-13th centuries (around the same time, it was also discovered in parts of South Asia and India). The fundamental concept of these series of numbers, known as the Fibonacci sequence, is that each number is the sum of the previous two, beginning with 0 and 1.
To illustrate, the sequence begins as follows: 0,1,1,2,3,5,8,13,21, and so on, ad infinitum. Add any two consecutive numbers and you will see that the following number is their sum, e.g. 0+1 = 1, 1+1=2, 1+2=3, etc. Of course, just as numbers are infinite, so is the Fibonacci sequence.
So why do we care about the Fibonacci sequence?
In order to explain that, I should tell you about another important discovery about the Fibonacci sequence. If you take any number in the sequence and divide it by the following, larger number, the quotient will always be 61.8%. Feel free to try it. Let's take, at random, 55 and 89. 55 / 89 = 61.8%. Or, again choosing at random, 144 and 233. 144 / 233 = 61.8%.
There are some interesting mathematical properties to the 61.8% figure. Let's take a number line from 0-100 and mark the point at 61.8:
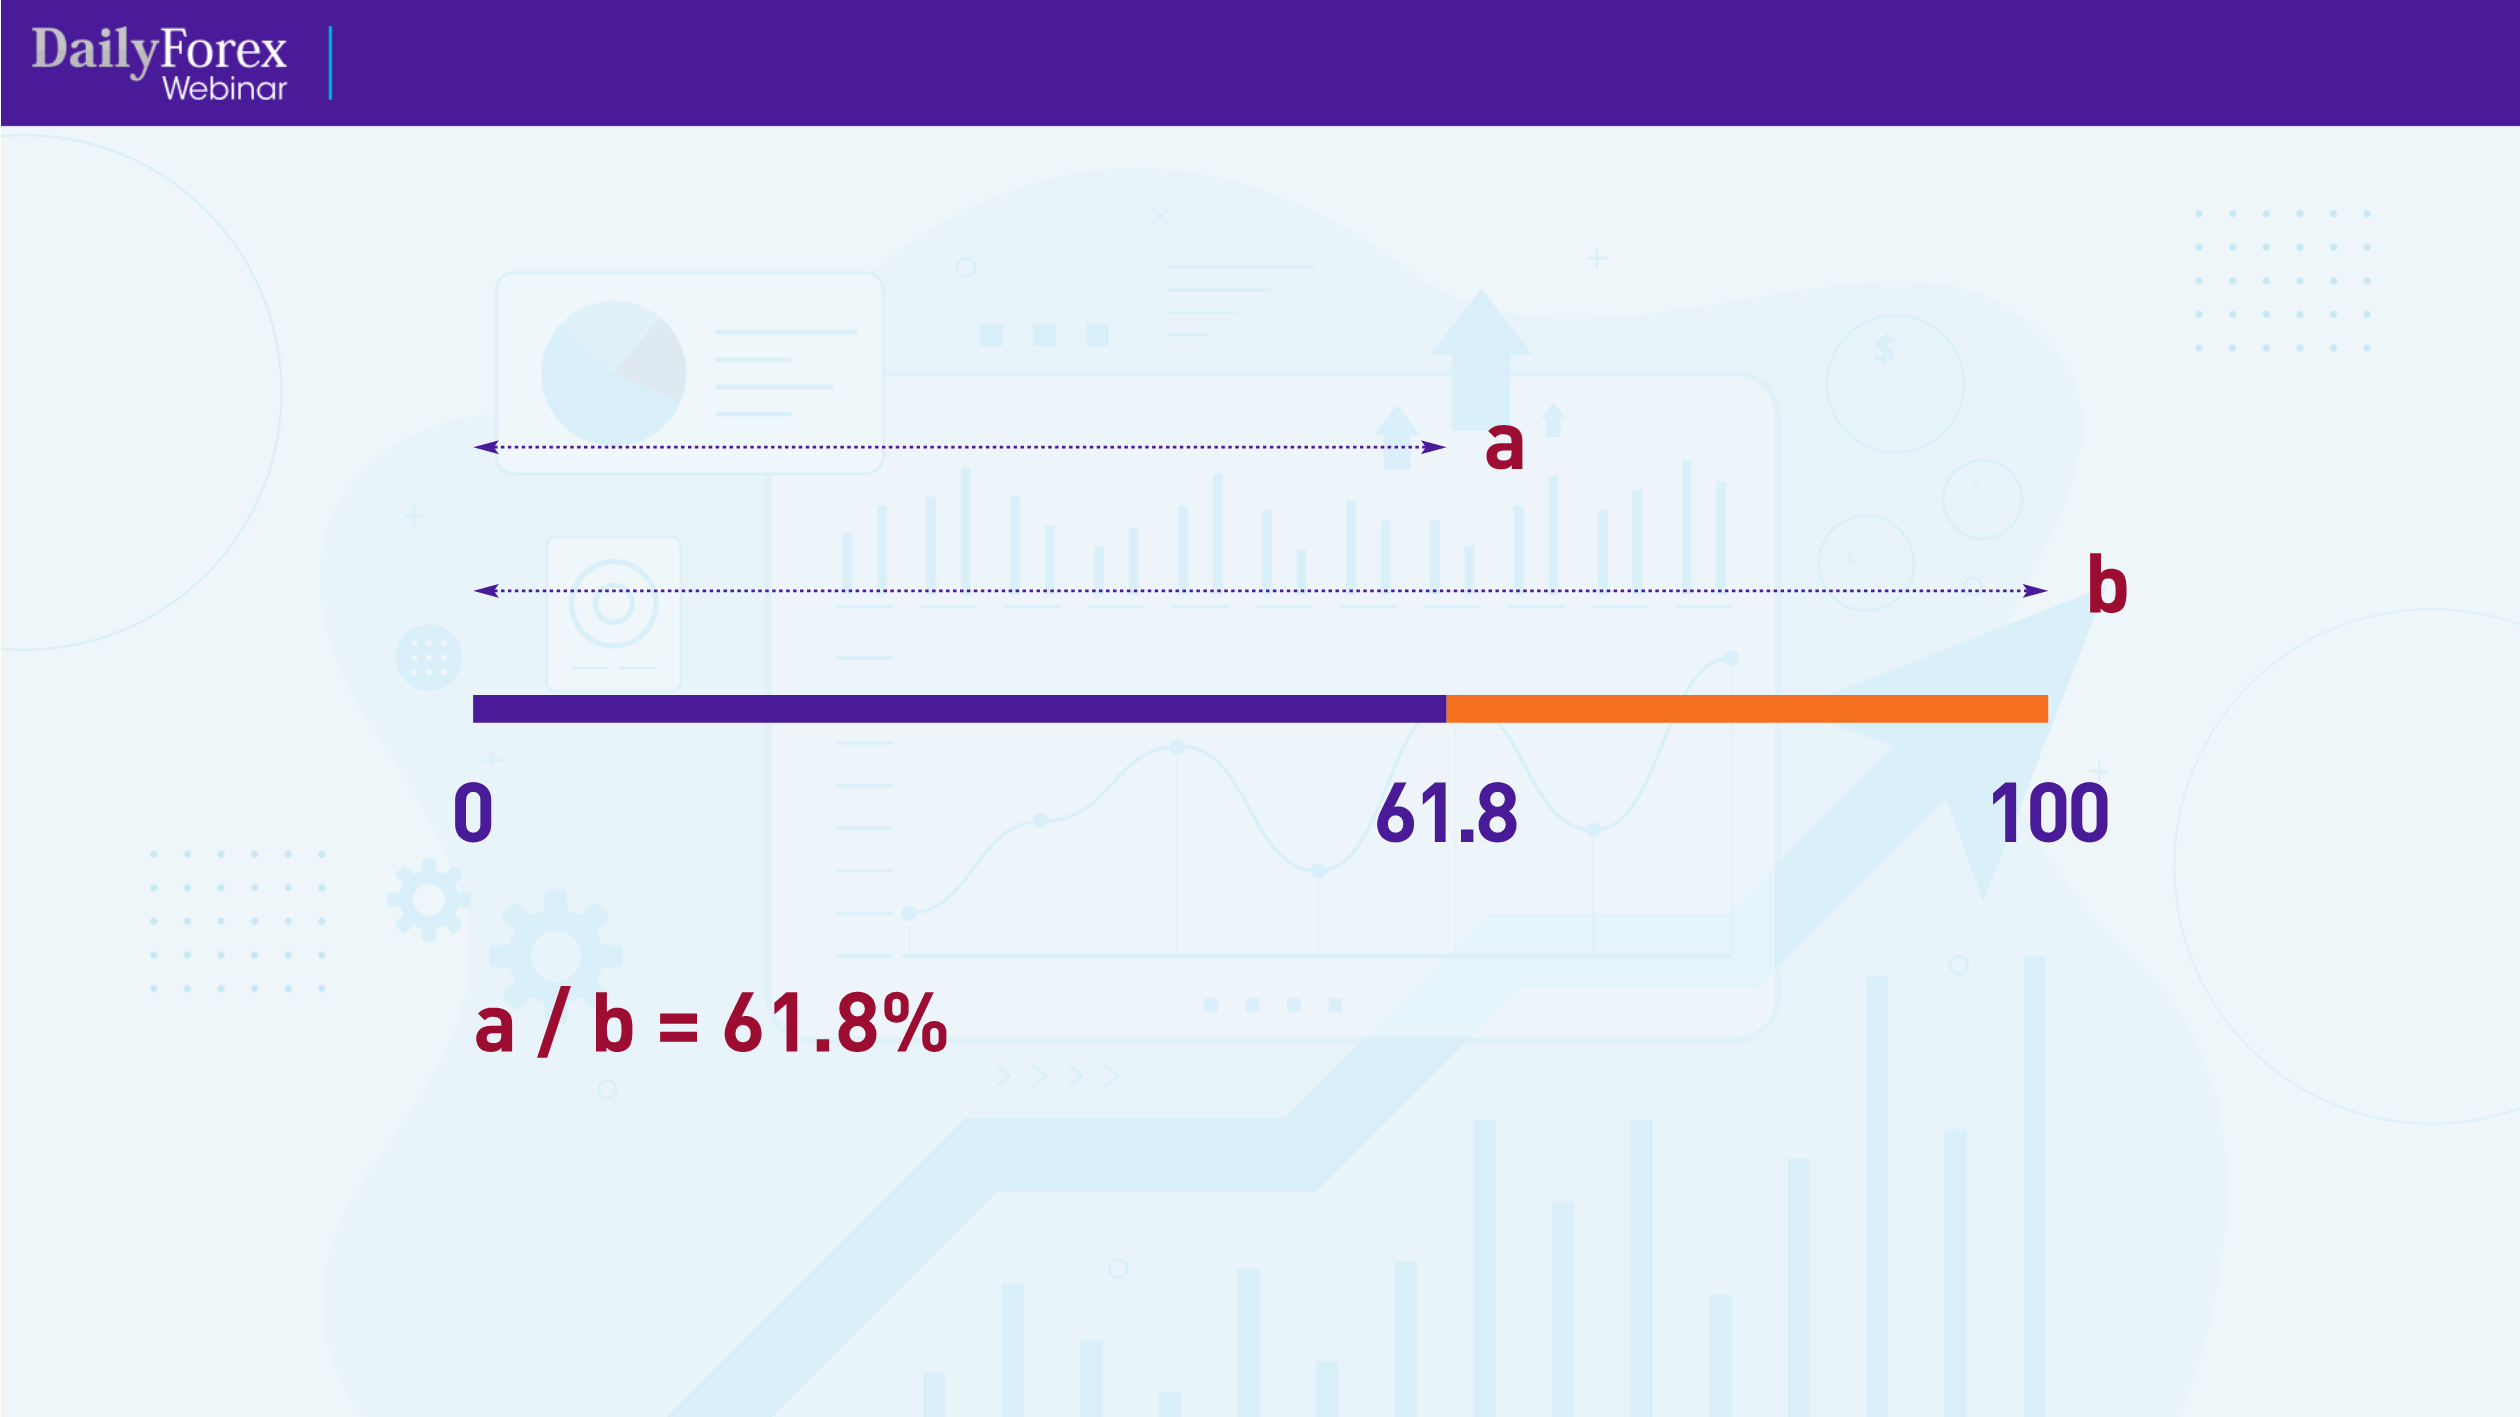 Now let Line A represent the section of the number line from 0 to 61.8, and let Line B represent the entire number line, from 0 to 100. If you divide Line A by Line B, the quotient will be 61.8%.
Let's say that Line A now represents 0 to 61.8, and Line B represents 61.8 to 100:
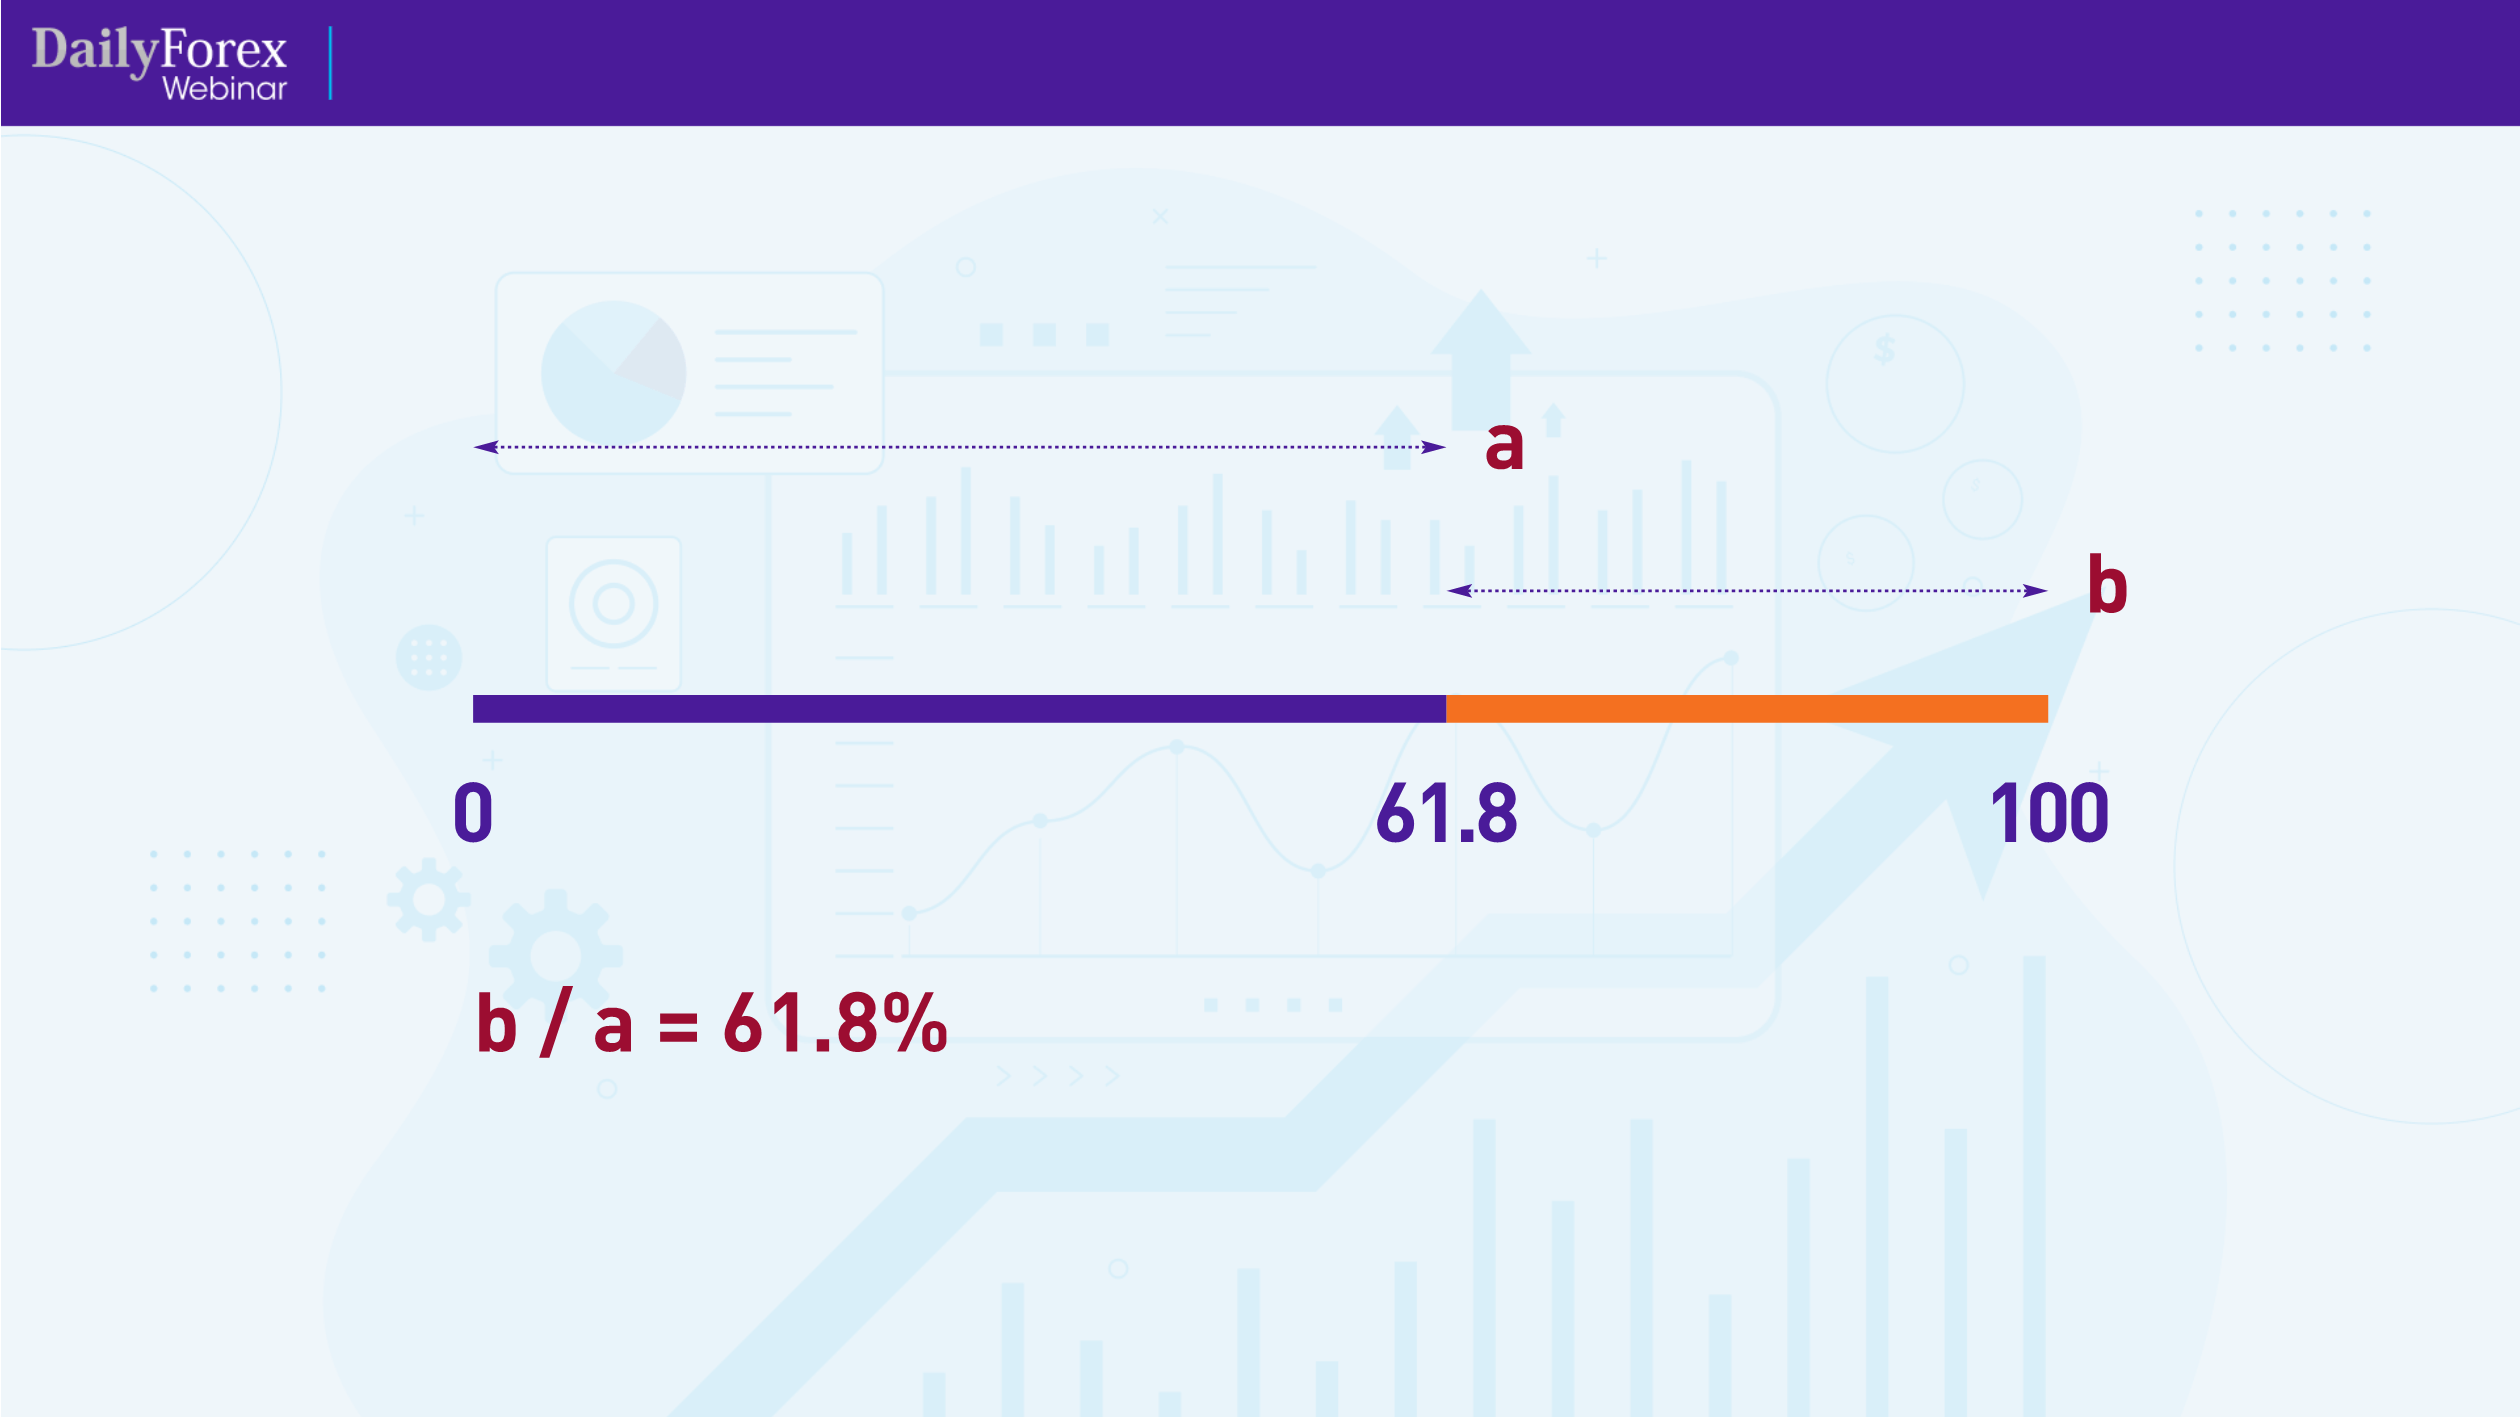
If you divide Line A (now the larger portion of the number line) by Line B (the shorter portion of the number line), the quotient will still remain 61.8%. The 61.8% figure (or 0.618) is a key Fibonacci number, also called the Golden Ratio.
The Fibonacci sequence is a component of our world, our ecosystem and life as we know it; it can be found in the makeup of galaxies and heavenly bodies, the breeding patterns of rabbits, or even in the petals of plant life.
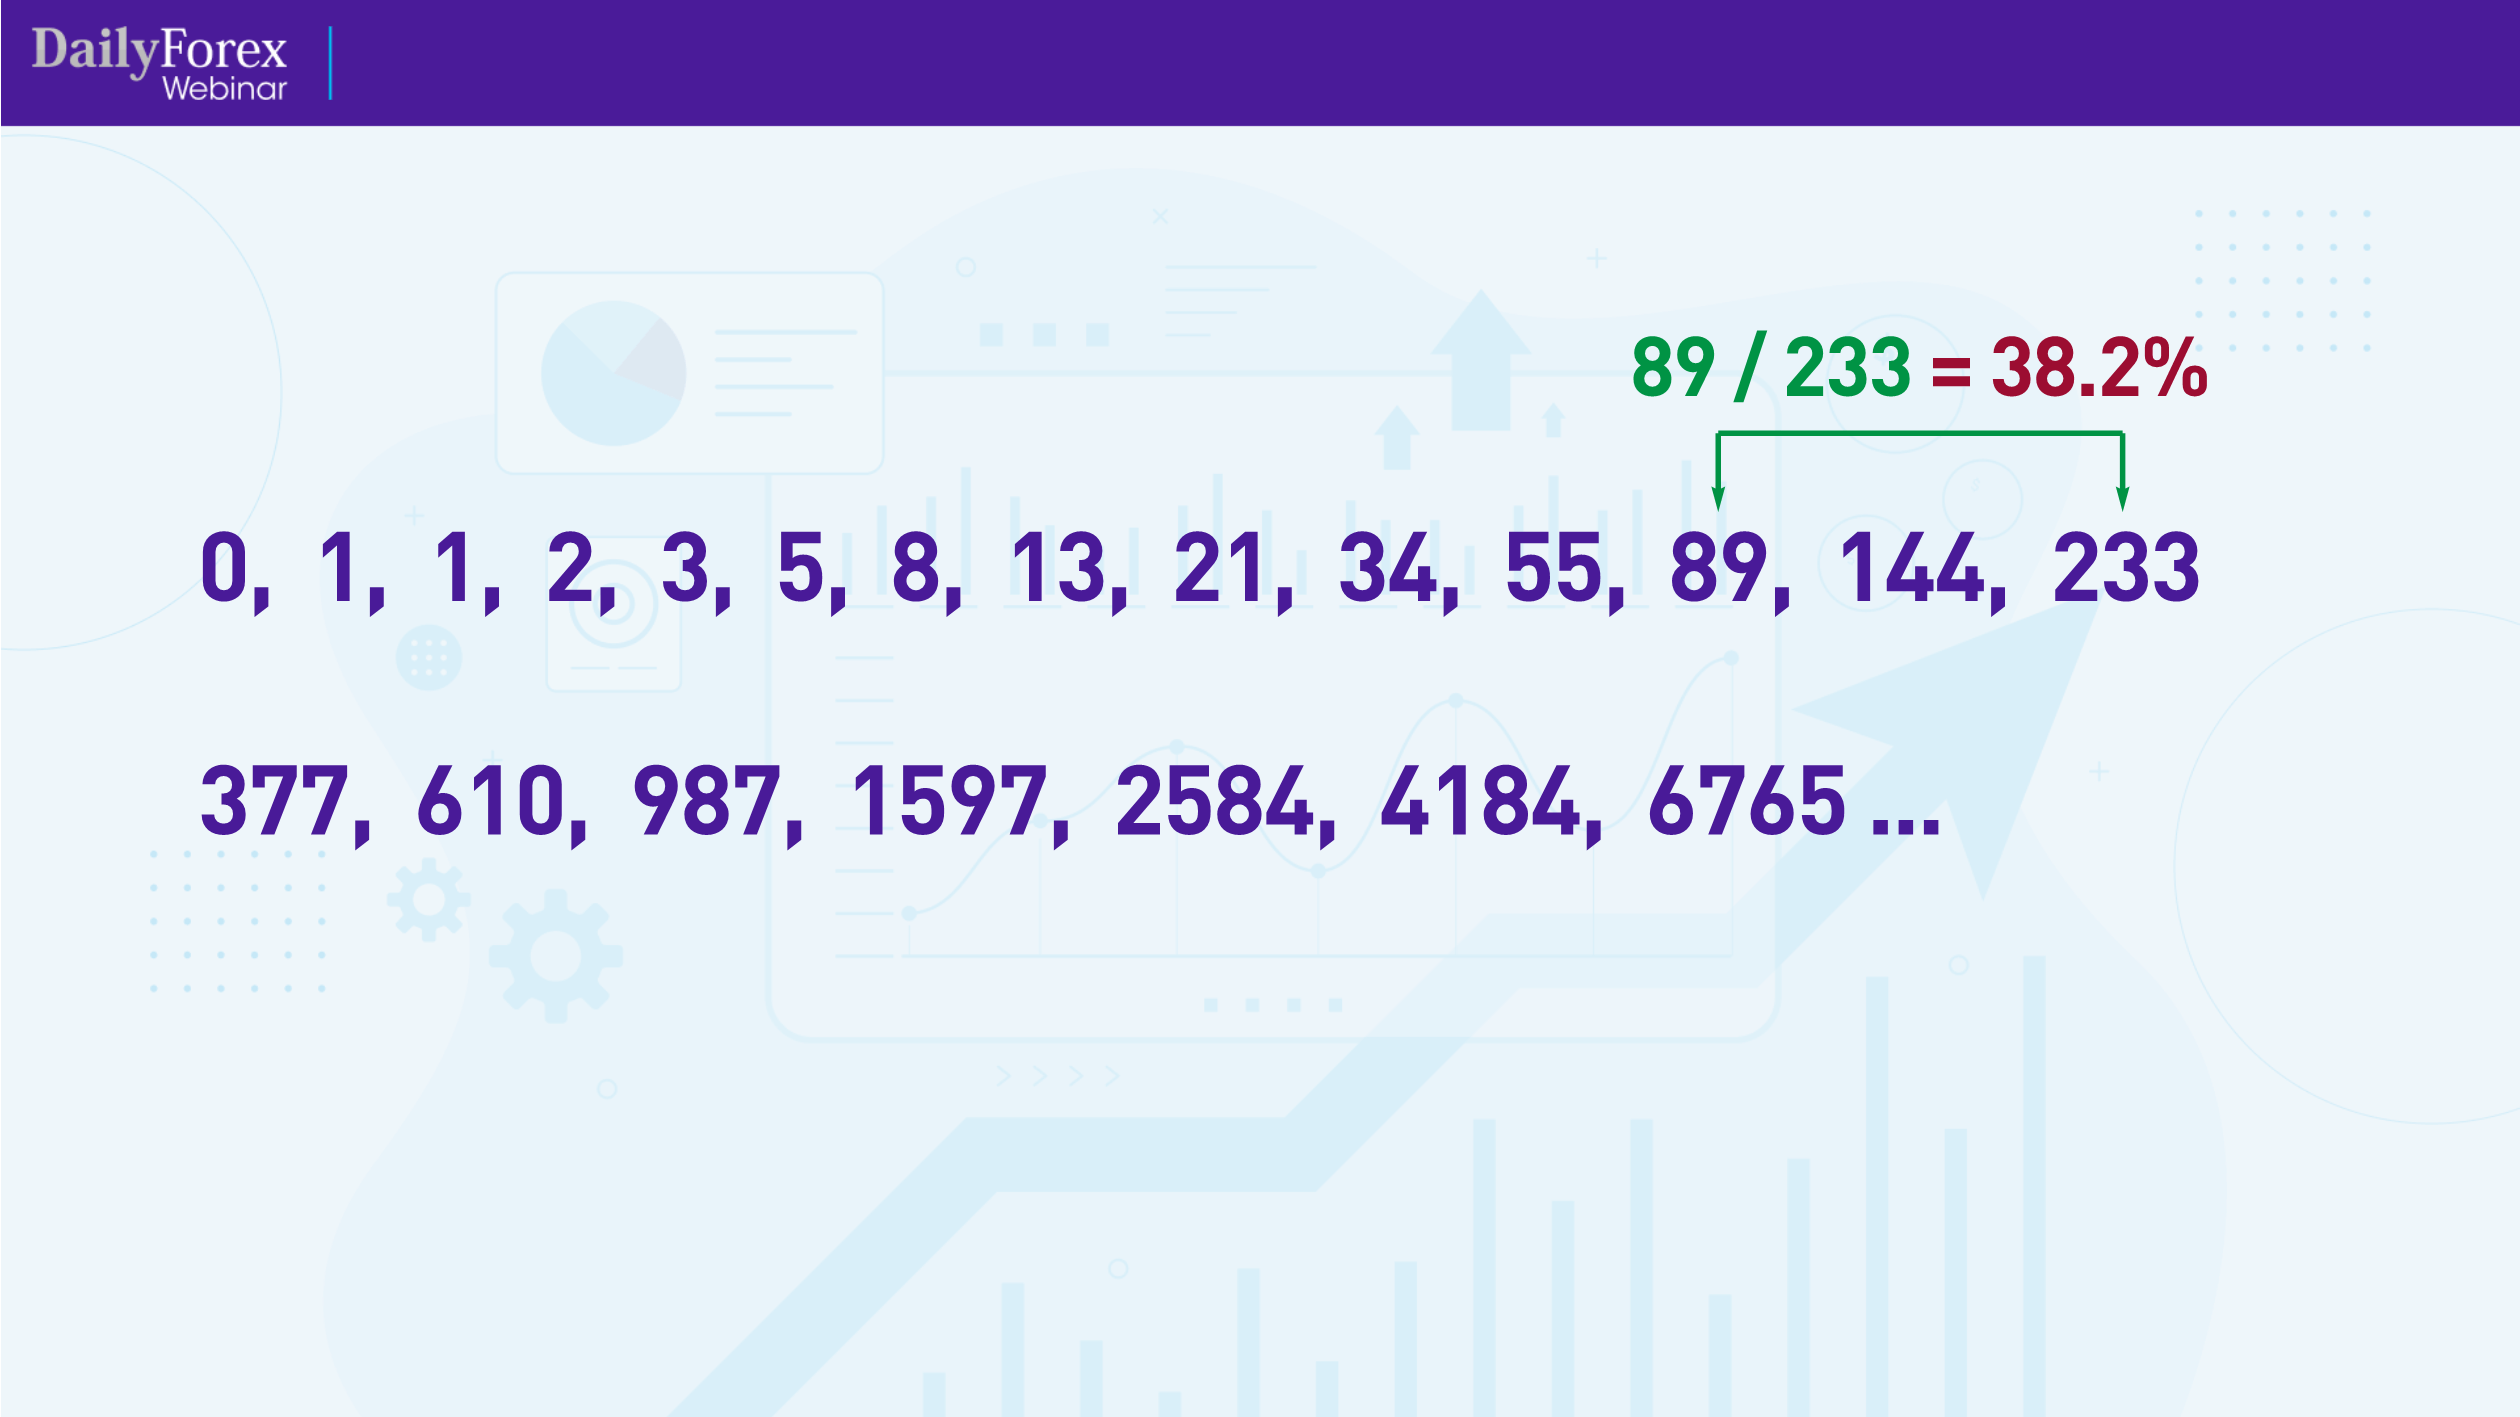
There is another key Fibonacci figure, which is 38.2%. You will arrive at this figure by taking any number in the sequence and dividing it by the second number that follows it:
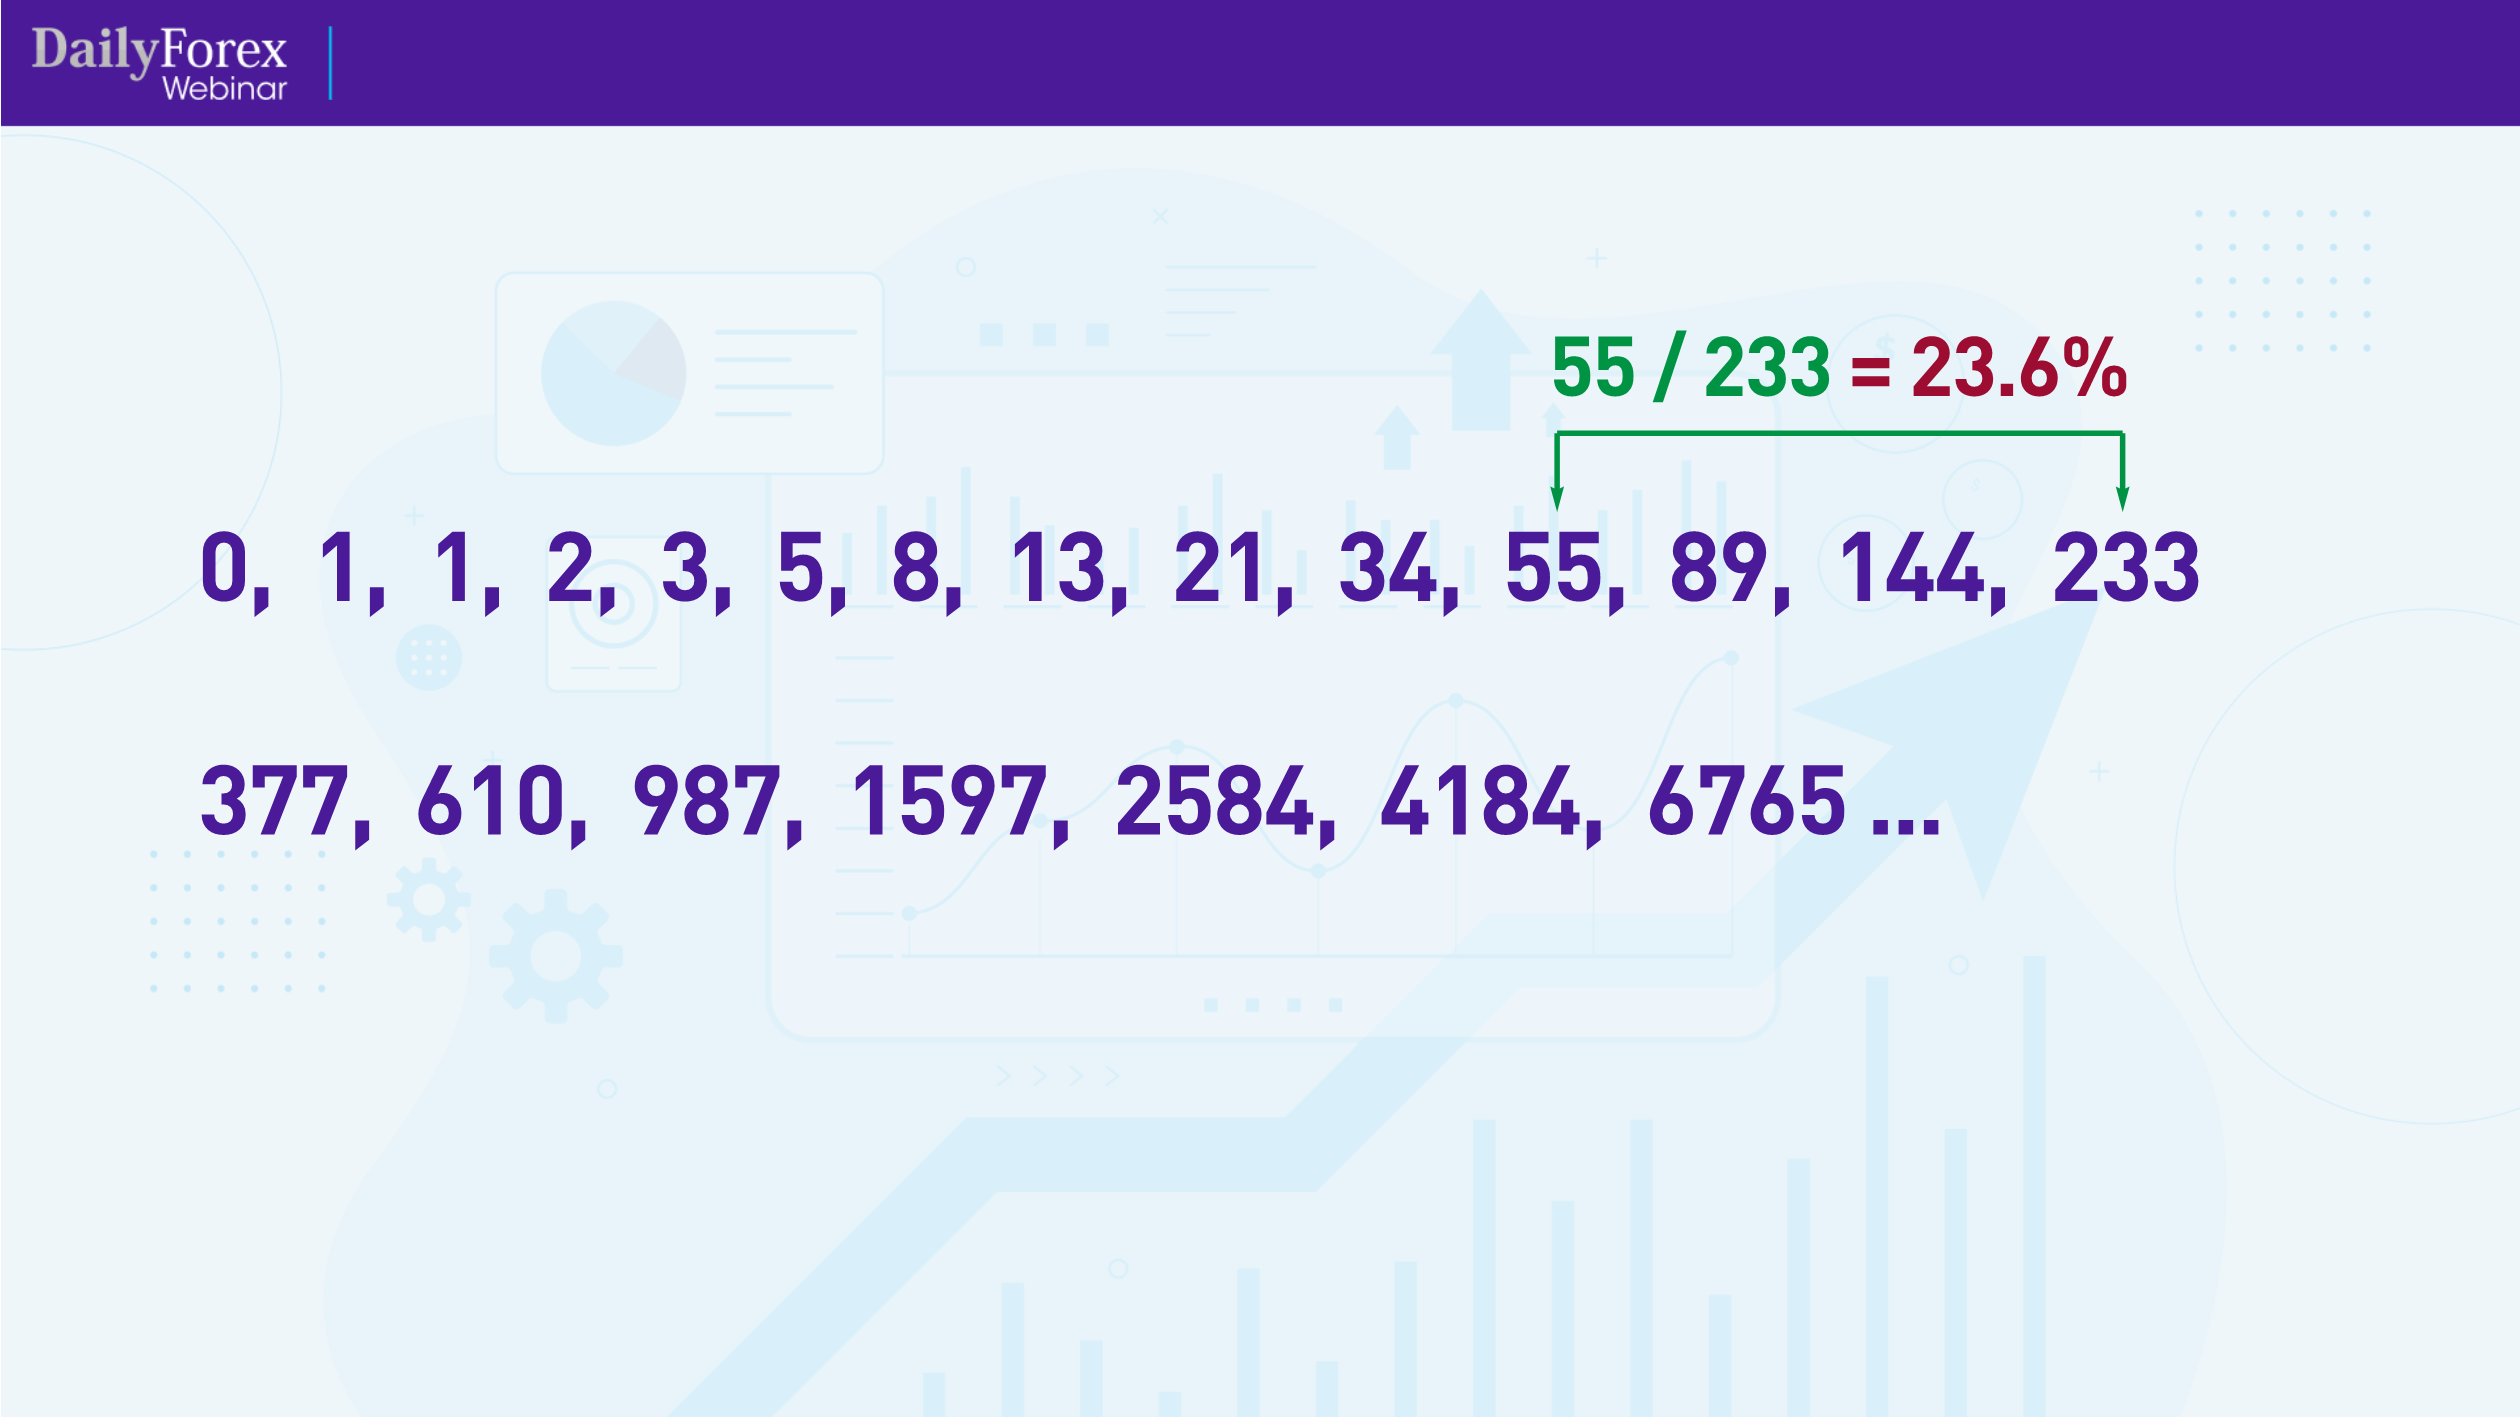
If you divide any number in the sequence by the third number that follows it, you will get the third key Fibonacci number, which is 23.6%:
Another important number is 50%. While not a Fibonacci number, this is a halfway mark that is psychologically important to human traders, who can easily recognize halves, or when a price has retraced to the halfway mark, for example.
Other important Fibonacci numbers commonly used include the square roots 78.6% and 88.6%:
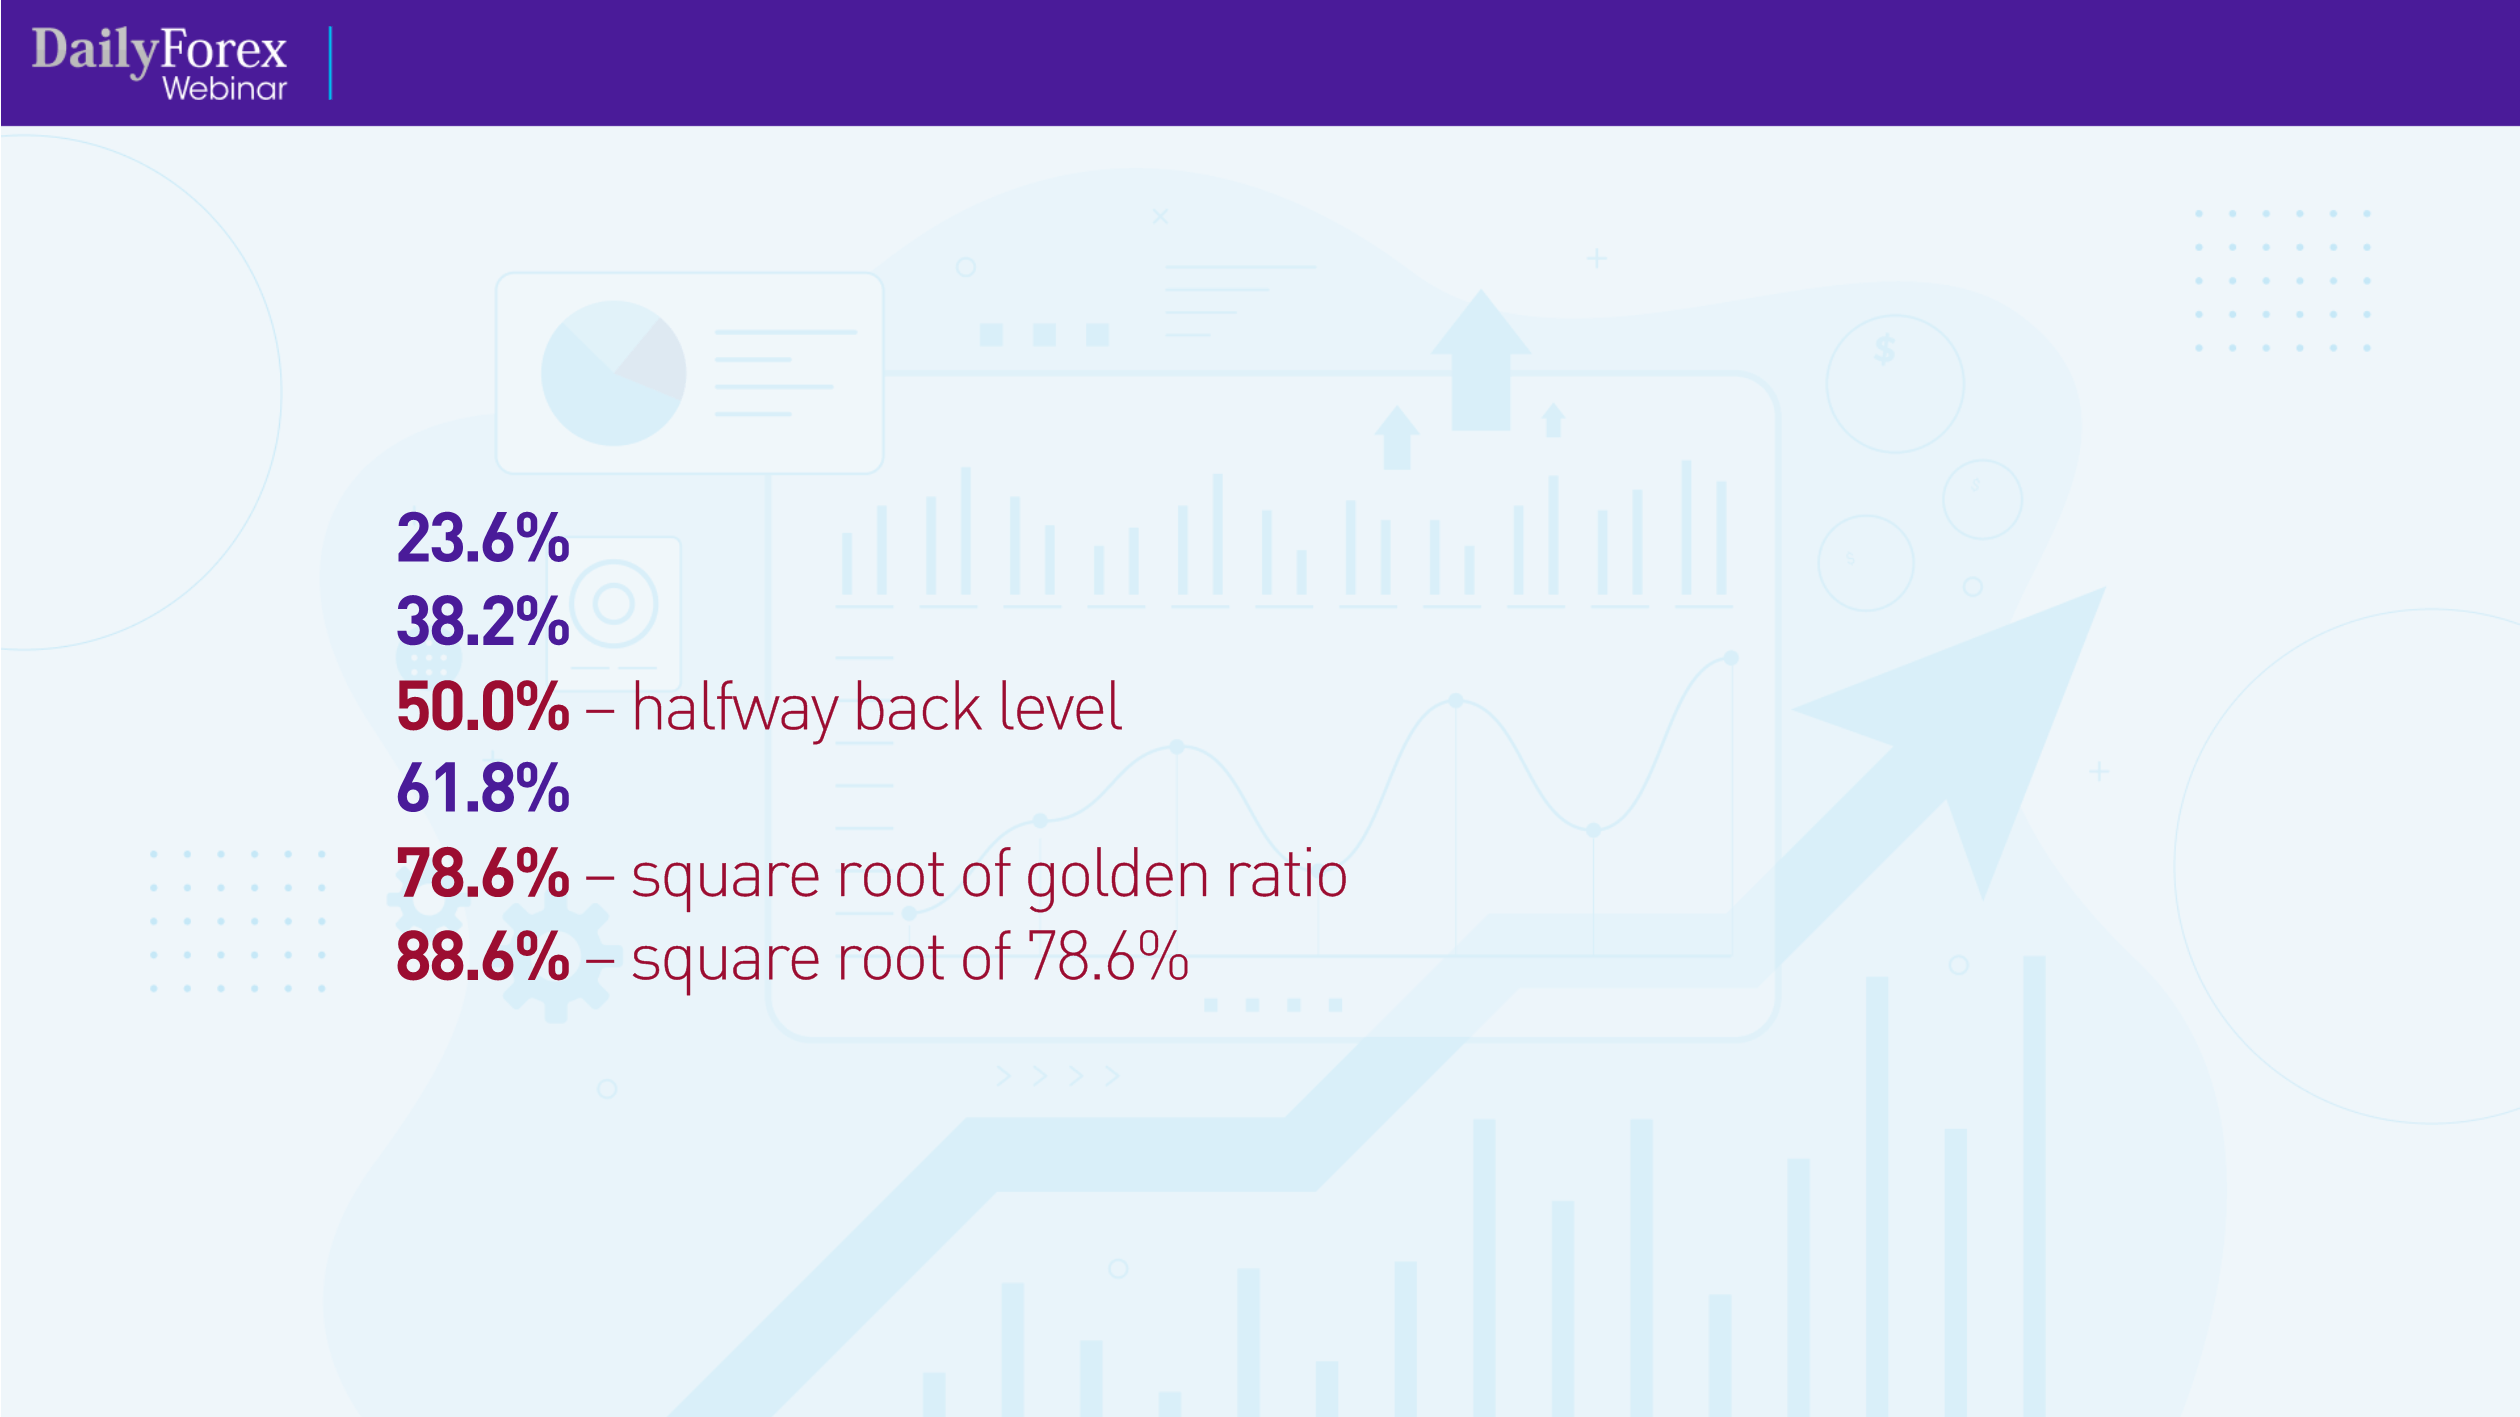
In my trading, I use the following Fibonacci numbers as follows:
When I see the price fall between the 50% - 61.8%, I consider this my entry zone.
When I see the price hit the -23.6%, I consider this Target 1.
When I see the price hit -61.8%, I consider this Target 2.
Let's illustrate this using a simplified diagram of an uptrend:
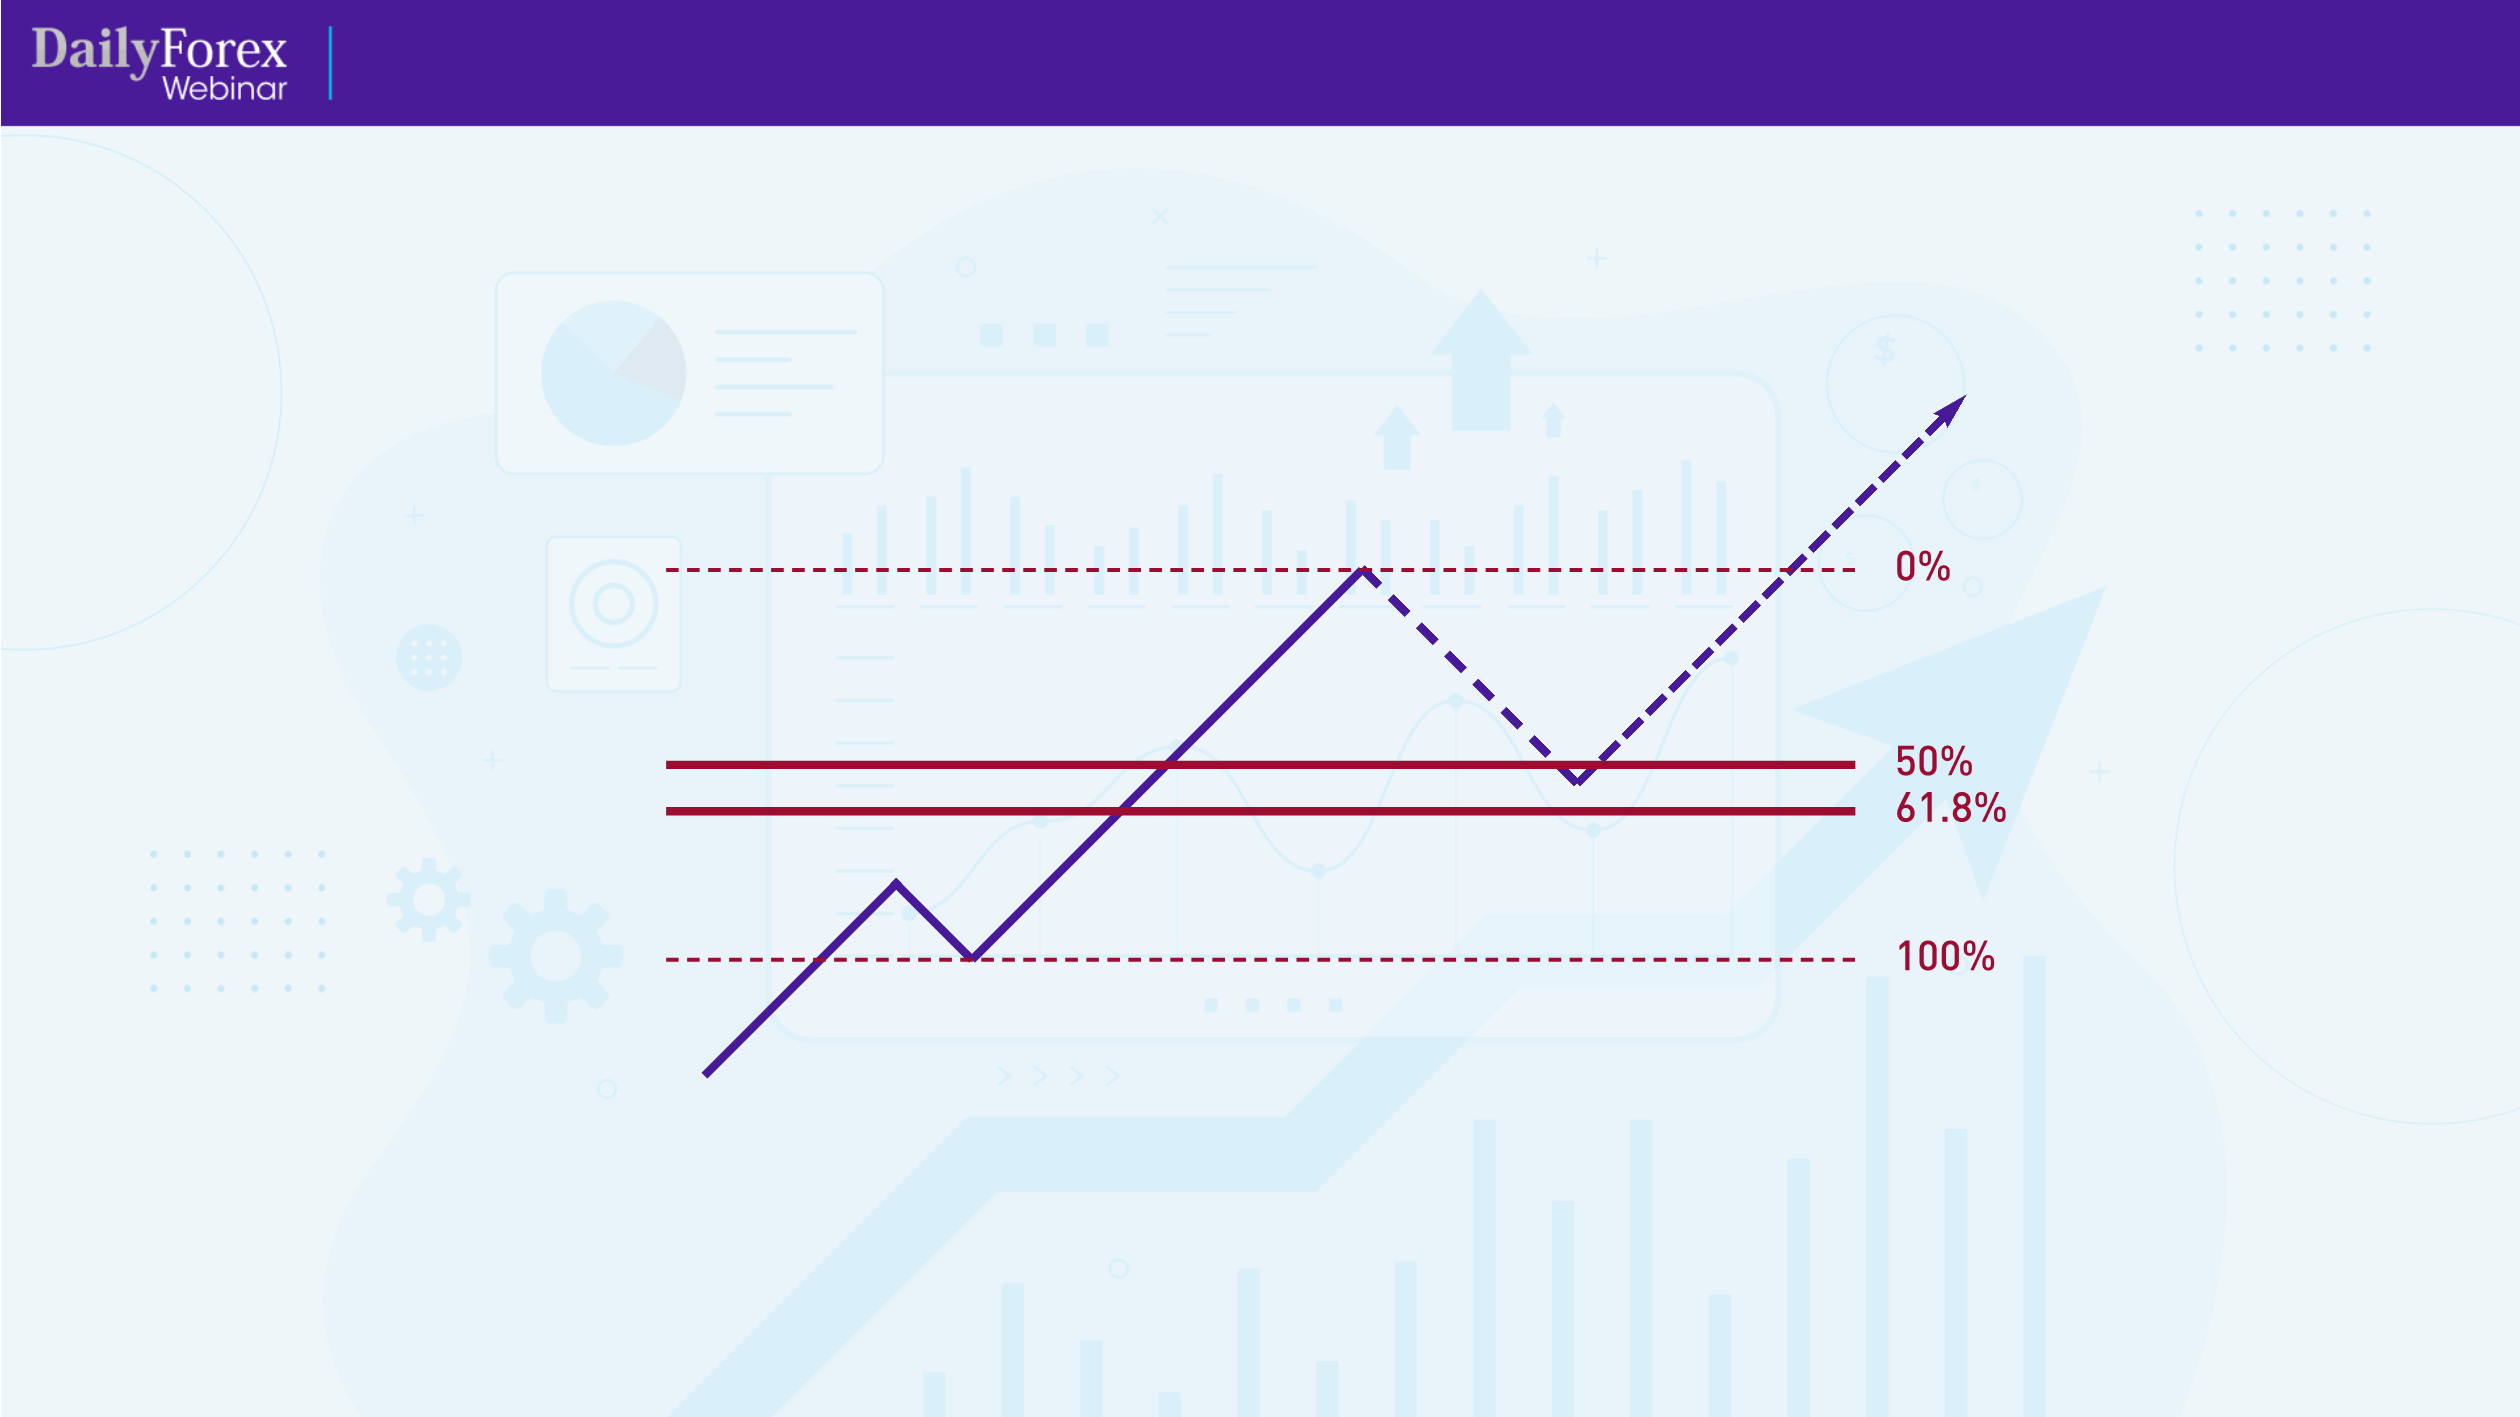 I've marked my Fibonacci levels, and when the price retraces to go between the 50% and the 61.8% levels, that's my entry zone and I look to enter the market before it goes back up again.
Of course, the same is true of a downtrend:
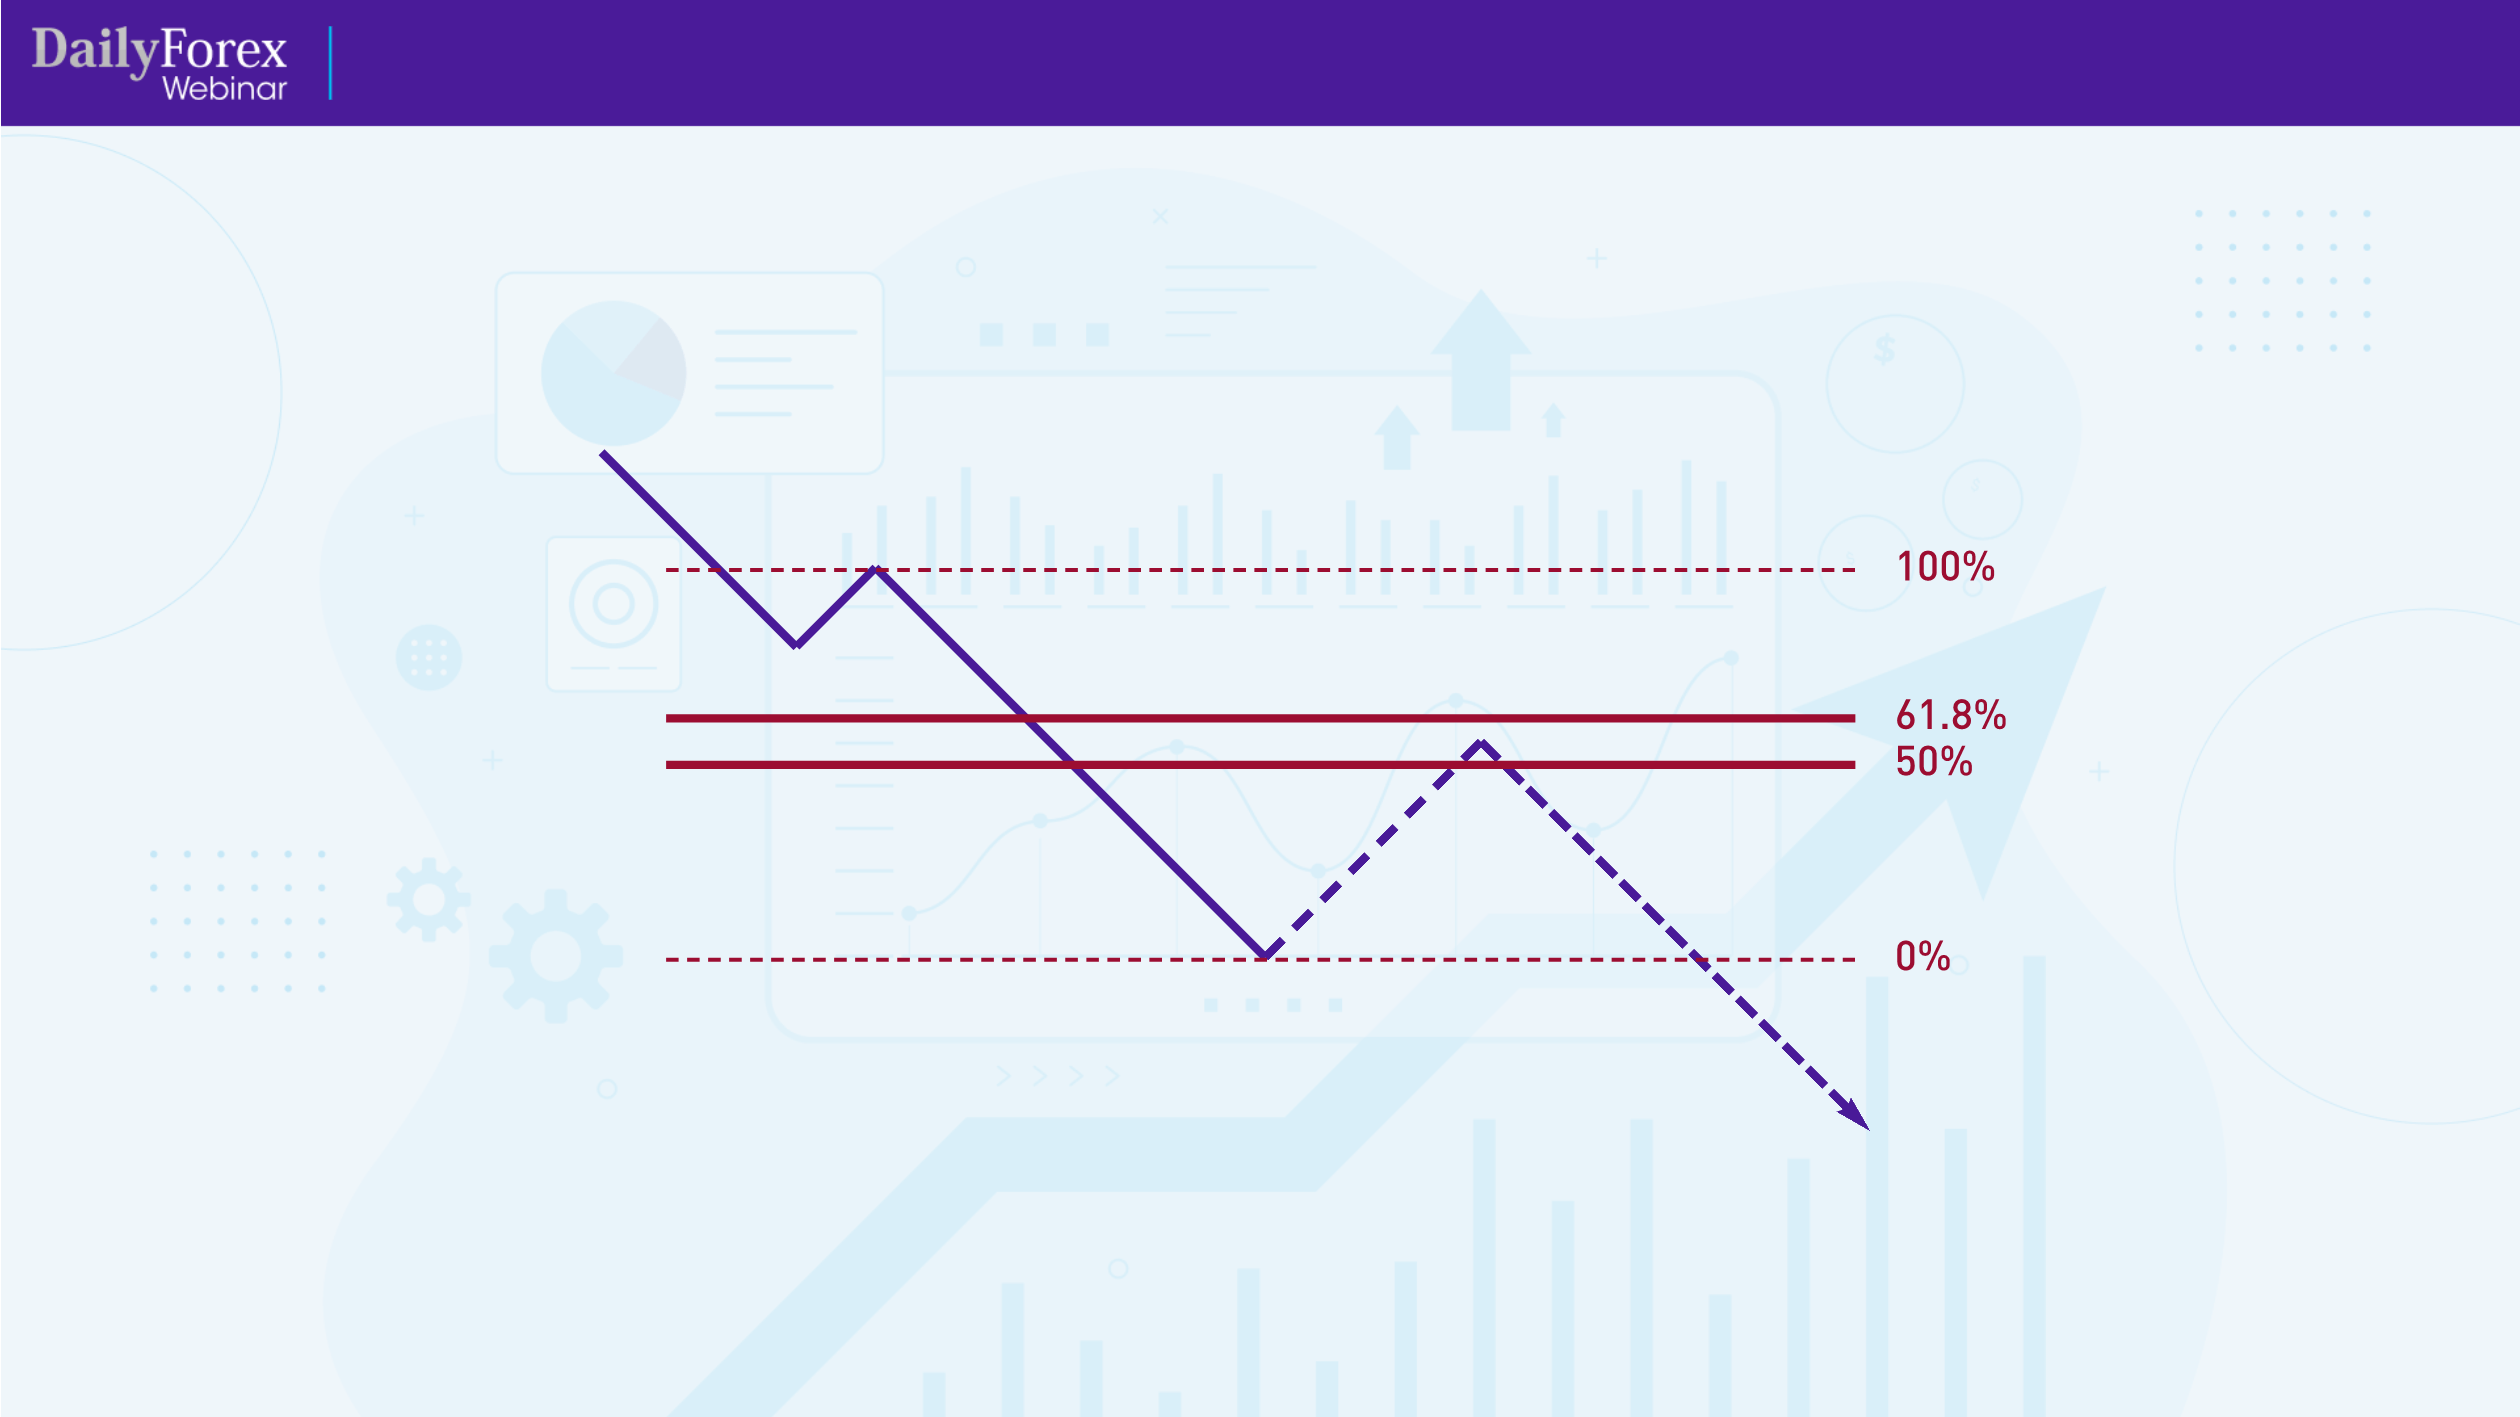 I'll wait for the price to retrace upwards to between the 50% and 61.8% levels, at which point I'm looking to enter.
One important thing to note is that when you use Fibonacci levels, context is important. You don't want to use Fibonacci levels on every chart; they should ideally be used to identify trends and where to enter them, or when the price has touched previous support or resistance levels. You should also always use Fibonacci levels across multiple timeframes, not just one, so that you get confluence for price direction. When doing so, keep in mind that higher timeframes almost always dominate lower timeframes, so go with the higher timeframe trend if the lower timeframe contradicts it.
Let's look at some actual trades to illustrate what I've discussed so far, beginning with the weekly chart for the EUR/USD pair:
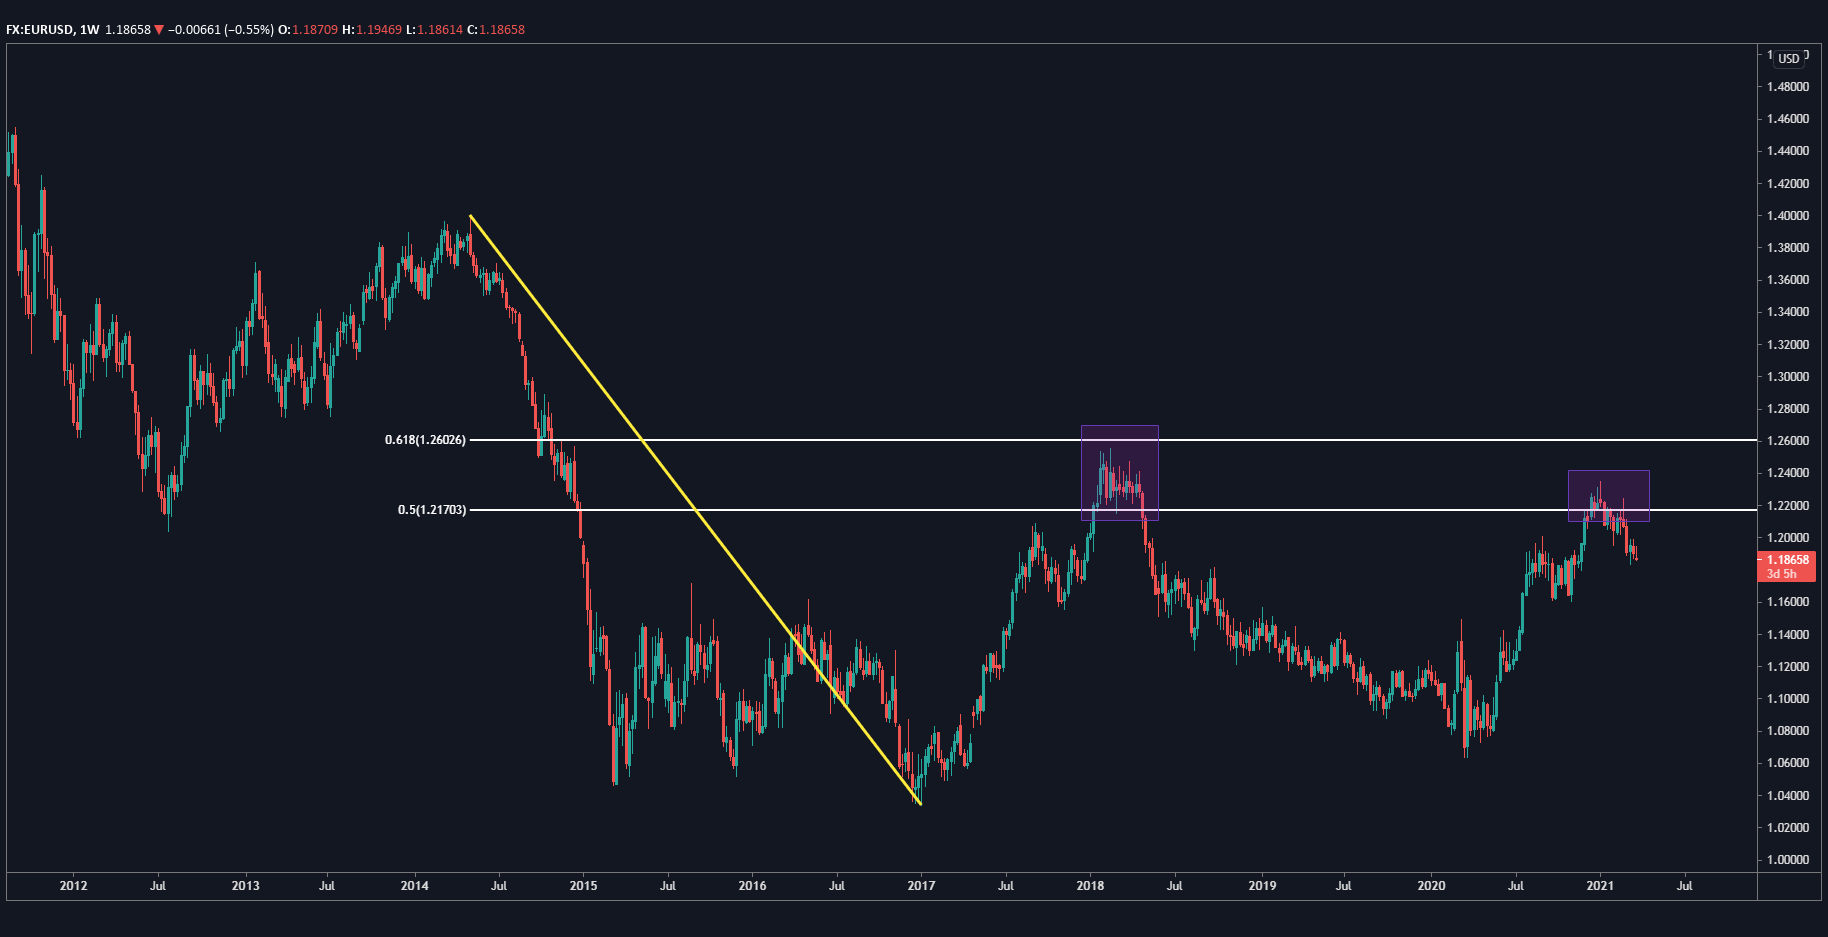
The price started to fall in 2014 to a low in 2017, the retraced upwards to the entry zone, between the 50% and 61.8% Fibonacci levels that I've marked there (I don't generally mark the 0 or 100 levels on charts). The price then stalled, started to fall back down and trended upwards to the entry zone in what I call a “re-entry”. This was likely due to sellers, who stepped in quickly after seeing the price hit the same entry zone that it did previously.
Now let's zoom in to the four-hour chart for the EUR/USD, where I've marked that same 50% Fibonacci level that you saw on the chart above:
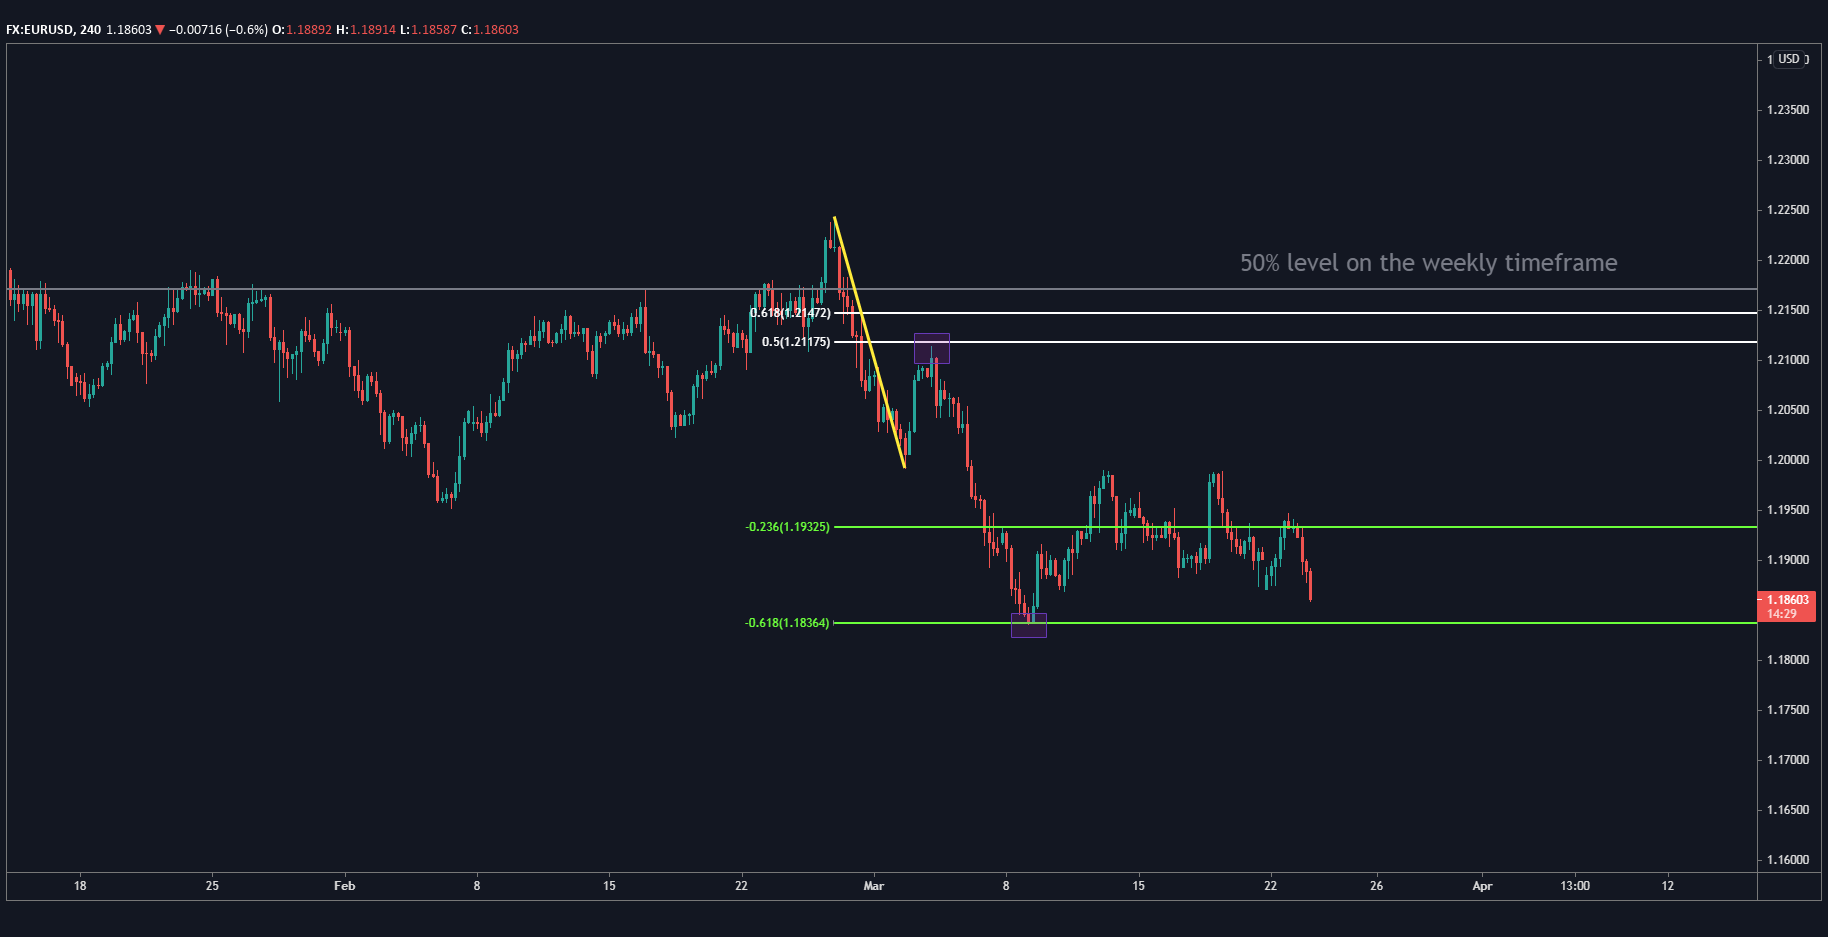
You can see how the price trended down, then retraced up to very nearly touch the 50% level, then resumed the downtrend and bounced off Target 2, at 61.8%. In general, you'll find that when the price hits the 50% level, it will then respect one of the two targets.
Now, if I bring the Fibonacci levels downward, you can see that the price very clearly sat between the newly marked 50% and 61.8% levels, and I'm now waiting for the price to come down and hit one of the targets, which I think it will do quite easily:
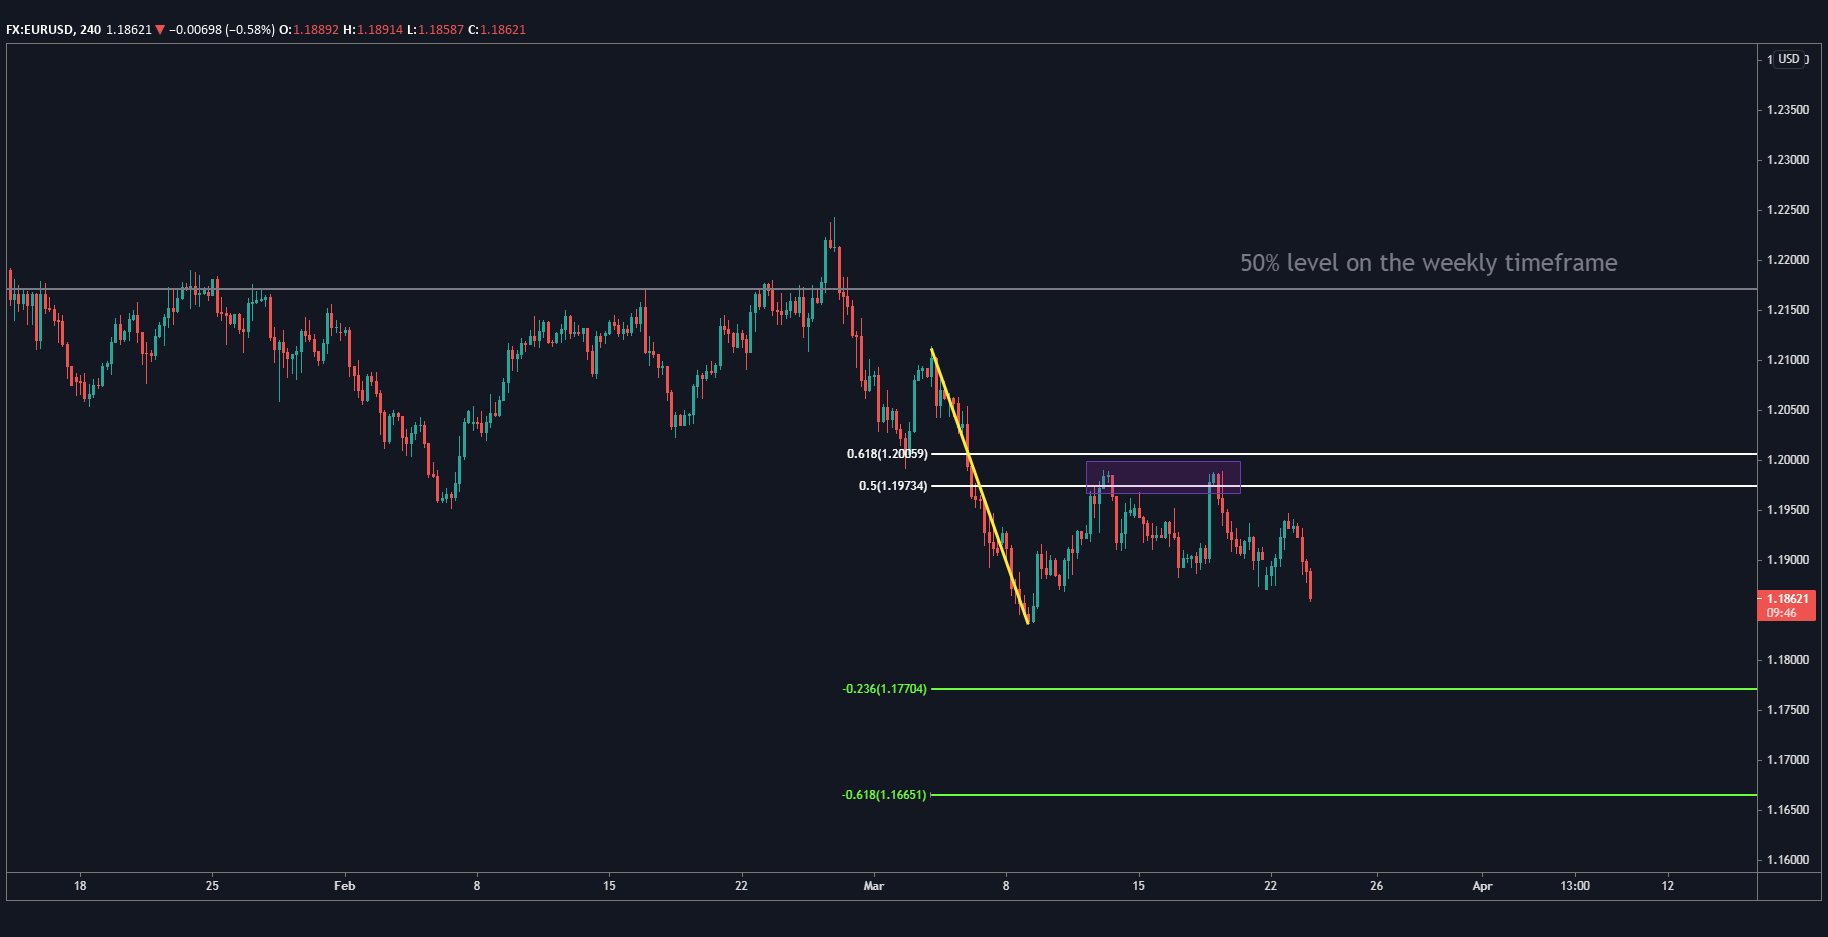
So, based on my Fibonacci analysis, I'm expecting the price to go down and am therefore bearish the EUR/USD.
We can see something similar with the GBP/USD, using the four-hour chart:
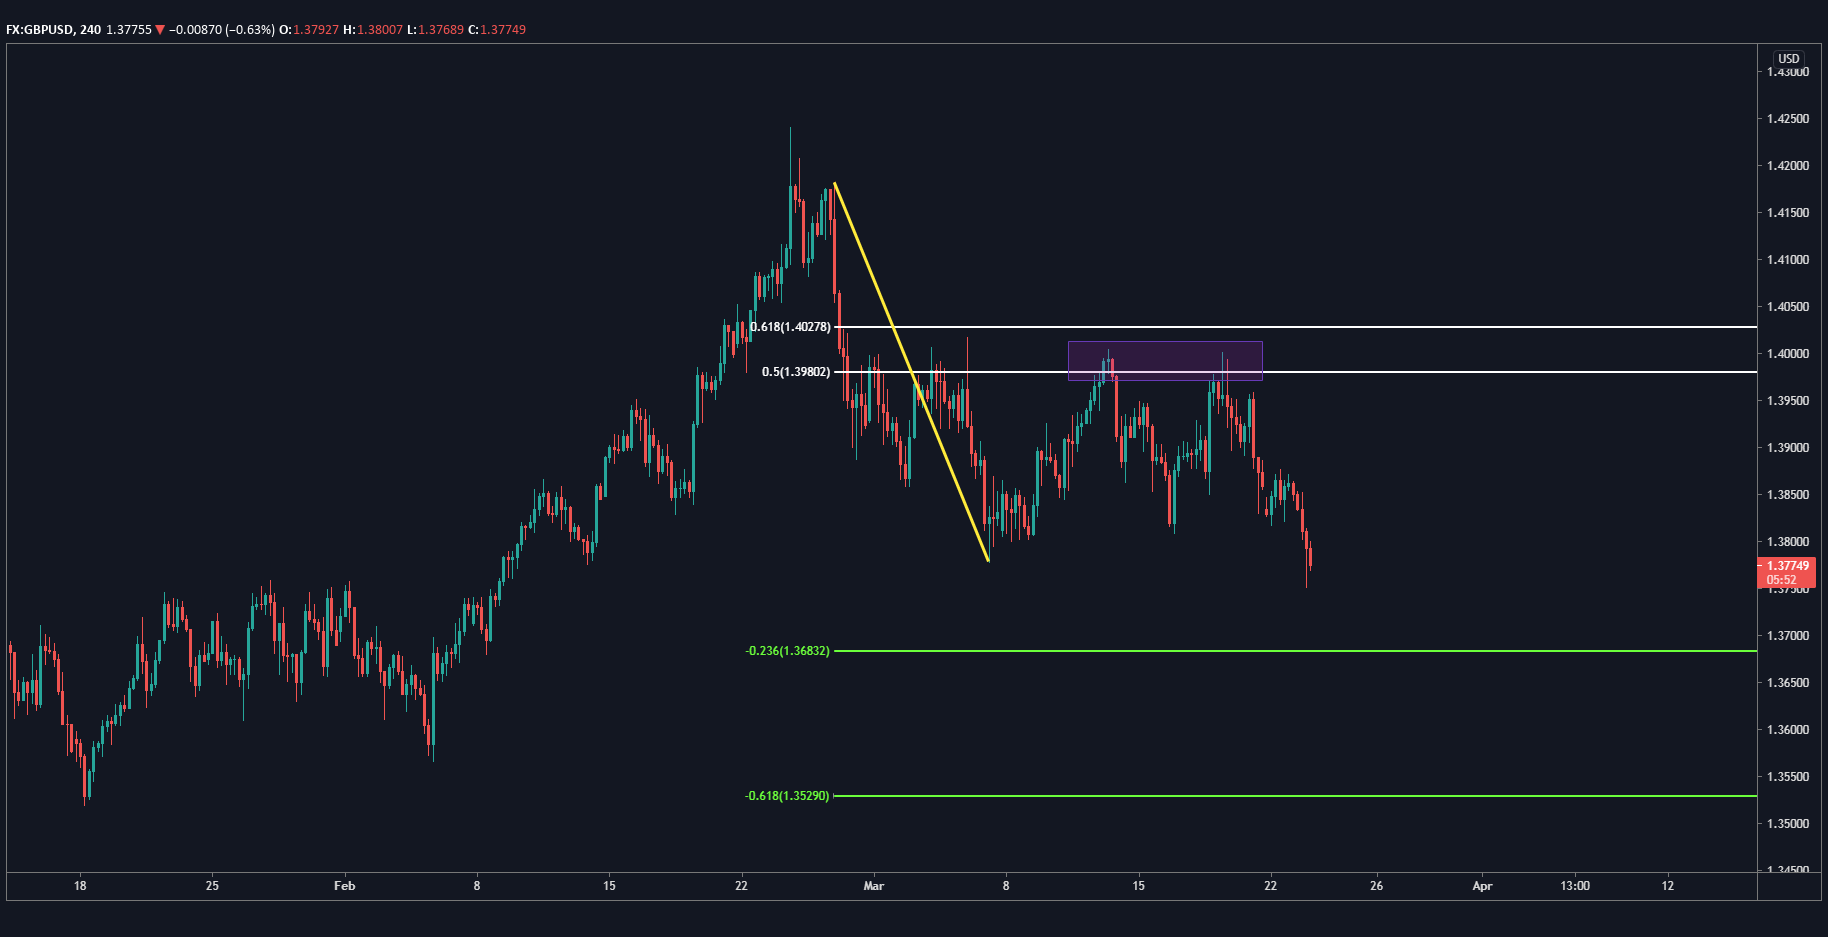
The price had been trending up for some months, and I've marked the yellow Fibonacci handle at the point where the price started to collapse. The price then formed a resistance level with two clean entries right between the 50% and 61.8% Fibonacci levels, and I'm watching to see if the price will interact with either of the two targets below.
Let's look at the four-hour chart for the USD/JPY as another example:
The pair made a leg up (marked by the white line), then move sideways for a bit before hitting the 50% level. It then made it to Target 1, stalled, then moved up to Target 2 and retraced before moving back up.
One of my favorite trades to use with Fibonacci analyses is the USD/CAD because of its countertrend:
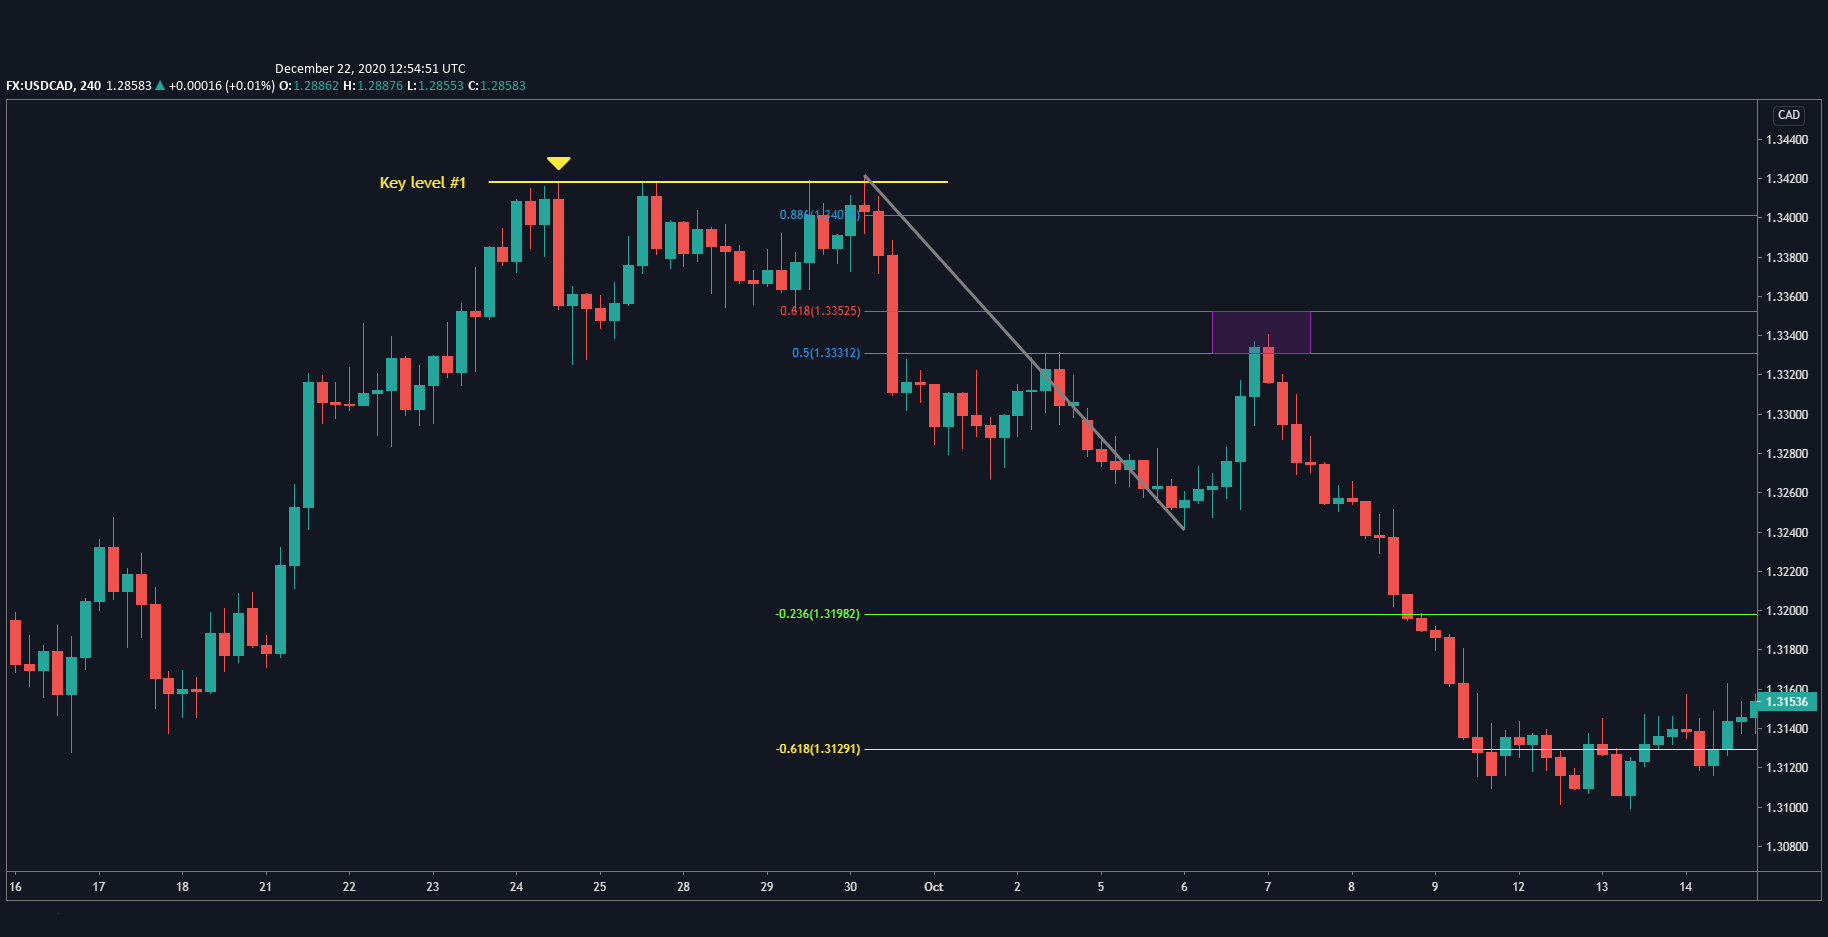
I actually expected the price to stall and move back up after forming the yellow resistance level. Instead, the large red candle made it clear that the bears were taking over, and the price indeed fell, retraced upwards to the 50% level, then dropped back down straight into Target 2 and moved sideways.
If you want to learn more about Fibonacci Analyses, I highly suggest visiting FXAcademy.com. Once there, click on Learn to Trade and then Fibonacci Retracement Levels in the drop-down menu. You'll find some videos and articles that will give you a great deep dive into Fibonacci analyses.
Another great resource is provided by FTXM, one of the industry's top brokers, who have strategy managers that can tell you more about how they use Fibonacci analyses in their trades. Simply go to FXTM.com, click on FXTMInvest in the top menu, then Become an Investor, and then Top Performing Strategy managers.
Some final thoughts:
You won't find clear levels in all charts. In fact, I don't find clear levels in most charts. So if it's not clear to you for whatever reason, stay away until you can find another timeframe or even another trade altogether.
Lastly, always mind your risk by setting stop losses. I like to keep my stop losses below the 61.8% Fibonacci level. But wherever you decide to set them, make sure they're there and practice risk management.
