Forex traders like to conduct their market analyses in different ways. Some traders, for instance, like to use market-related news as their barometer for price movements. They base their trade entries and exits on interest rate decisions, CPIs and PPIs, and other events that occur on economic calendars.
A great source for market-related news to give you some context behind price moves is Markets.com. Simply click here or visit Markets.com and click on News to see the economic calendars.
Other traders, however – such as myself – are more technical. Yes, we also look at economic calendars to gauge the direction of the markets. But ultimately, we prefer to execute our trades based on technical charts using multiple timeframes.
I generally divide my charts into two timeframe categories: higher timeframes and lower timeframes. Higher timeframes can be anything from weekly charts to daily charts, and they’re what I use to conduct my technical analyses and gauge price direction. Lower timeframes can be anything from the four-hour chart down to the 5-minute chart, and they’re what I use to actually find my trade entries and execute my trades.
To add some extra context to this week’s market analysis, I’ll be referring back to my analysis webinar from April 20, 2021 to see how my forecasts and trades panned out.
Let’s take a look at some major pairs by analyzing their price charts, beginning with the daily chart for the EUR/USD:
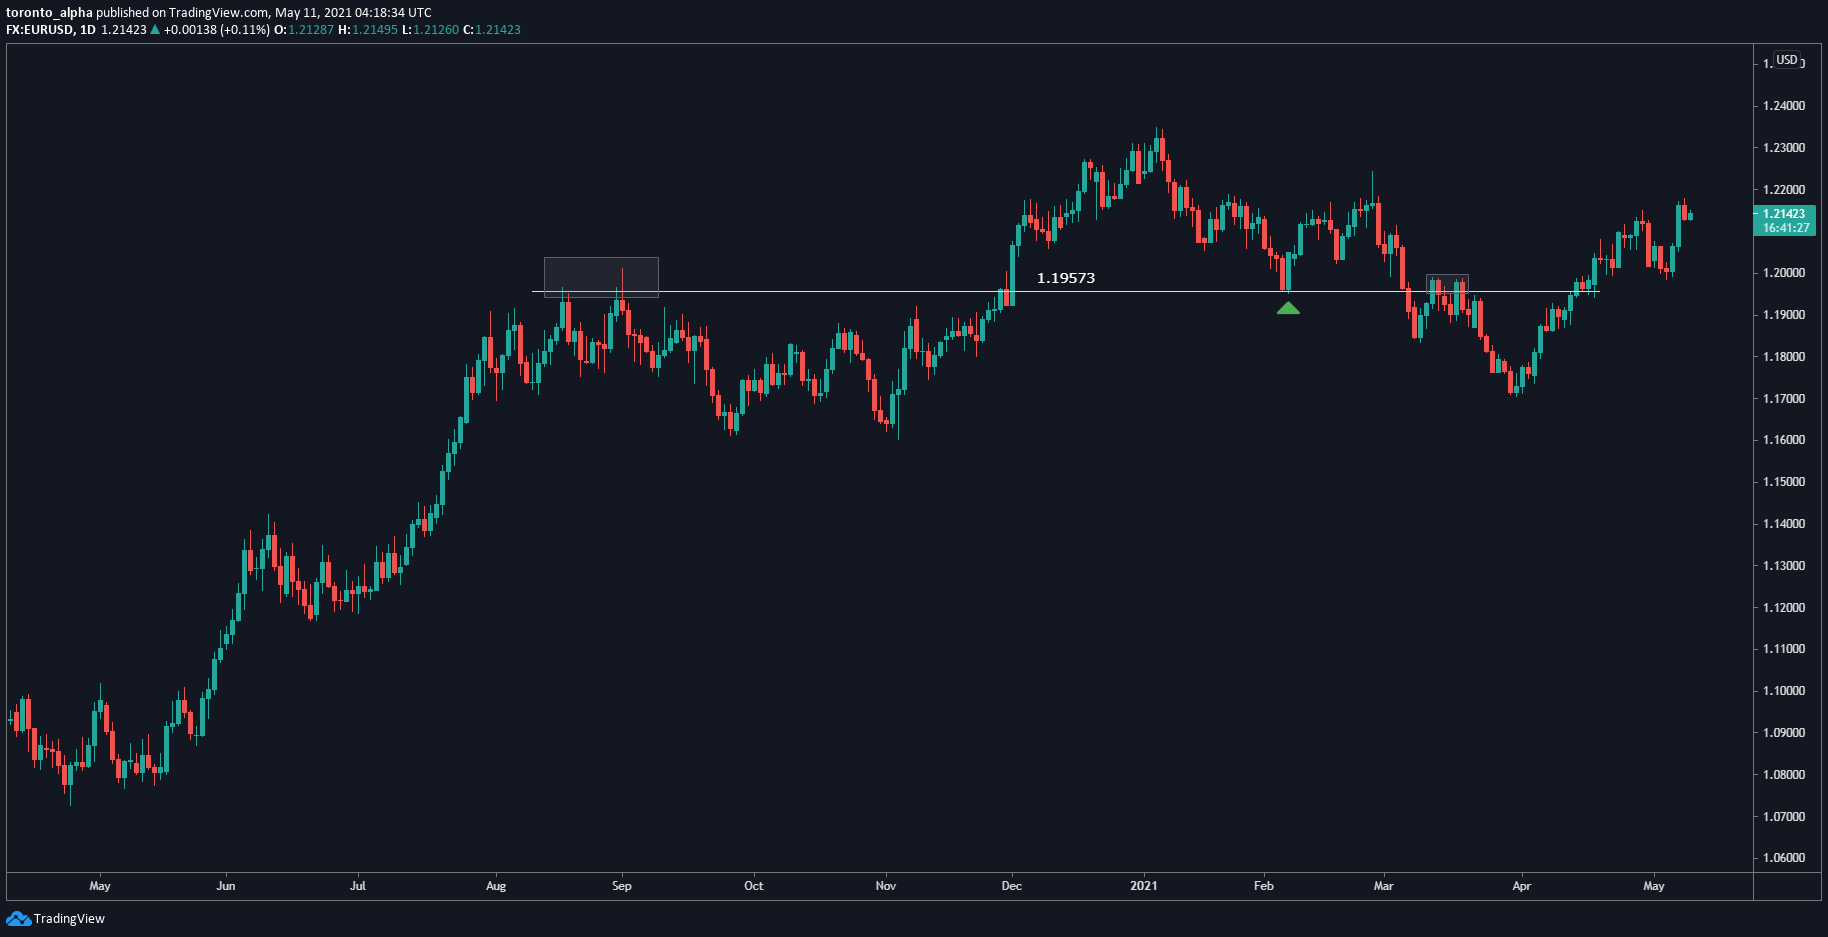
The EURUSD was trending up and has been in a sideways pattern since August 2020. I identified a key level in that sideways pattern as 1.1957, where the price started to make a bit of a reversal pattern where the green arrow is. That level is where a big rejection happened, and it has been tested as a resistance and support level multiple times since August 2020. I refer to it as POC – Point of Control – because I’m looking at the EUR/USD to see if it hits above or below that level, which will tell me to be bullish or bearish. Now, the price is trending above that level.
Let’s zoom in to the four-hour chart:
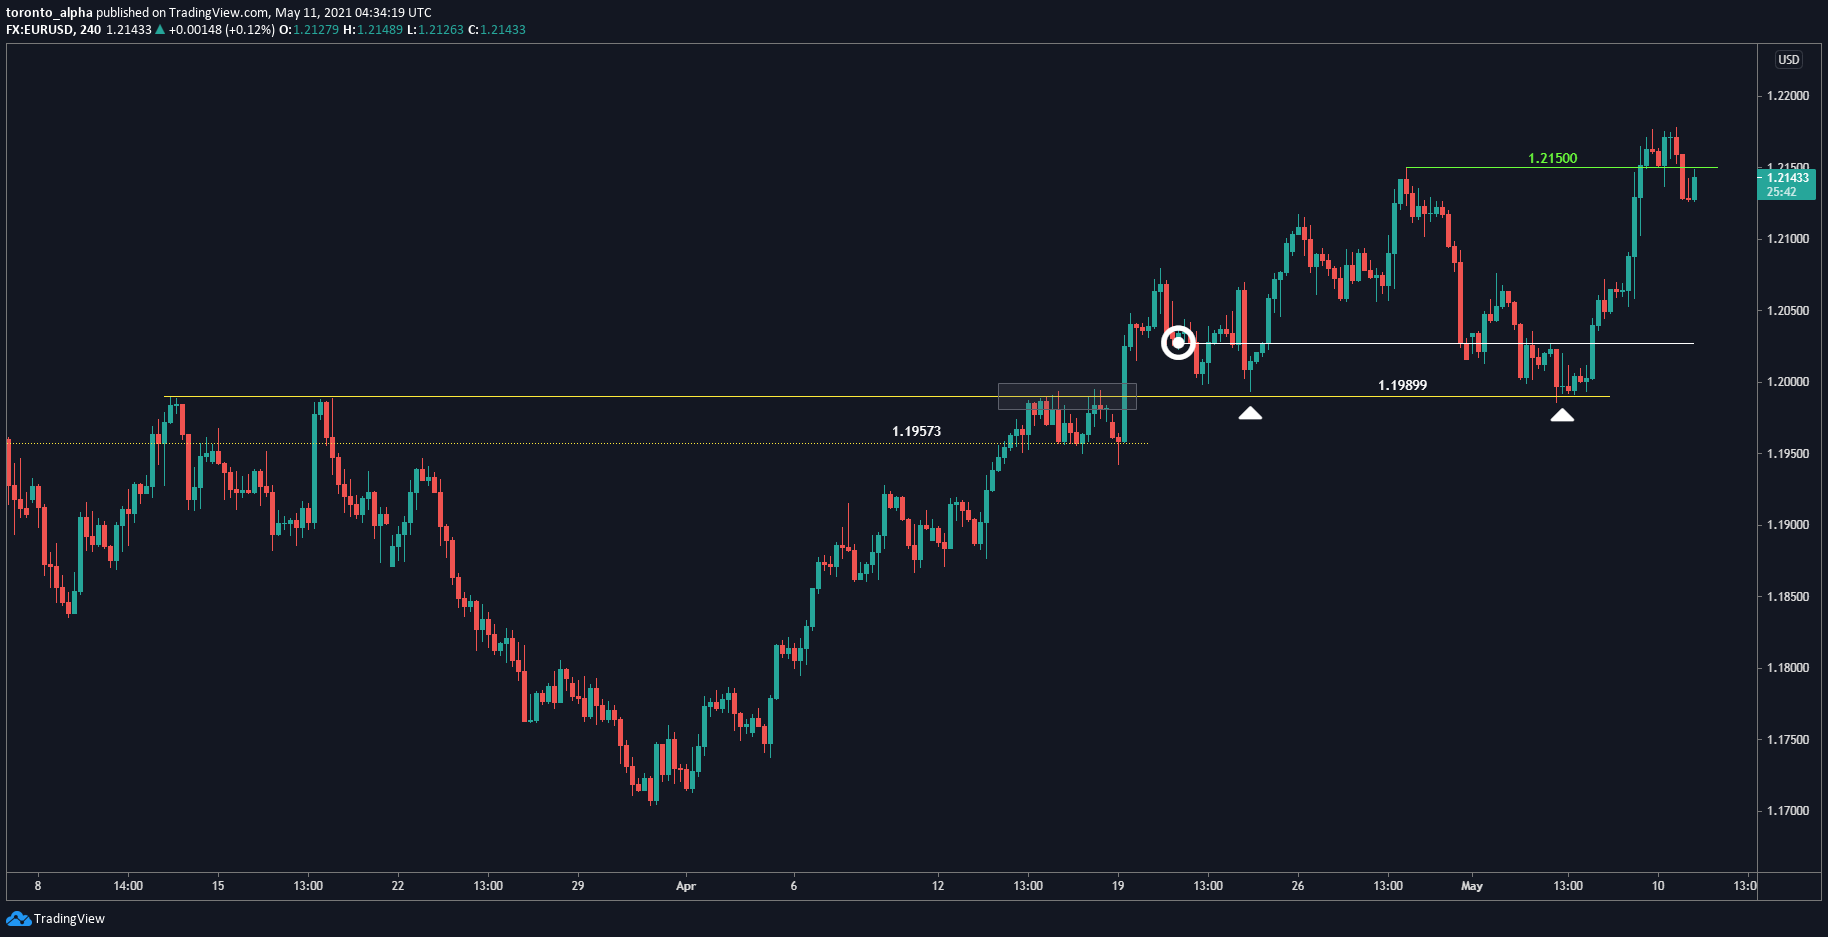
A new level we have marked is 1.19899, on the left of the chart. The price formed a double-top pattern, i.e., a double resistance area, then broke through that level decisively and came back down to test it as support, in a classic role reversal. I therefore remain bullish the EUR/USD. If the price settles above the 1.21500 resistance, that’s where I might enter a new bullish trade.
Let’s now look at the GBP/USD pair, using the four-hour chart:
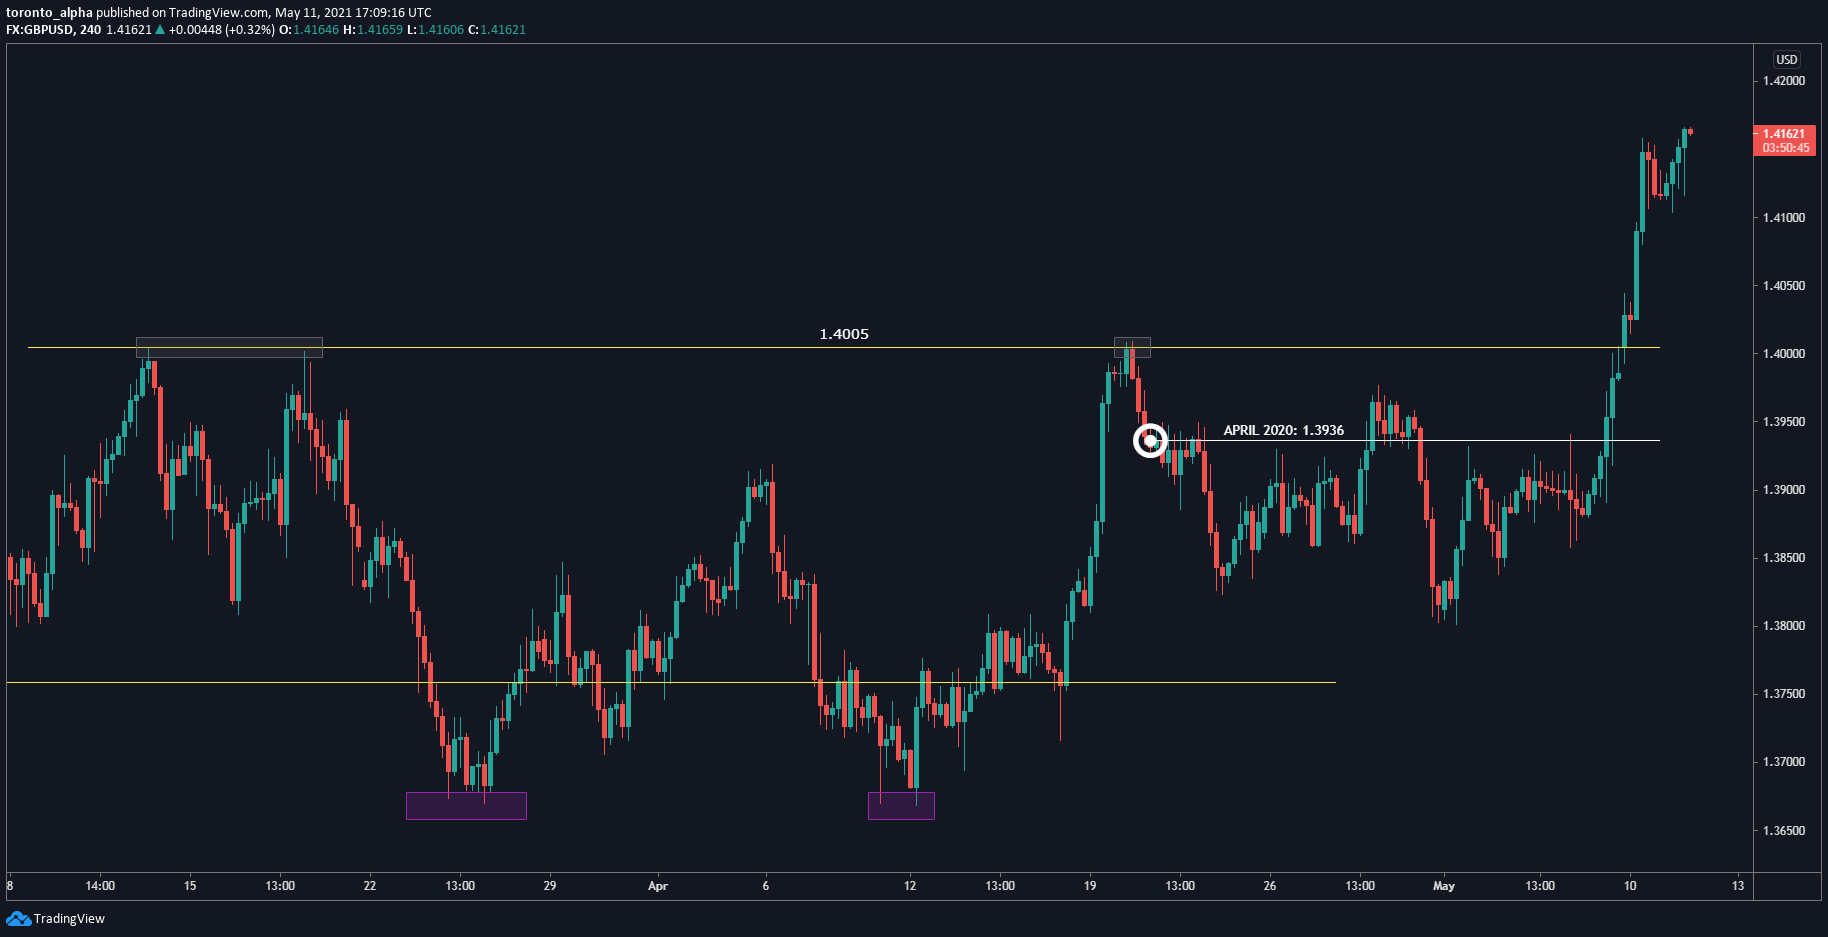
GBPUSD has been in a long-term uptrend since 2019, but in recent months has been moving sideways, after which it squeezed into a triangle and broke through, confirming my bullish bias for this pair. In our April 20th market analysis, I identified 1.4005 as a key resistance level where the price had stalled. I wanted to see the price settle above that level in order to continue the uptrend.
We can get a closer look with the 15-minute chart:
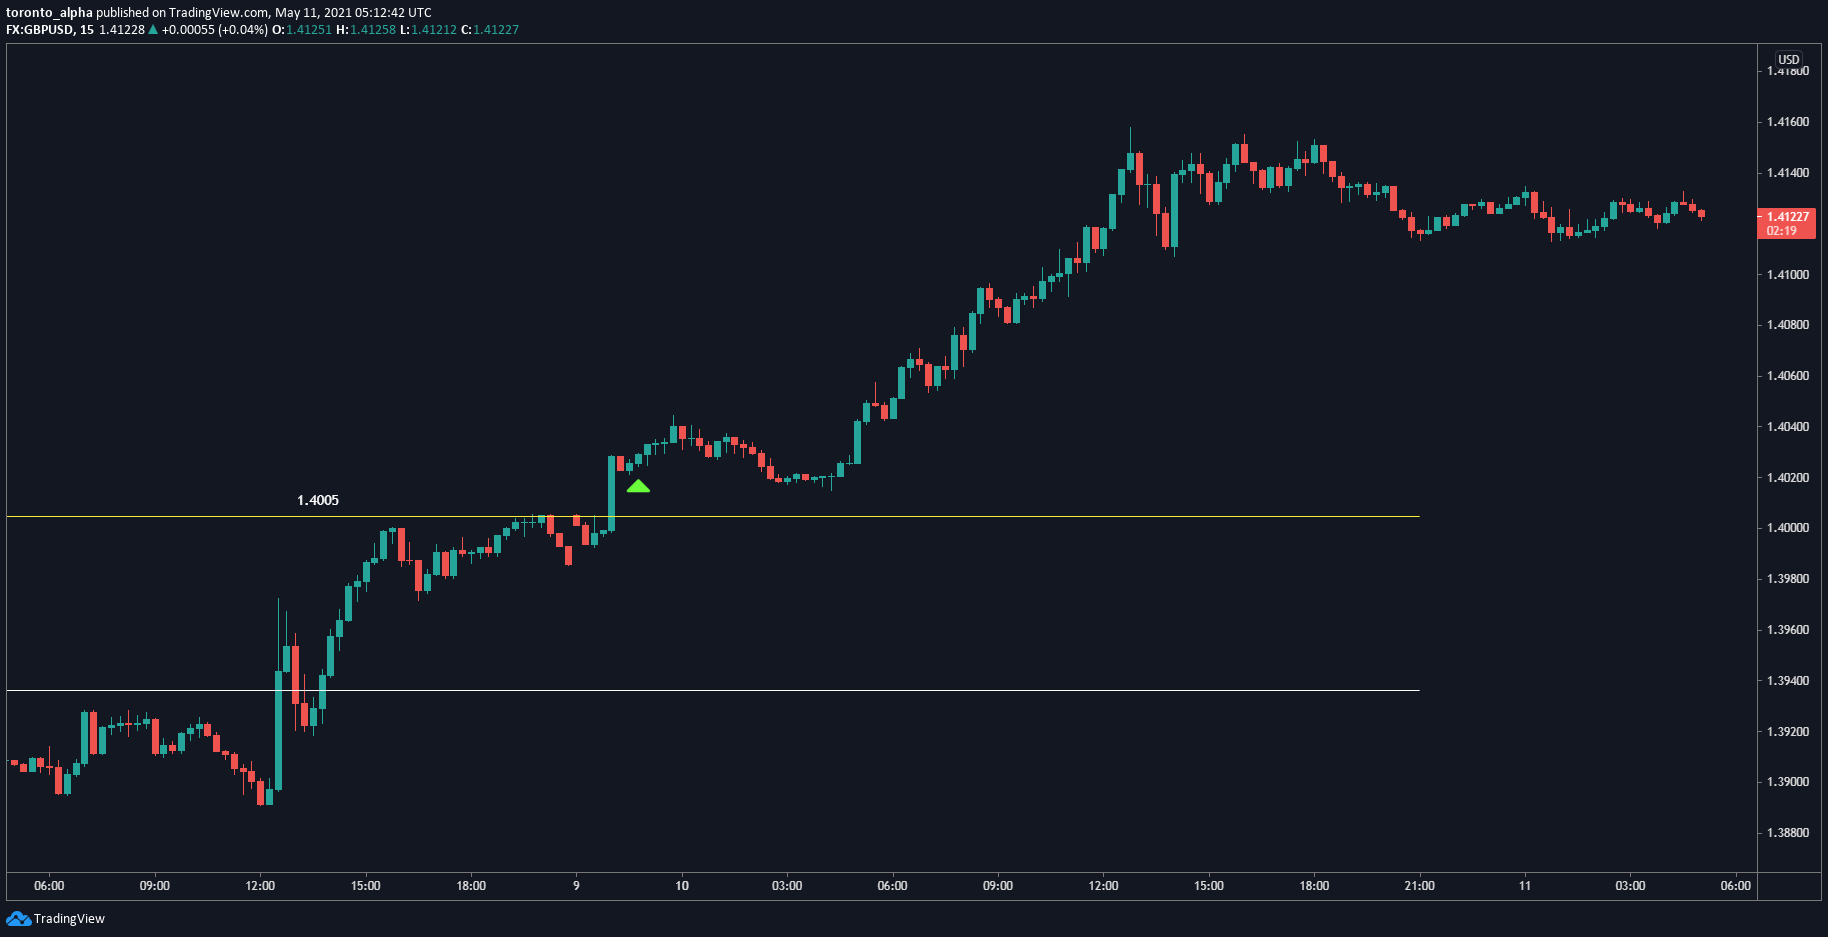
The price indeed broke through the 1.4005 level on May 9th quite decisively, so I went long. The price shot up over +150 pips before retracing a little.
We are still bullish GBPUSD; however, we would want the price to retrace back closer to the 1.4005 level to provide a safer entry or settle above the current minor resistance of 1.4165. (The 1.4165 level is also in line with a long-term 2018 resistance area, so caution must be taken if entering at that level.)
Here is the daily chart for the USD/CHF:
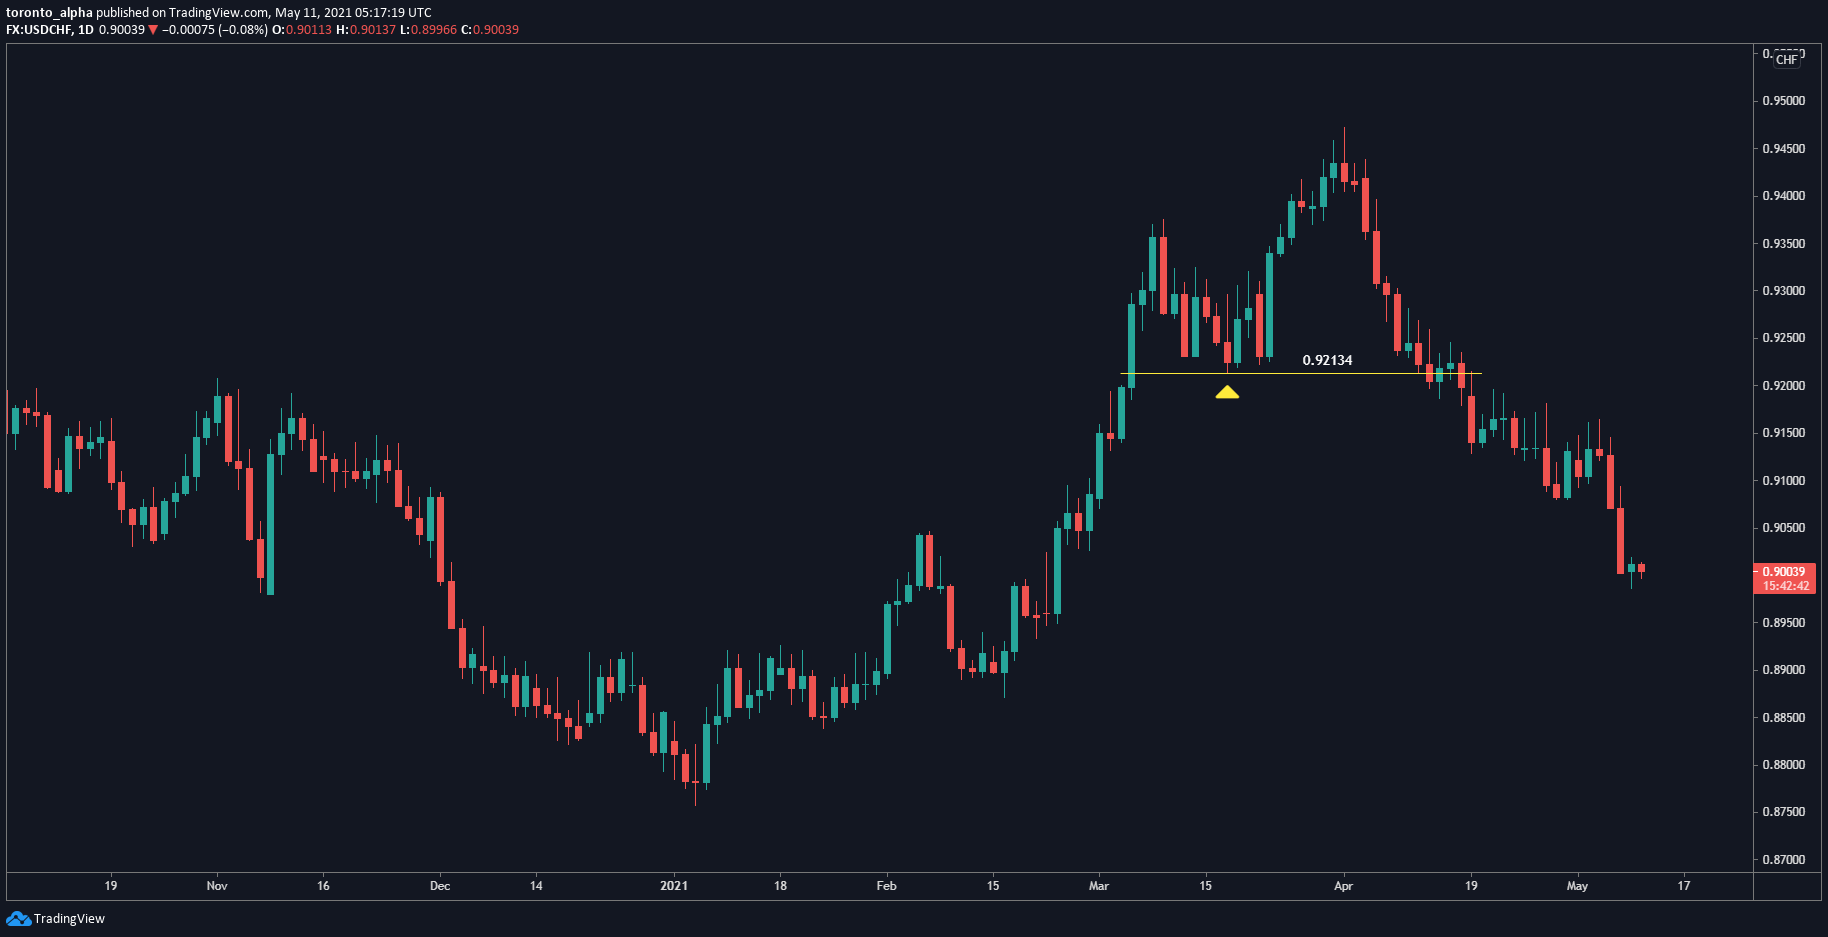
The USD/CHF had been in a downtrend since the beginning of April, then reversed into an uptrend that started at the beginning of 2021 and is now trending downwards again.
The four-hour chart will give us a closer look:
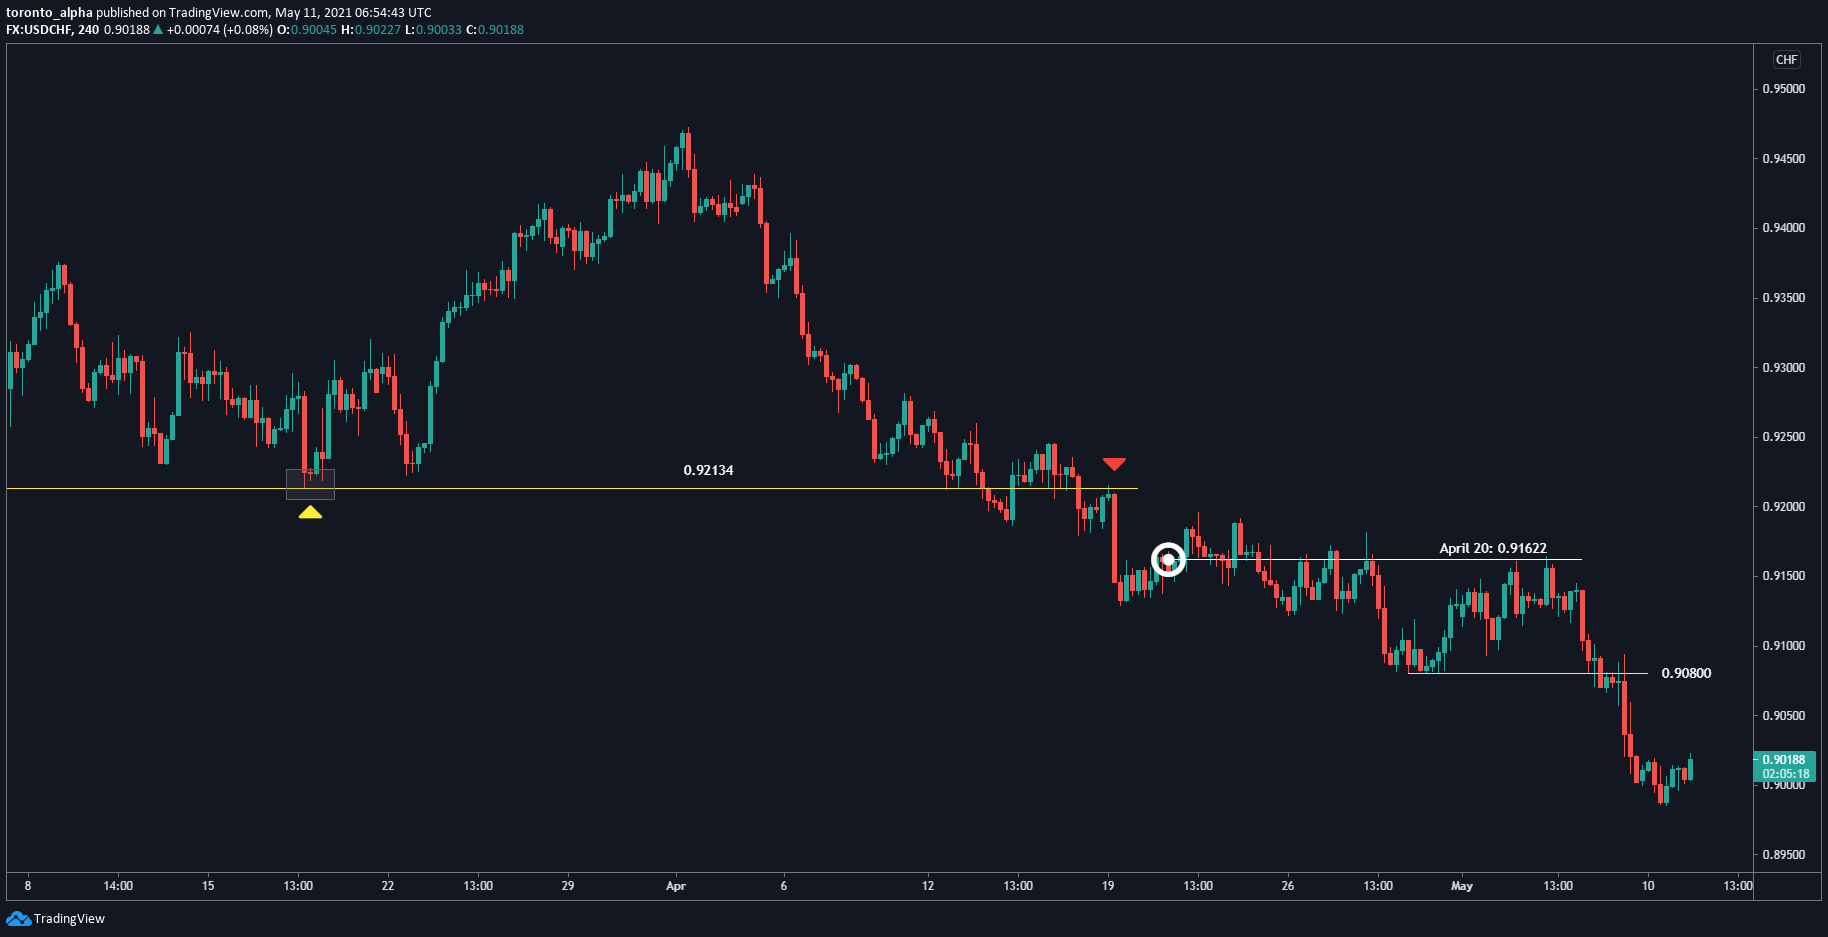
The pair broke a support level at 0.92134 on April 13th and tested it as resistance, pushing down quite heavily after that. The pair is still trending downwards, as was our forecast in our April 20 webinar. The price has recently broken a minor support at 0.90800. We are still bearish USDCHF, and the next support level is 0.88714, giving it plenty of space to move further down. There’s room to enter a bearish trade on the lower timeframes.
Now let’s look at the NZD/USD pair:
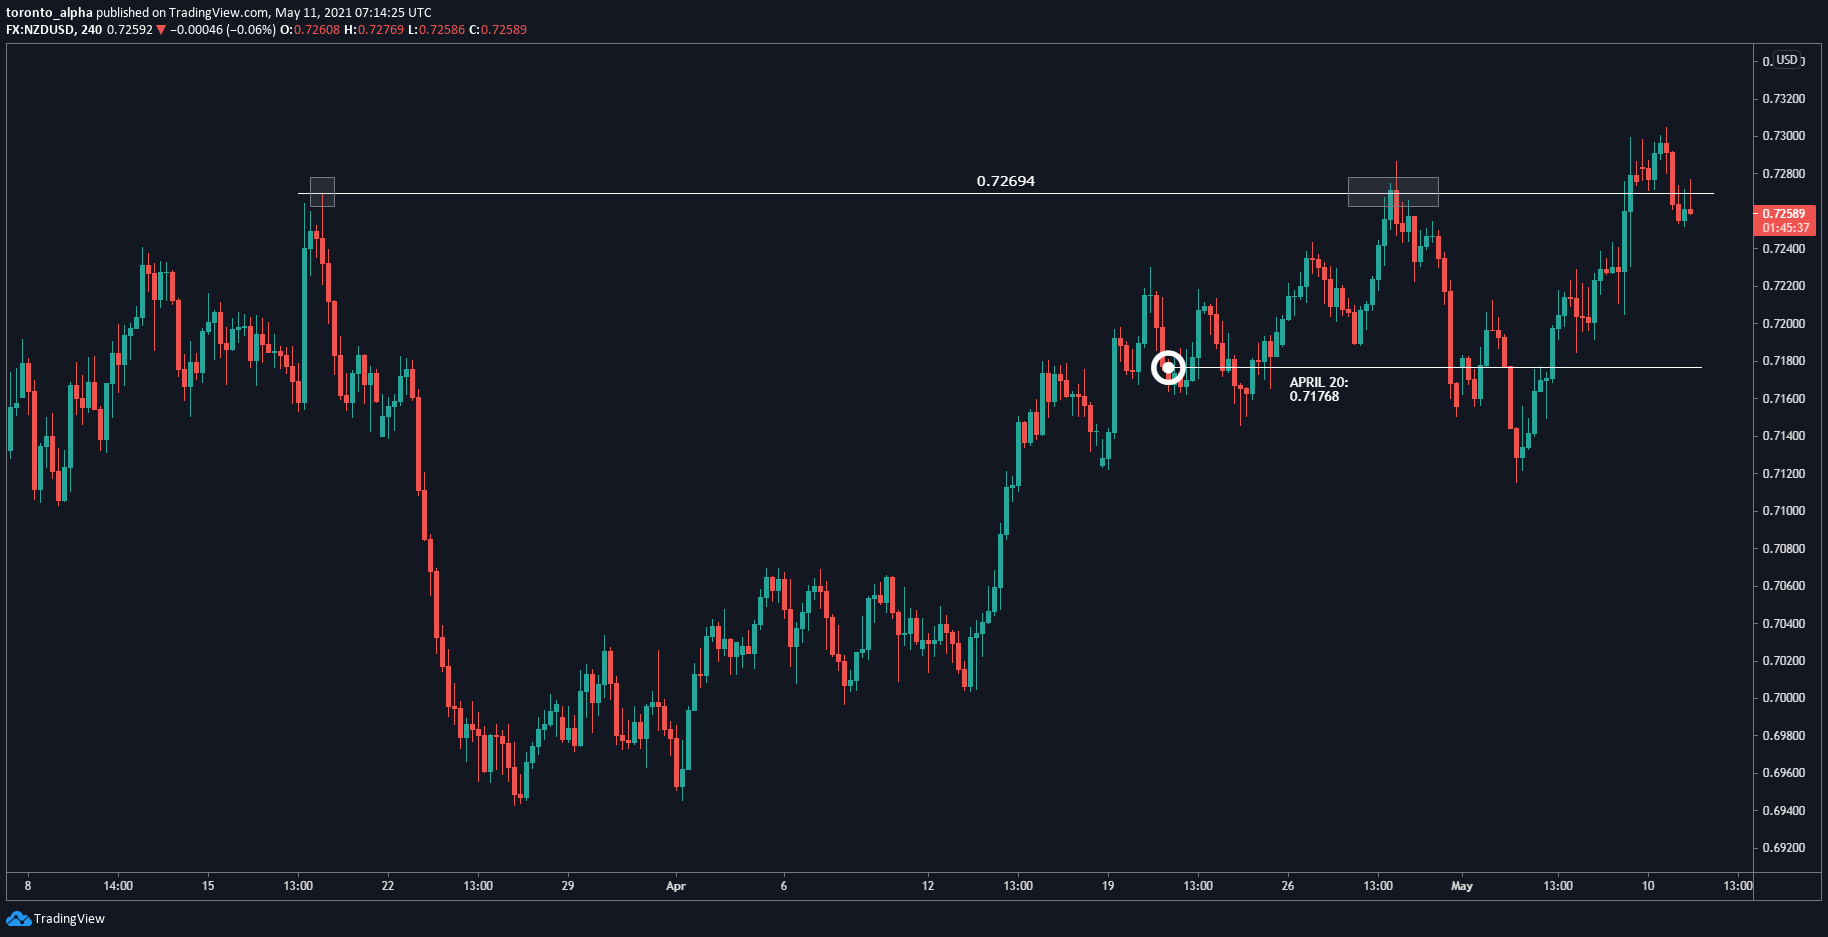
The NZD/USD began an uptrend in March 2020 and in recent months made a head & shoulders reversal pattern with a neckline at 0.71043. However, the reversal was short-lived when the price found support at 0.69430, which used to be a prior long-term resistance level, thus making it a failed reversal pattern. Whenever a trend reversal fails, it is a strong signal for the original trend. Here, for instance, the failed reversal was a very bullish sign.
The price moved back up over 0.71043, indicating that bullish sentiment had returned. In our April 20th analysis, we were bullish the NZD/USD when the price was at 0.71768, and the price has moved up +100 pips from that level since and has recently retraced. We therefore remain bullish the NZD/USD. A key level to look out for is the 0.72694 resistance area; if the price settles above there, I would take a bullish trade.
The AUD/USD is similar to the NZD/USD:
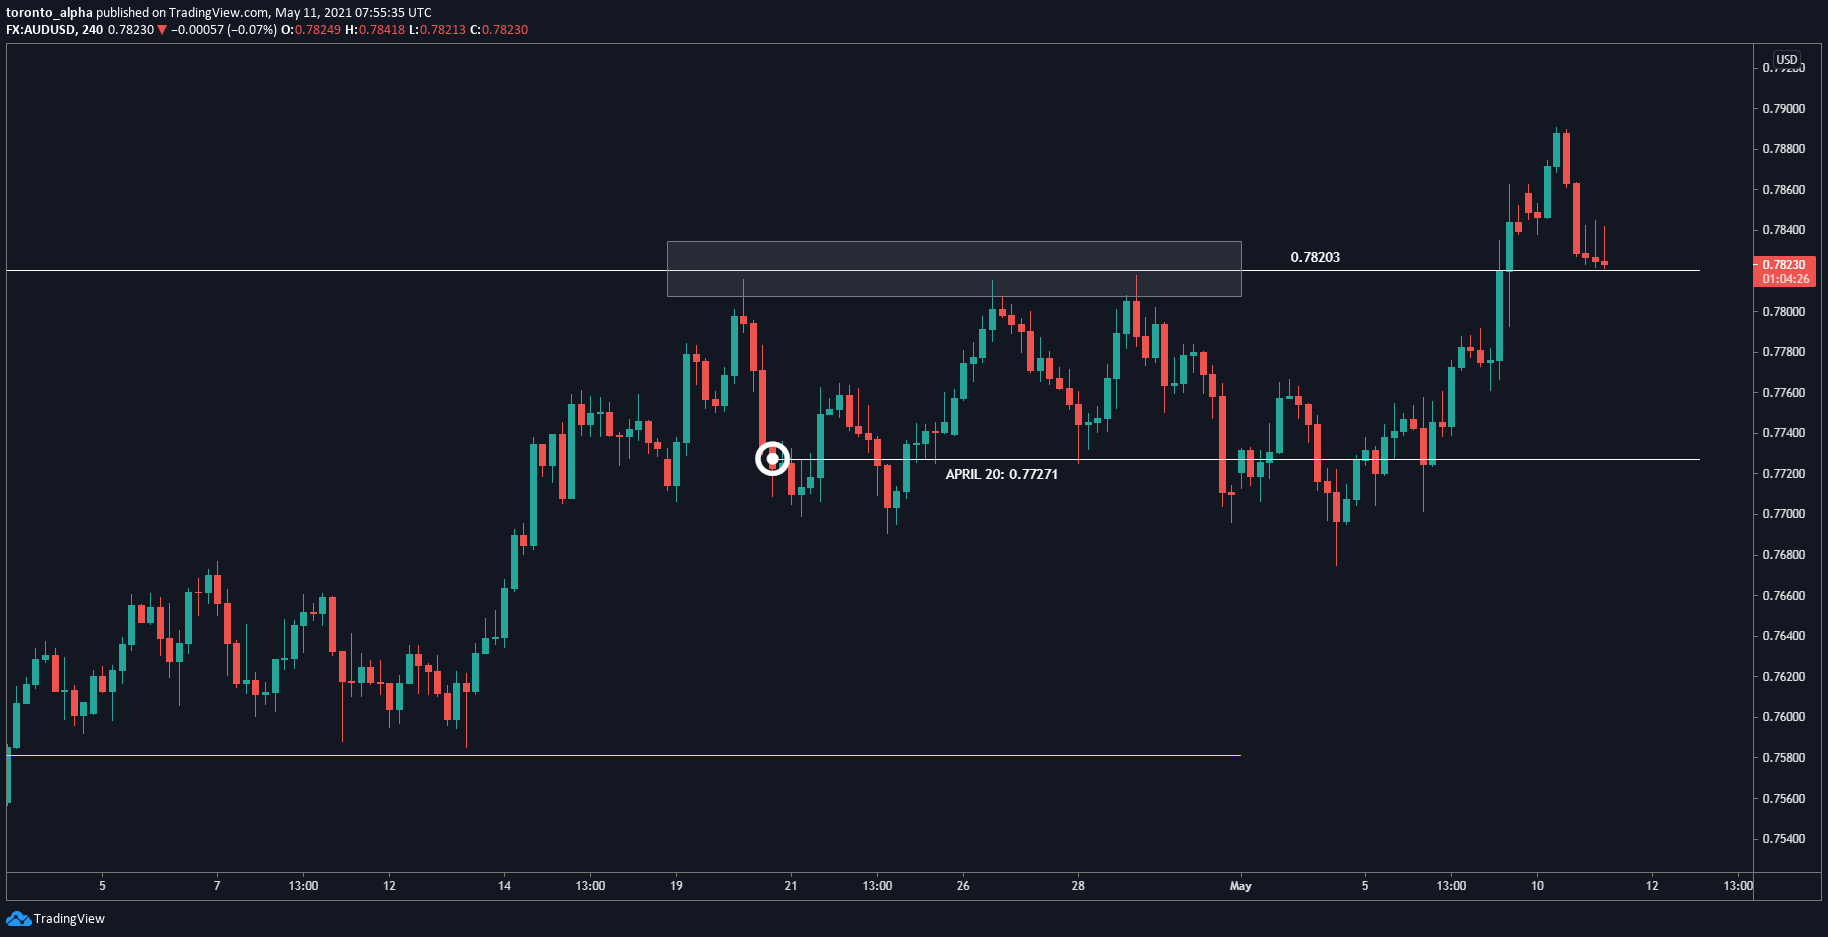
The AUD/USD was in an uptrend and started to move a bit sideways since December 2020. In recent months, the pair made a head & shoulders reversal pattern with a neckline at 0.75812. However, the price did not decisively break the neckline but remained above it, which is a bullish sign. In our April 20th analysis, we indicated bullish sentiment for UDUSD when the price was at 0.77271; and indeed, the price moved up over +150 pips from that level since and has recently retraced, so we remain bullish AUD/USD. If you still want to enter a trade, wait until the price settles above 0.78203, where you can see a triple-top formation on the 4-hour chart in the last week of April 2021.
The USD/CAD, on the other hand, is in a downtrend, as seen on the four-hour chart:
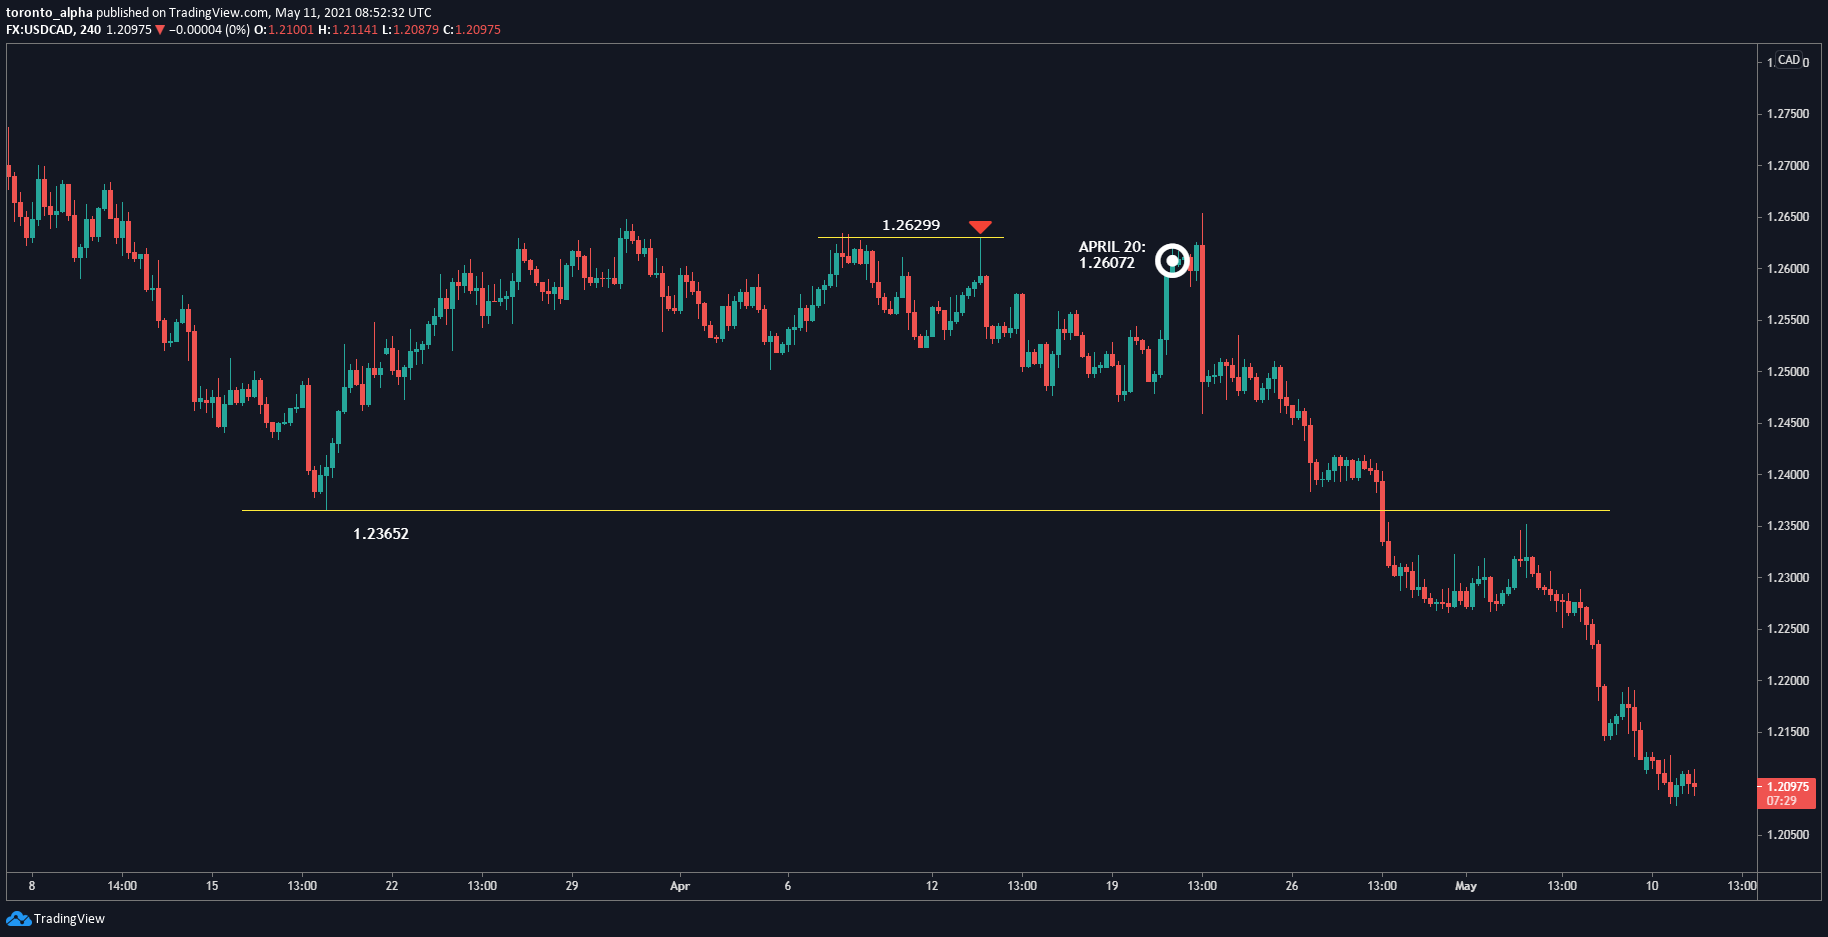
The USD/CAD pushed up hard in January 2020 but since then has broken multiple support levels.
In our April 20, 2021 analysis, we forecasted that USD/CAD would continue its downtrend, and marked the 1.26299 level as a previous resistance worth watching. The USD/CAD indeed touched 1.26299 within a few days and has since fallen close to 500 pips. On the lower timeframes, we might go short the USD/CAD on pullbacks. However, the price is now sitting on 1.20822, a long-term support level from September 2017. We recommend waiting for the next two weekly candles to close to see how the price reacts at this support level.
Lastly, let’s now look at the USD/JPY:
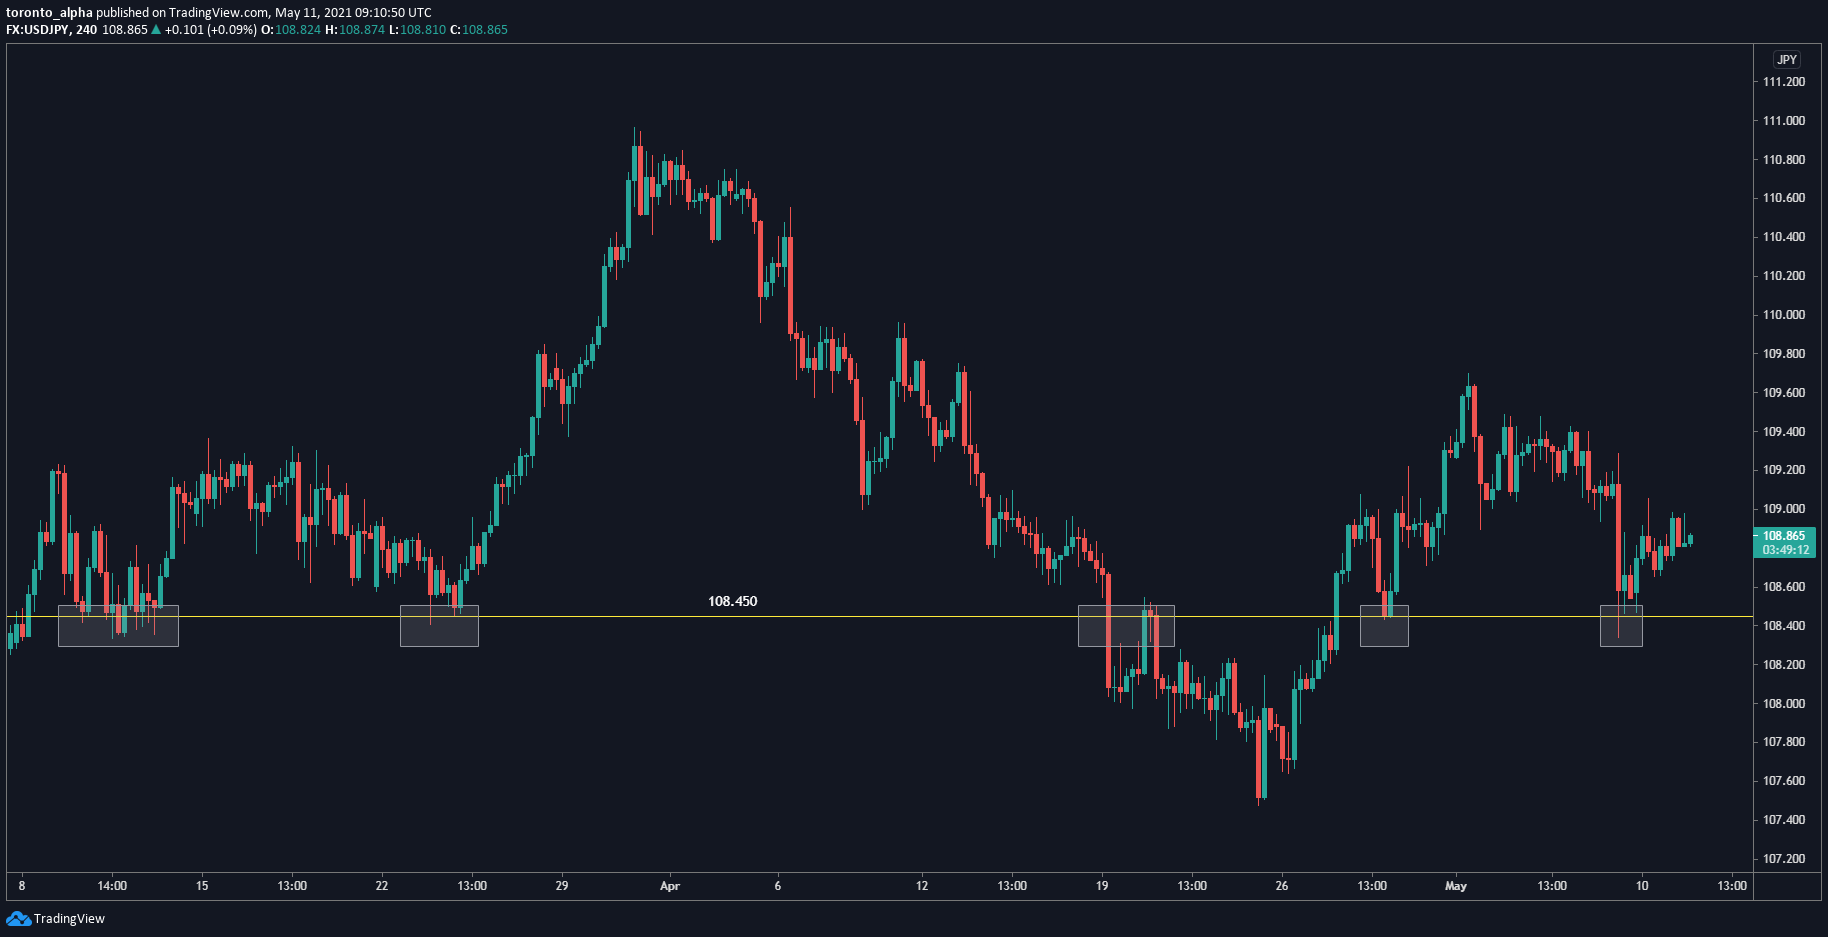
The USD/JPY had been trending down until the beginning of April 2021, then turned around and has since been trending up nicely. The price broke through previous support at 108.45 and subsequently tested it as a resistance, so our view was that the downtrend would continue. The price did move down about +50 pips; however, it reversed and broke through the 108.45 level, which is now a support level again. This was a 180-degree turn in sentiment, so we can’t simply remain bearish. We are neutral the USD/JPY as it is in a range, but there are potential long trades from 108.450 on the lower timeframes.
I hope these technical analyses prove useful. However, if you are looking for some additional tools to help you in your trades, look no further than DailyForex.com’s free Forex signals by Adam Lemon, one of the industry’s top analysts. Simply visit DailyForex.com and click on Free Forex Signals on the right of the page.
Finally, a word of advice:
If a chart isn’t clear, stay away from it. Either go to a different pair, different timeframe, or just wait until you get clarity.
Also, always mind your risk. This will determine your profits. So make sure you always set a stop loss with good targets, and make positive risk/reward ratios.
