There are three common ways of making money from the movement of stock prices:
Going long or short on the underlying shares;
Purchasing or writing options on the stocks;
Trading Contracts for Differences (CFDs).
Buying and selling the underlying shares is the most basic way of trading the stock markets. You own the shares, which means you own a piece of a company. Most common shares carry voting rights. But buying the shares usually means you have little to no leverage. And it’s not always possible to short a stock. If you do short a stock, your losses can be unlimited as there is no ceiling to how much and how quickly the trade can go against you. Institutional investors experienced this reality when they were short the U.S. stock GameStop, and the price rose multiple fold, causing huge losses for short investors.
There are two types of equity options: calls and puts. Call options give you the right to buy a stock; put options give you the right to sell a stock. Call options can provide leverage to long positions. Put options make it easy to profit from falling stocks without the risk of unlimited losses. Options can be complex and require a learning curve. When you are long an option, dissipating time value can work against you.
CFDs allow for leverage, but you don’t own the underlying stock, which means no voting rights. CFDs carry overnight financing costs. Whenever you have a leveraged position, you risk multiplying your losses and facing margin calls. CFDs can be a low-cost way to access non-domestic stocks.
One of the most important things you need to trade stocks is a good, reliable broker who can help educate you and provide a top-tier trading experience.
Let’s take a look at seven important stocks: 4 in the electric vehicle sector, namely Tesla, Nio, Xpeng, and Ford; 3 chip companies: Intel, Nvidia, and AMD; and one technology company, Cisco.
Tesla
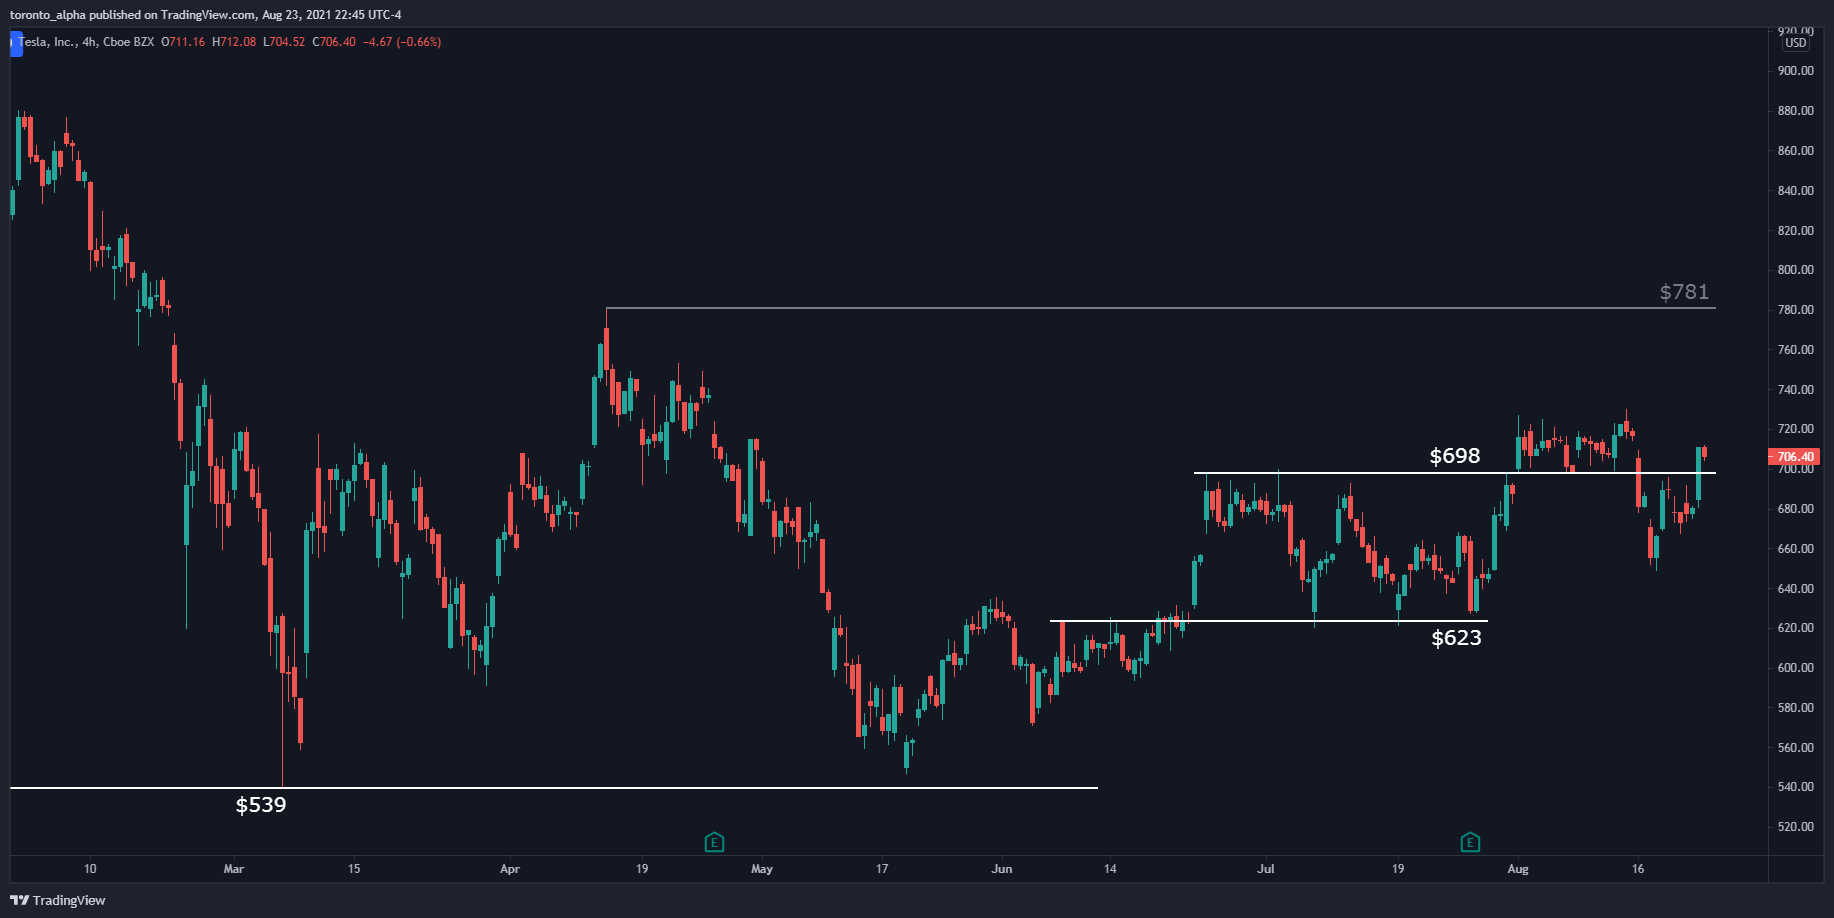
Tesla stock has had a meteoric rise increasing in value more than tenfold since the beginning of 2020, but the stock price has stalled this year. It peaked at $900.40 in January 2021, but it made a support at $539 in March, which has held. It made another support at $623 and is now sitting above a key level of $698. Since March 2021, the technical picture is looking bullish with a series of rising support levels. It must break the $781 resistance that it made in April 2021 as its next key test.
Nio
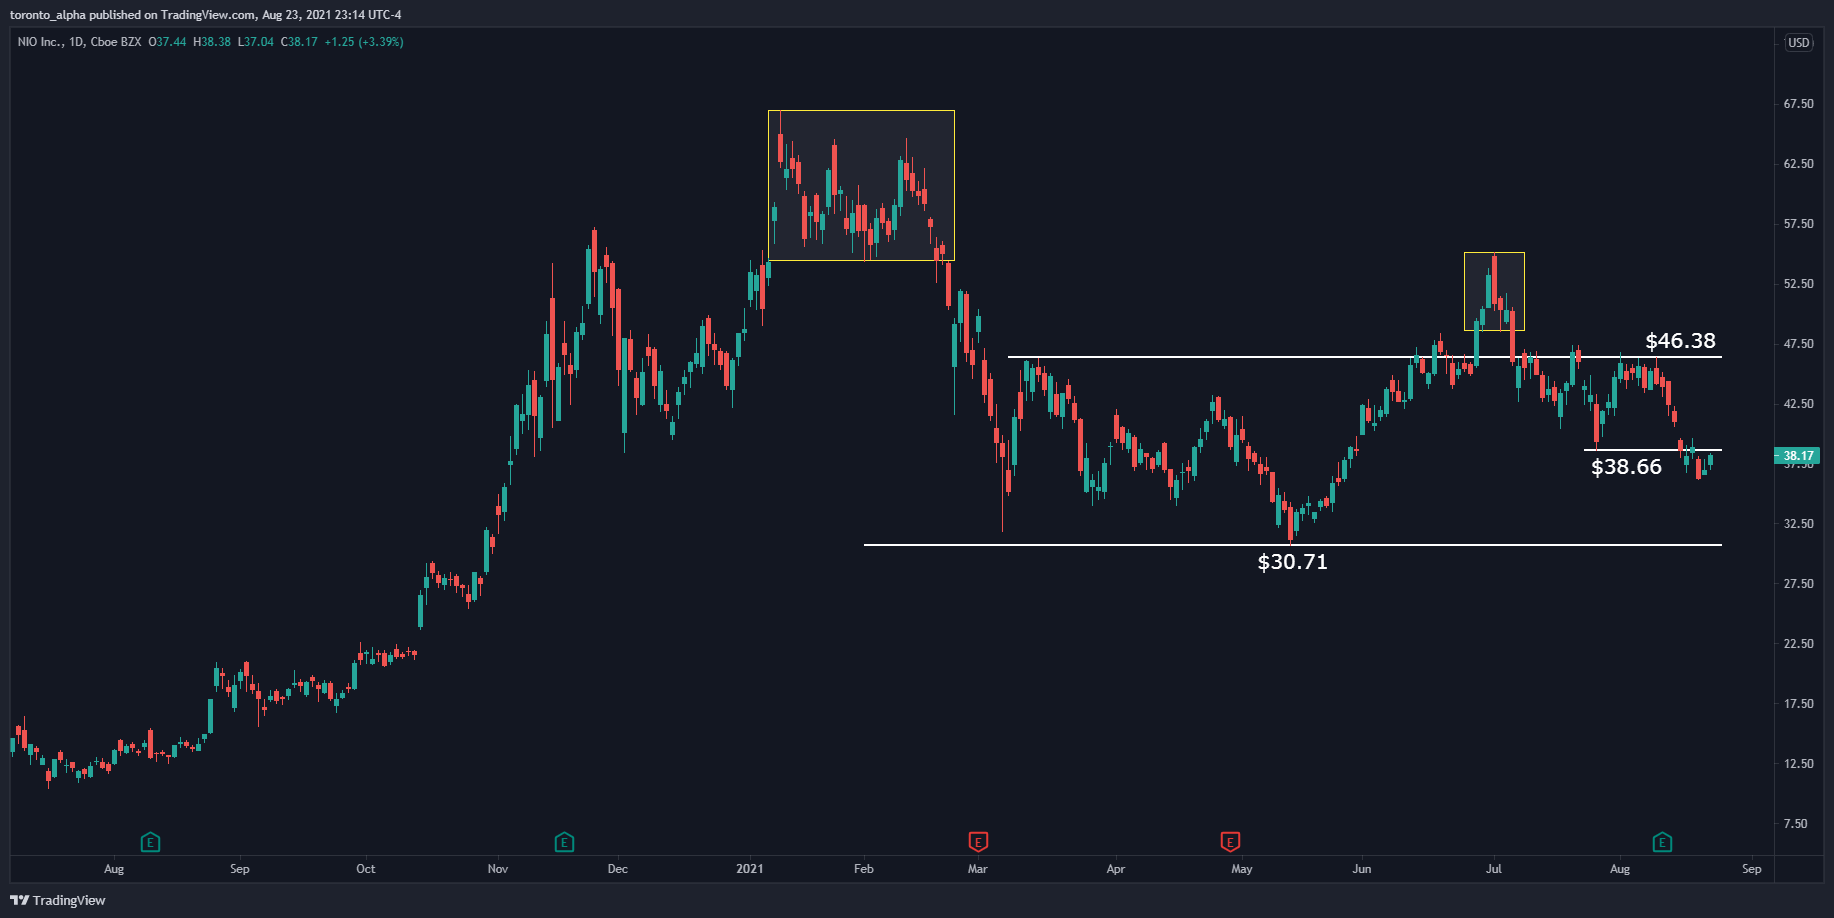
Nio had a similar meteoric rise in value. It went from a low of $1.19 a share in 2019 to a peak of $66.99 in early 2021. After a swift retrace, the stock found support at $30.71.
Xpeng
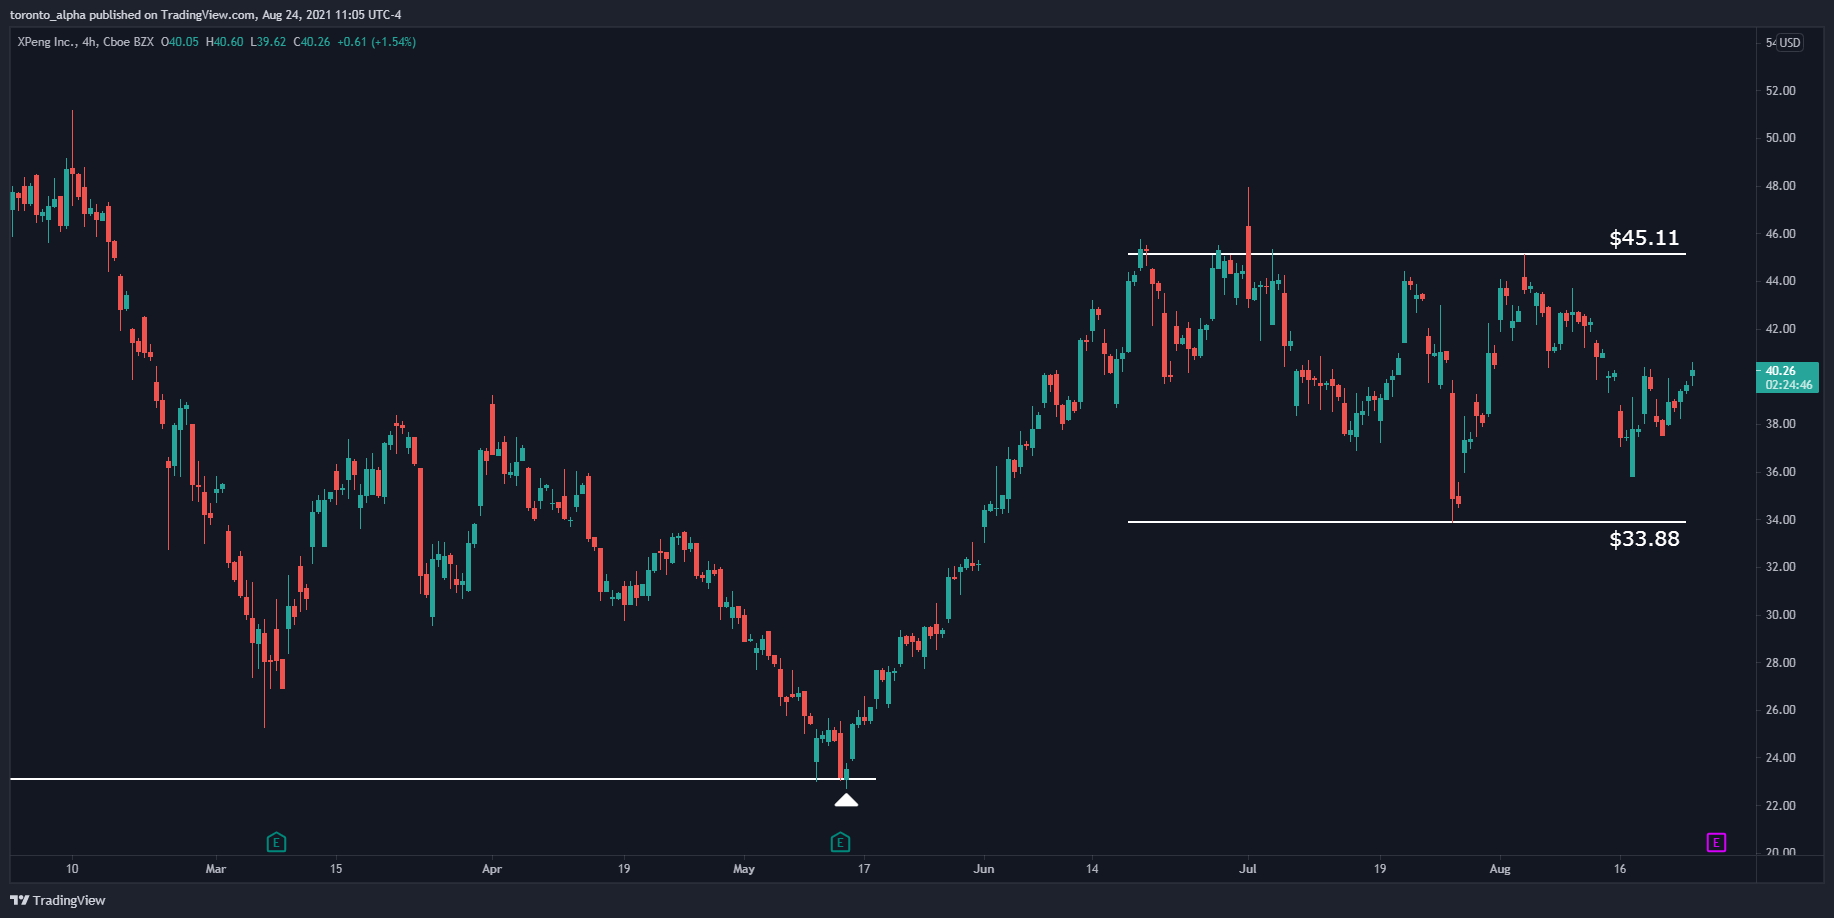
Xpeng went from a low of $17.11 in September 2020 to a high of $74.49, only for the price return to $22.73 before rebounding. It’s now sitting in a range between $33.88 and $45.11. Whichever side it breaks will determine the new trend. It’s got a resistance above $46.38 and is sitting below a broken support level of $38.66. A break below $30.71 would be bearish.
Ford
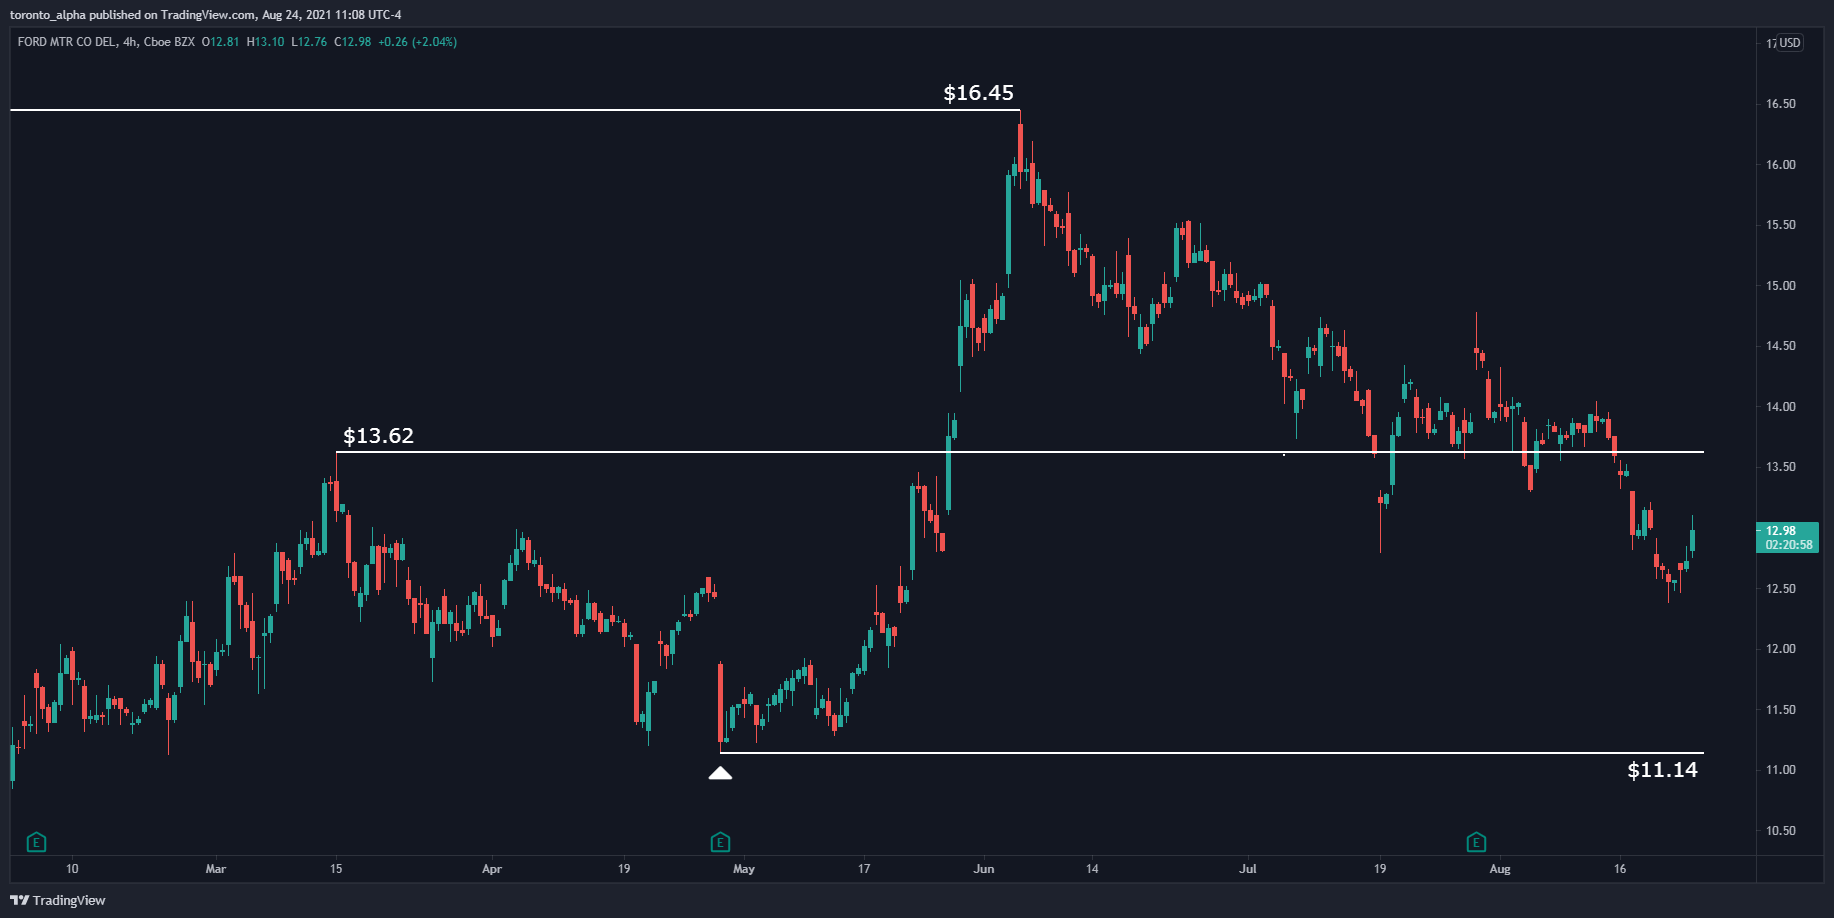
Although Ford is not a full Electric Vehicle company, it’s moving in that direction. The stock price traded up to $16.45 in June 2021, a resistance area from 2014 and prior. A break below $11.14 would be bearish. The previous resistance of $13.62 could act as resistance again.
Intel
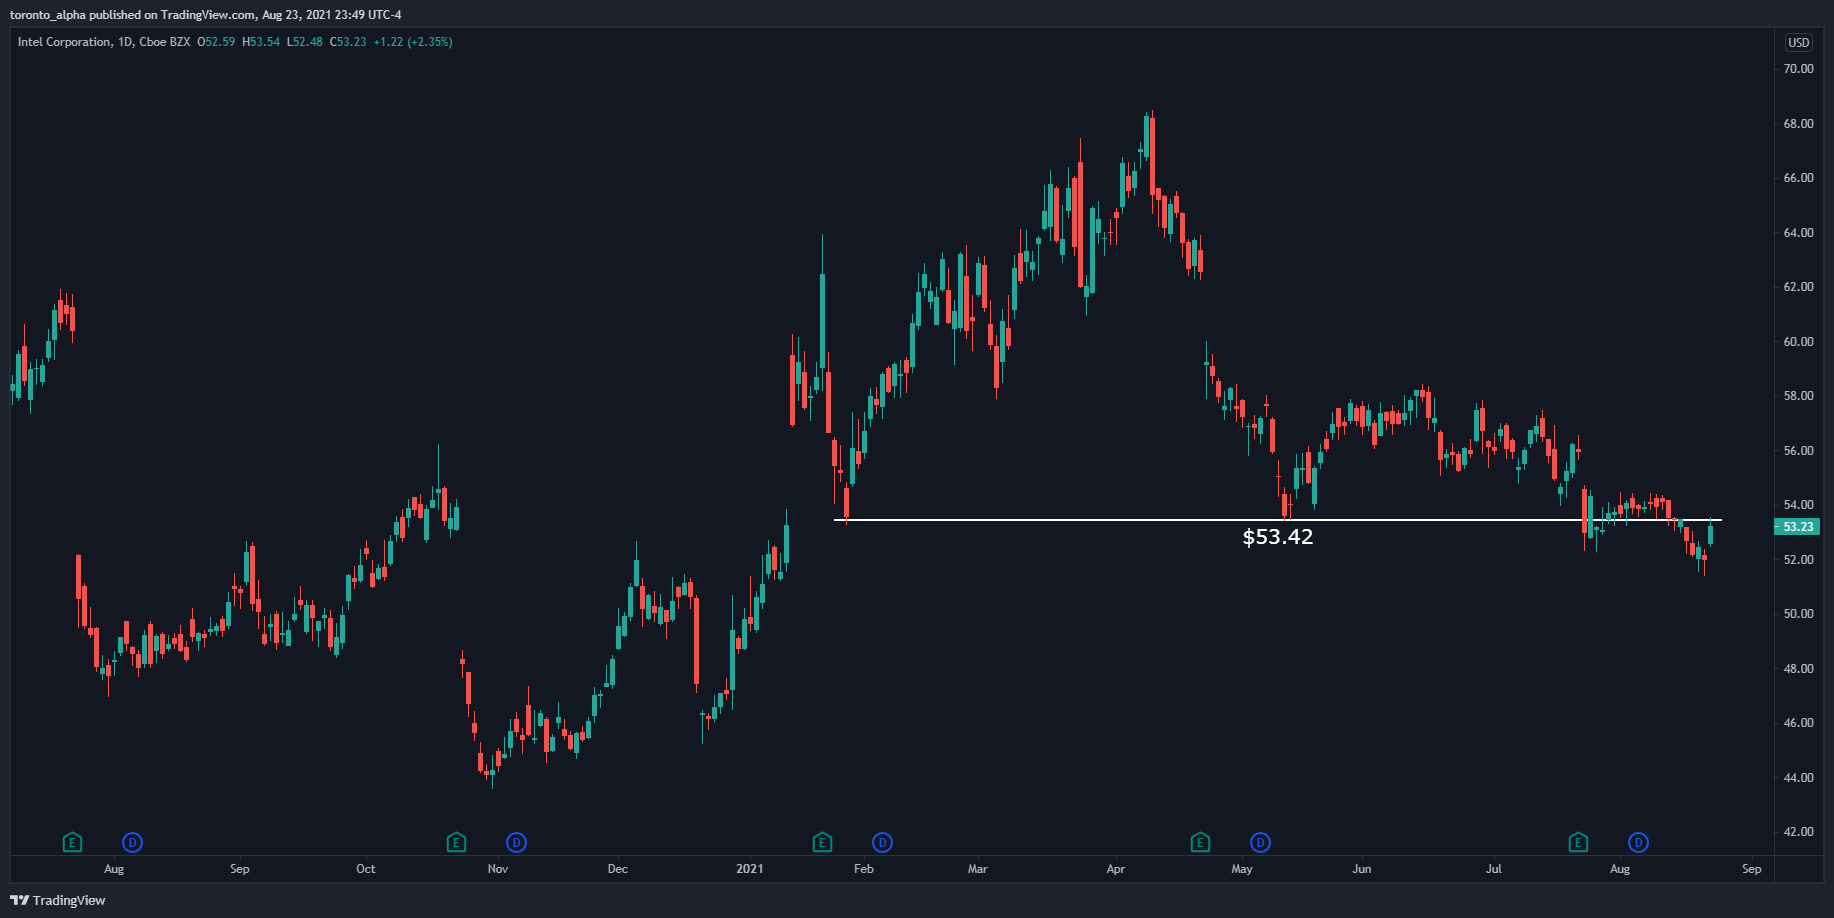
Intel is a messy stock, having traded in a volatile sideways range since 2018. Today, the stock sits below key support at $53.42, and it will be a bearish sign if it settles below there.
Nvidia
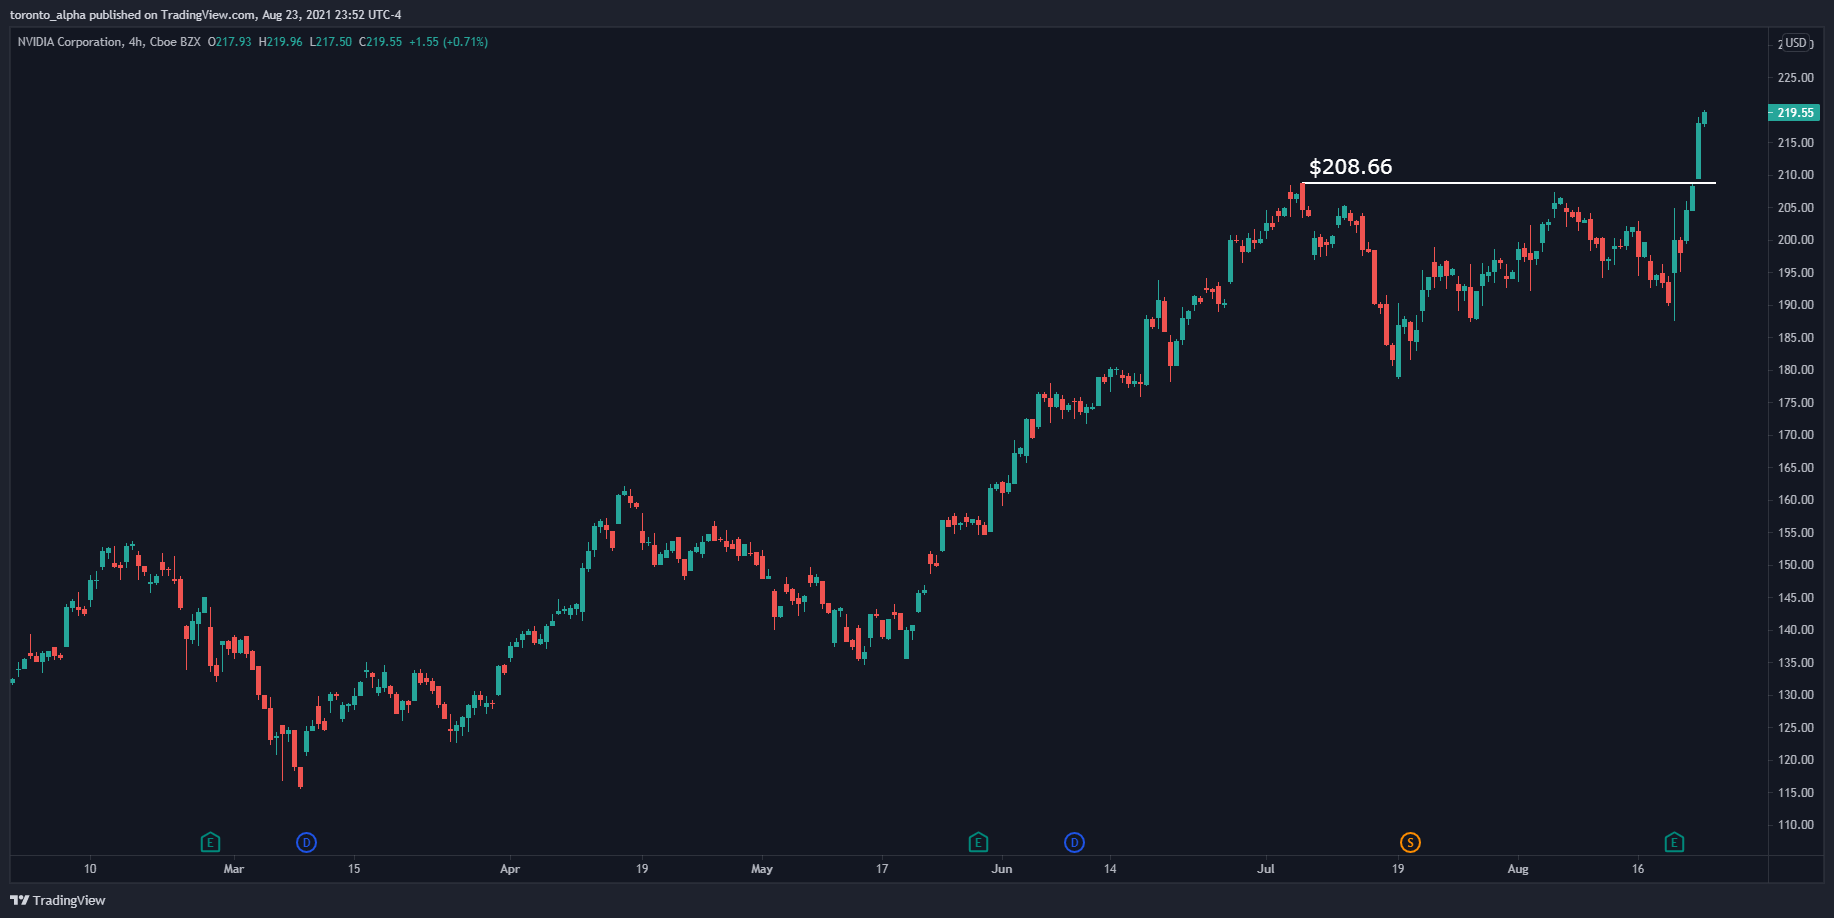
Nvidia has had a clean uptrend since before 2017. It recently broke an all-time high of $208.66. The price could come back and test this level as a support which would present a buying opportunity.
AMD
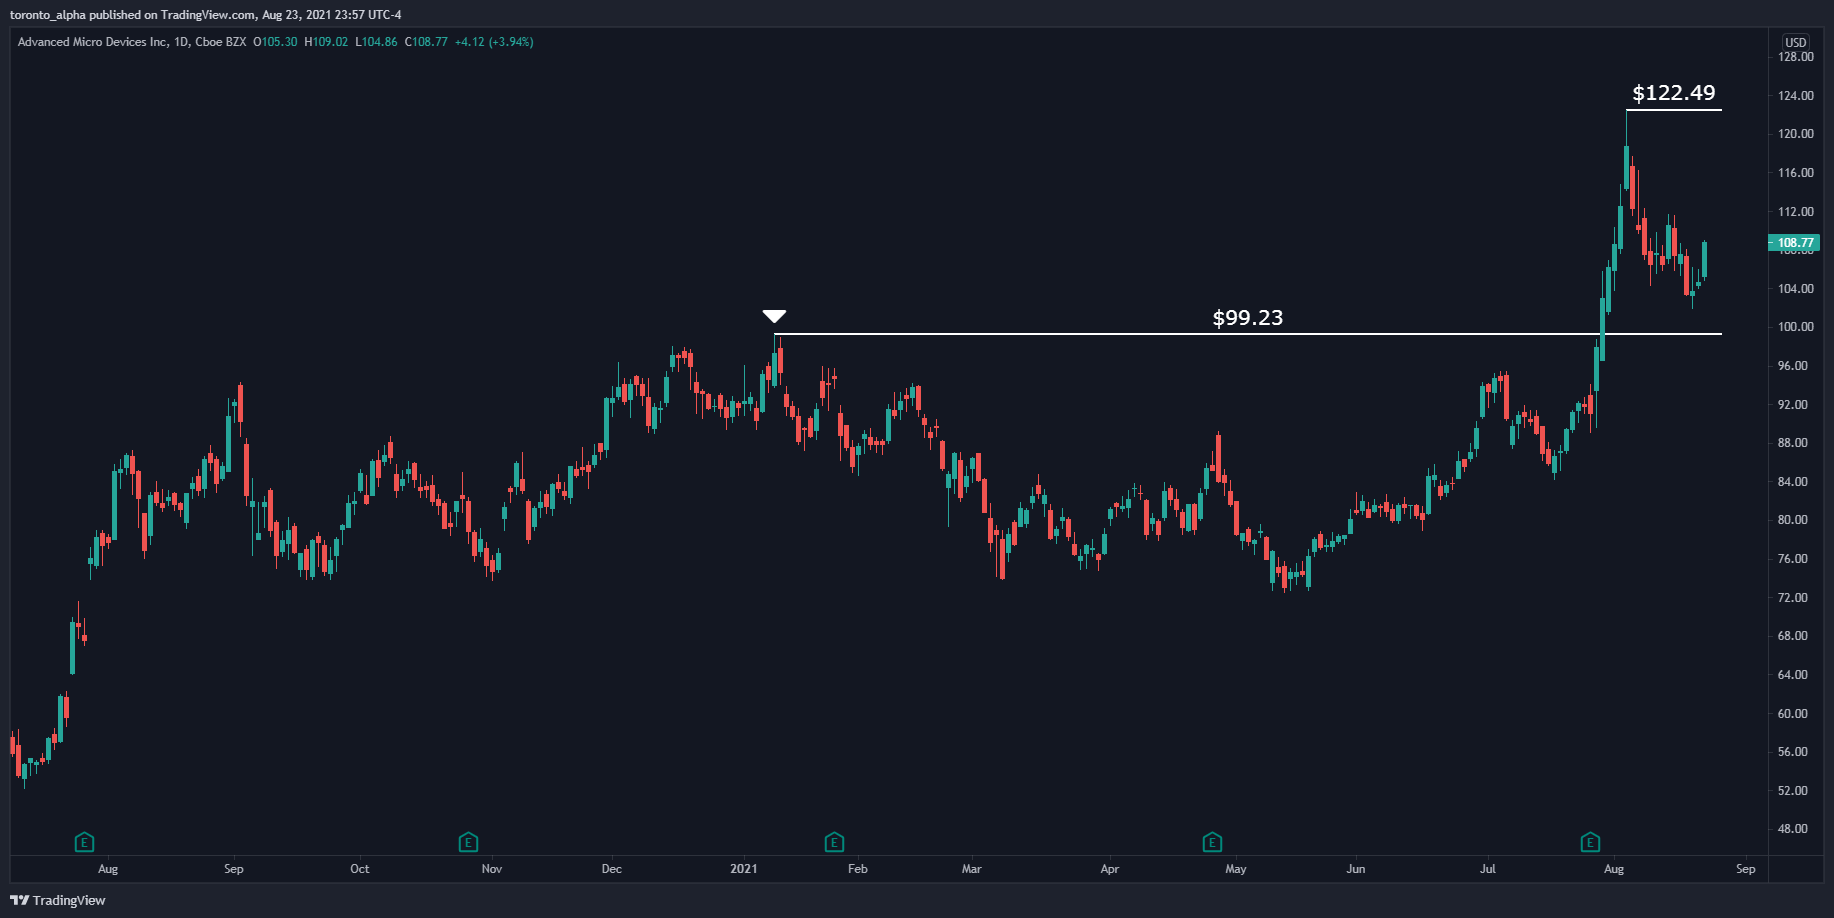
AMD has also had an uptrend since before 2017, although the last year has been messier than Nvidia’s. That said, it broke a previous all-time high, $99.23. The price has found support since then, and that’s a bullish sign.
Cisco’s price recently broke the 2019 resistance, $58.26. This is a strong resistance as the stock price halved after that level in 2019 before coming back up. We’d like to see the price settle above this level as support to be bullish. If the price does retrace further, we want it to settle above the previous resistance of $56.61 for us to remain bullish.
Final Thoughts
One thing to be careful about when you're trading is chart visibility. If a chart isn't absolutely clear to you, stay away from it and wait until it clears up, or even trade a different stock. But don't trade in the dark.
And above all, don't forget to practice good risk management.
