Conducting a market analysis is a must for anyone who is serious about trading. Whether you're speculating on stocks, ETFs, or Forex, knowing how to analyze price charts and time frames should be the modus operandi of any technical trader. Knowing how to analyze the market successfully leads to better and more successful trades and mitigates losses.
That being said, let's take a look at some of the heavy hitters in the stock and Forex markets today.
S&P 500
Big Picture
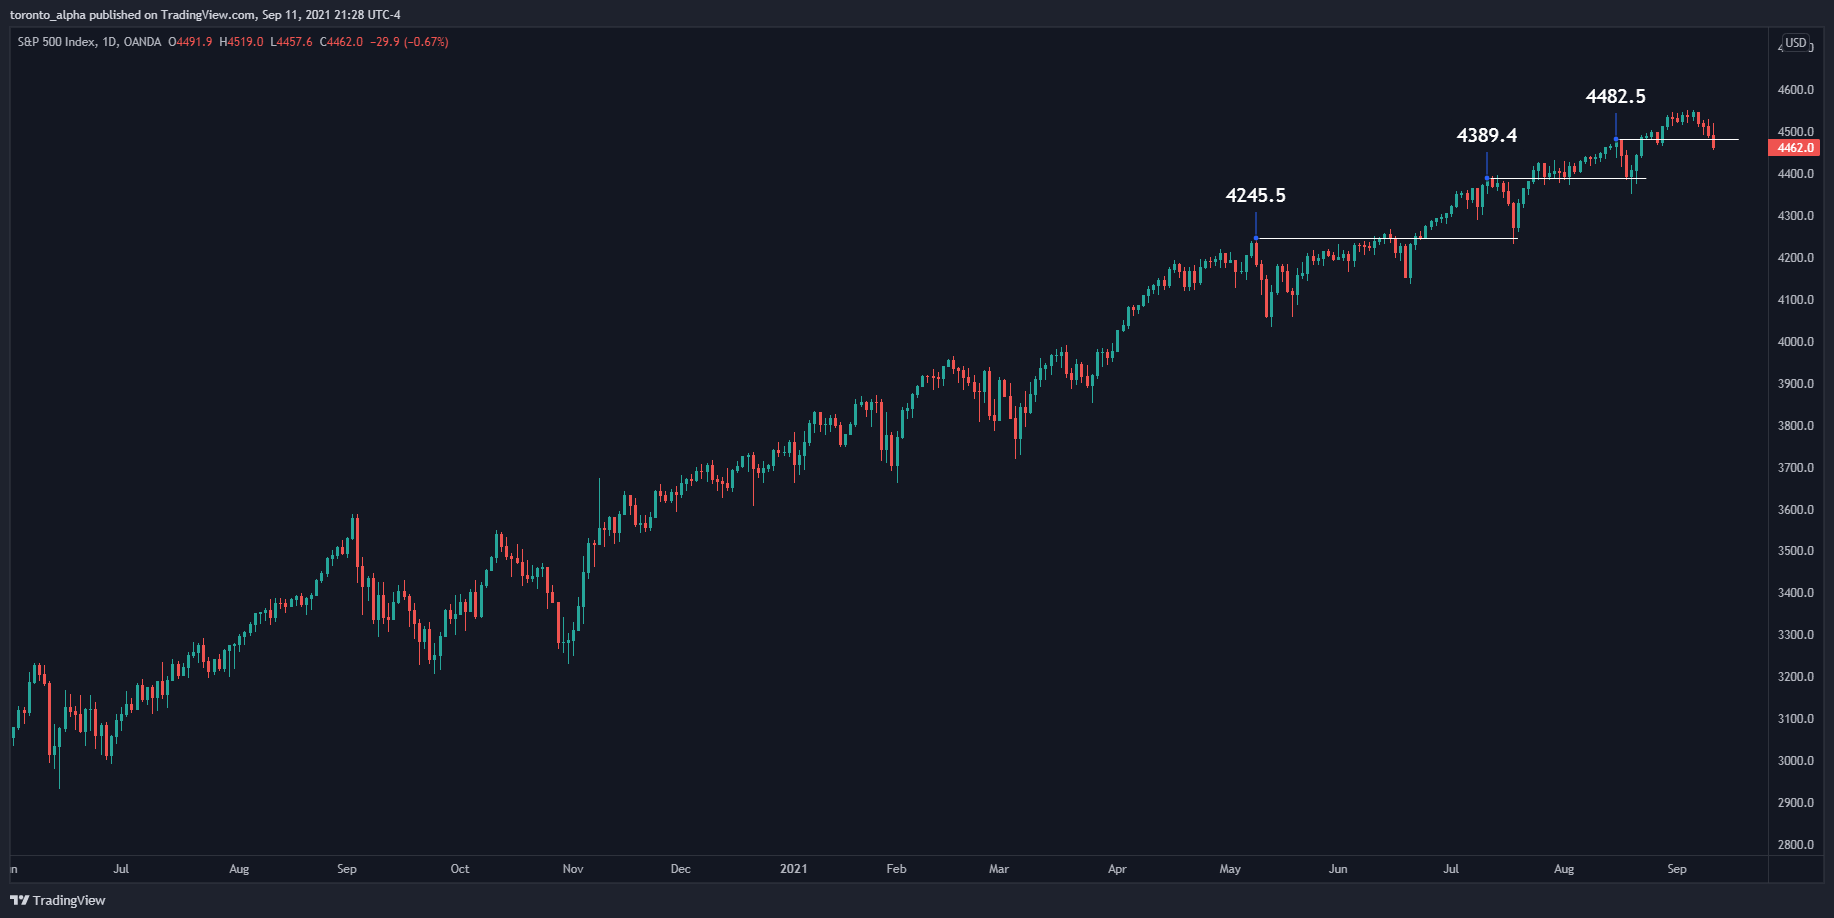
There is a long-term bullish trend intact but a short-term pullback.
The S&P 500 has been in a textbook uptrend since March 2020. Often, resistances made in the uptrend are broken and then tested as supports which offer buying opportunities.
Key Levels
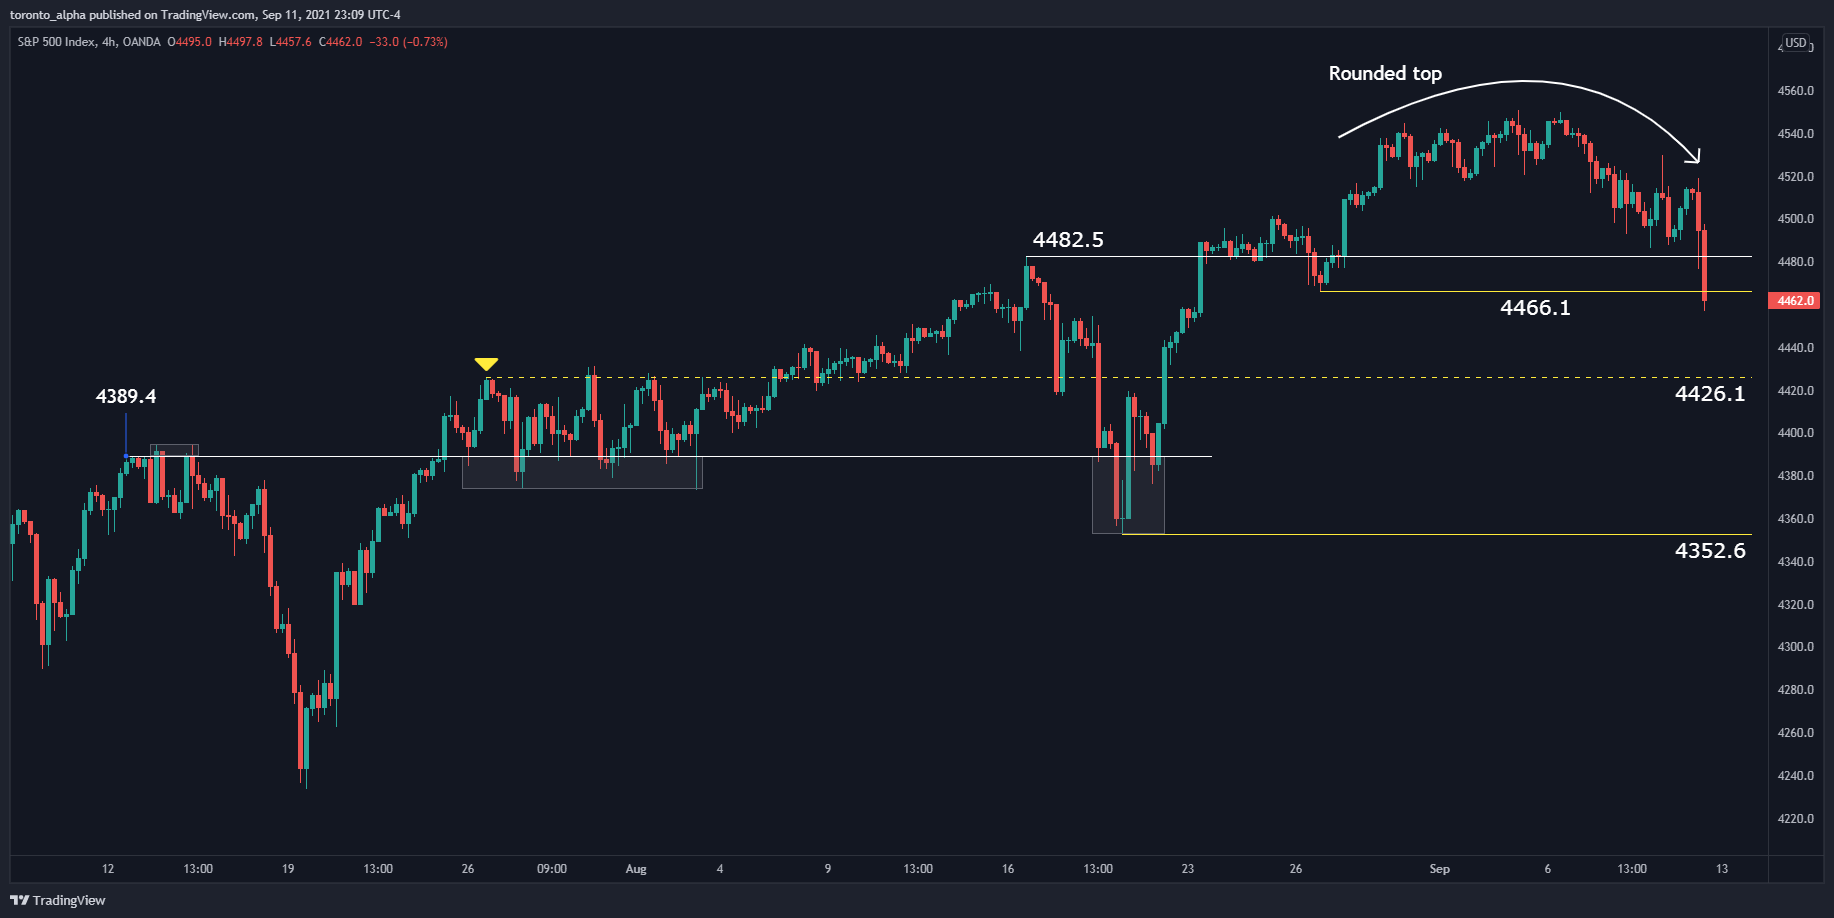
The price is sitting at a minor support, 4466.1.
The next potential support areas are 4426.1 and 4352.6.
EUR/USD
Big Picture
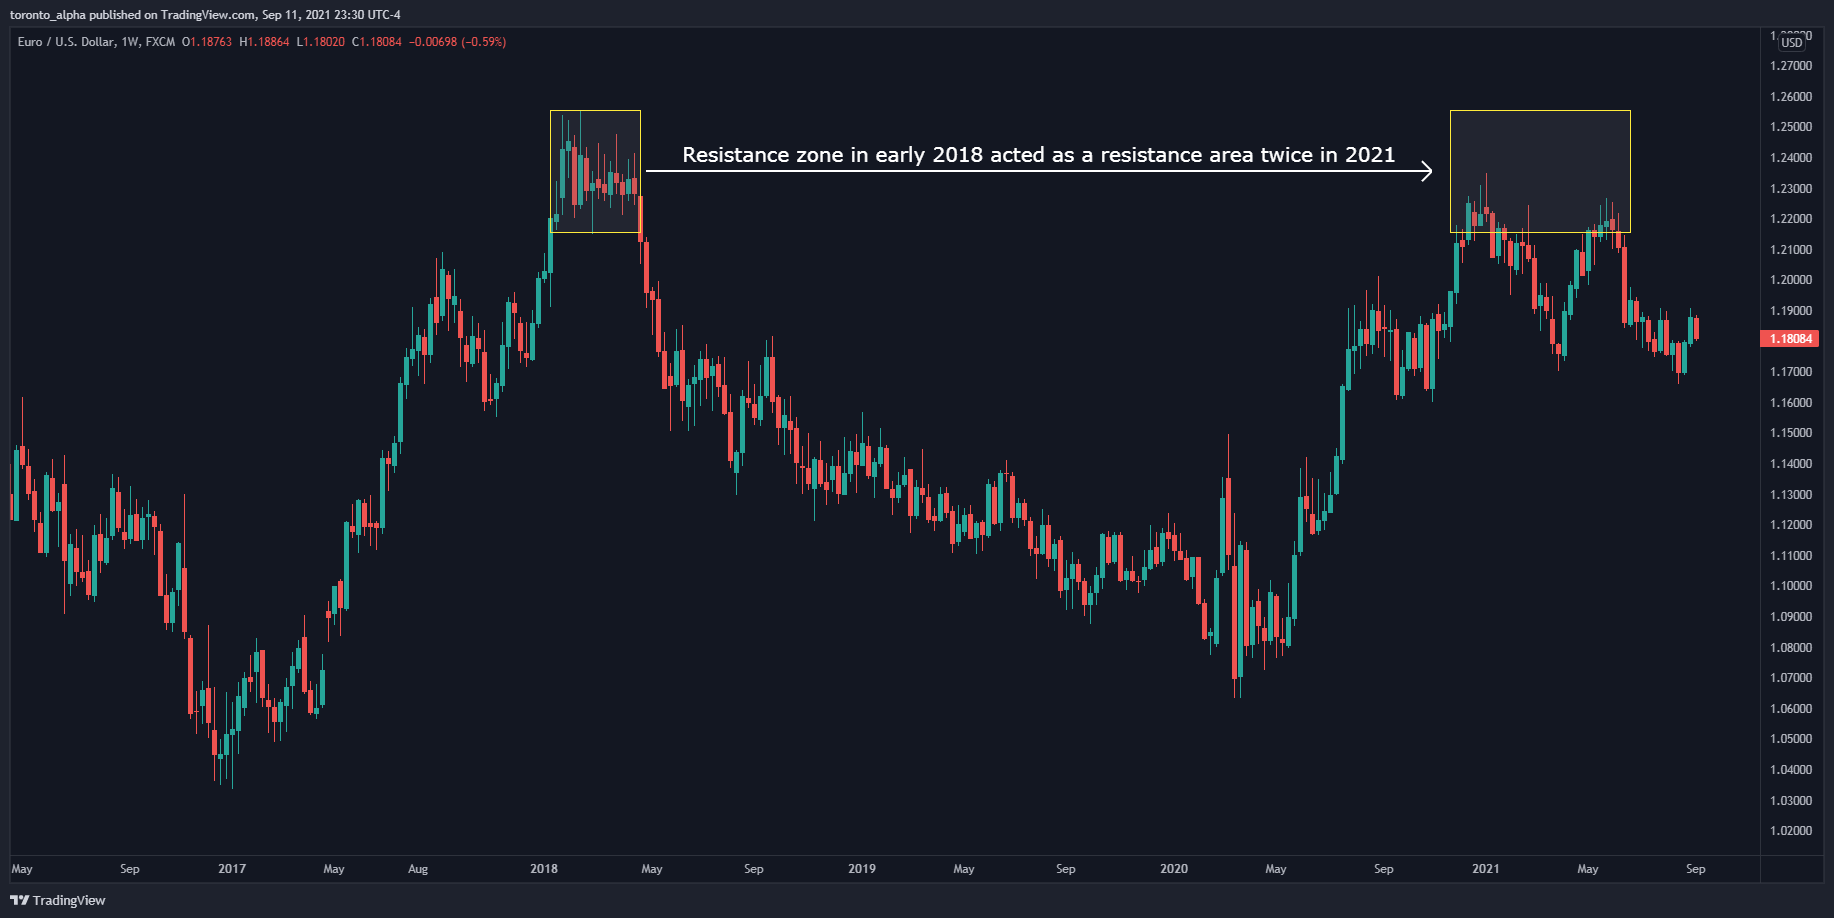
I have a long-term bearish outlook.
EURUSD began an uptrend in March 2020 which peaked in January 2021 when price reaches a previous resistance formed in early 2018. The uptrend that started in March 2020 stalled in January 2021 when the price reached a previous resistance formed in early 2018. The price made two successive lower highs in January and May 2021, visible on the weekly timeframe.
Key Levels
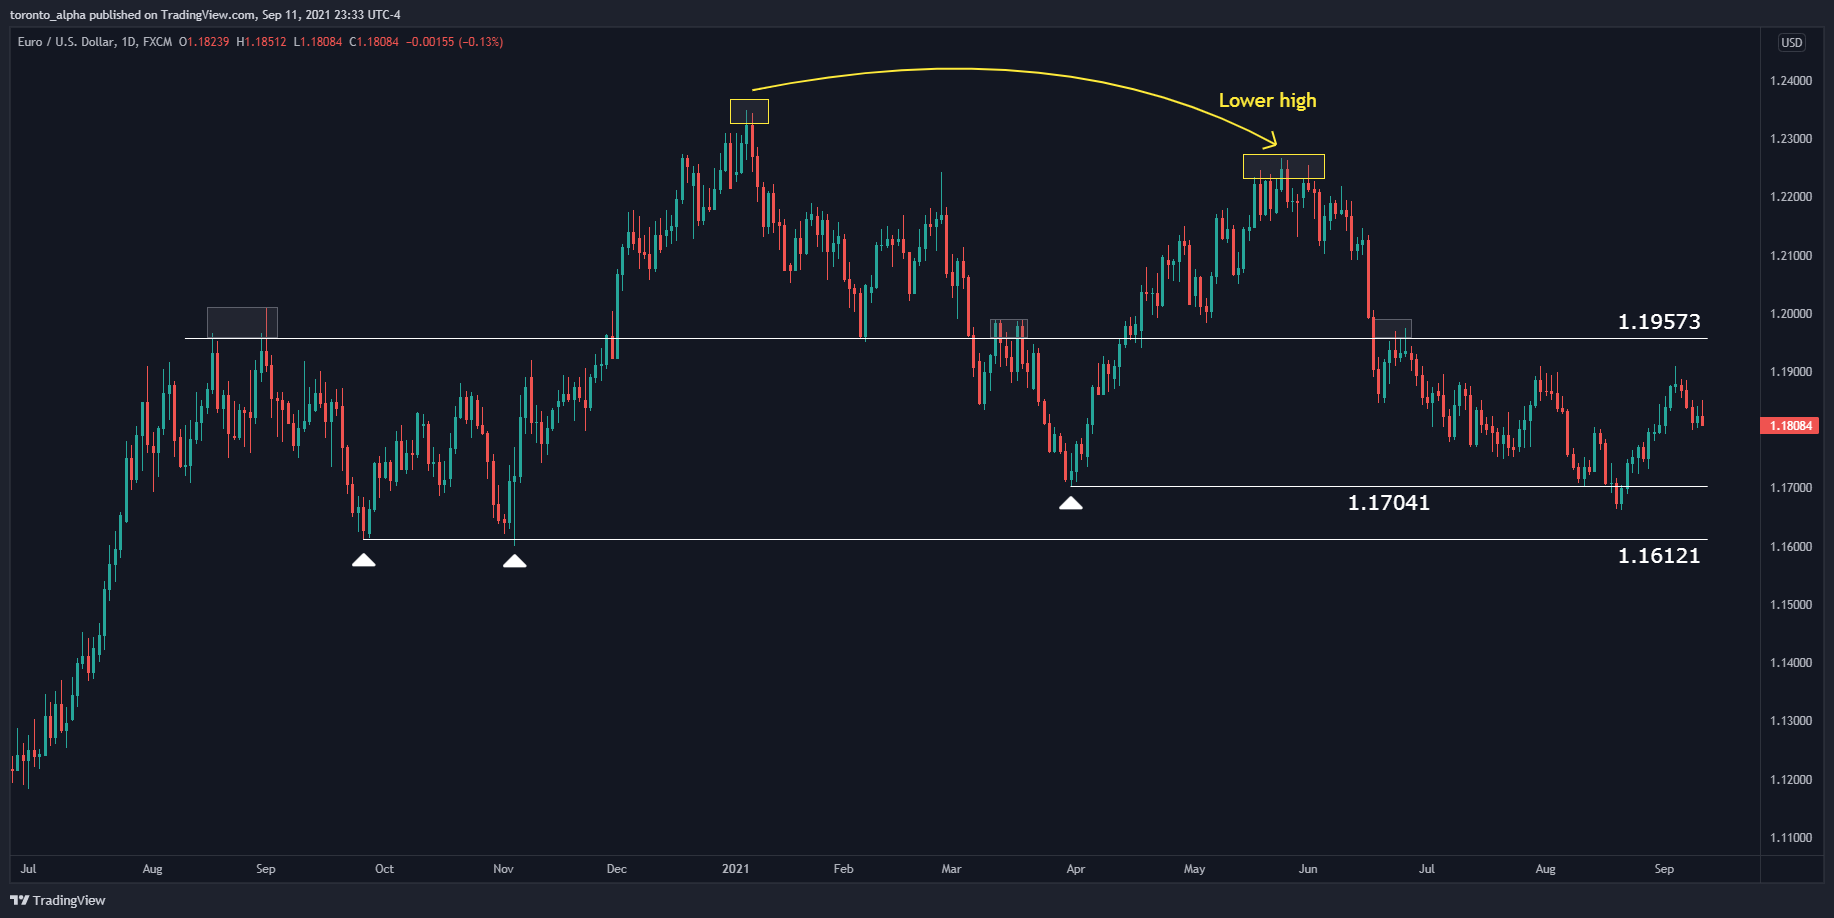
1.19573 has acted as interchangeable support & resistance as the price went sideways from January 2021 (after the uptrend that began in March 2020). The outlook will remain bearish if the price is below this level.
1.17041 and 1.16121: these levels were previous supports (visible on the daily chart from September 2020 onwards) and areas where the price could pause if it moves down. A break of these levels would indicate further bearishness, and if tested as resistance, are potential entry areas.
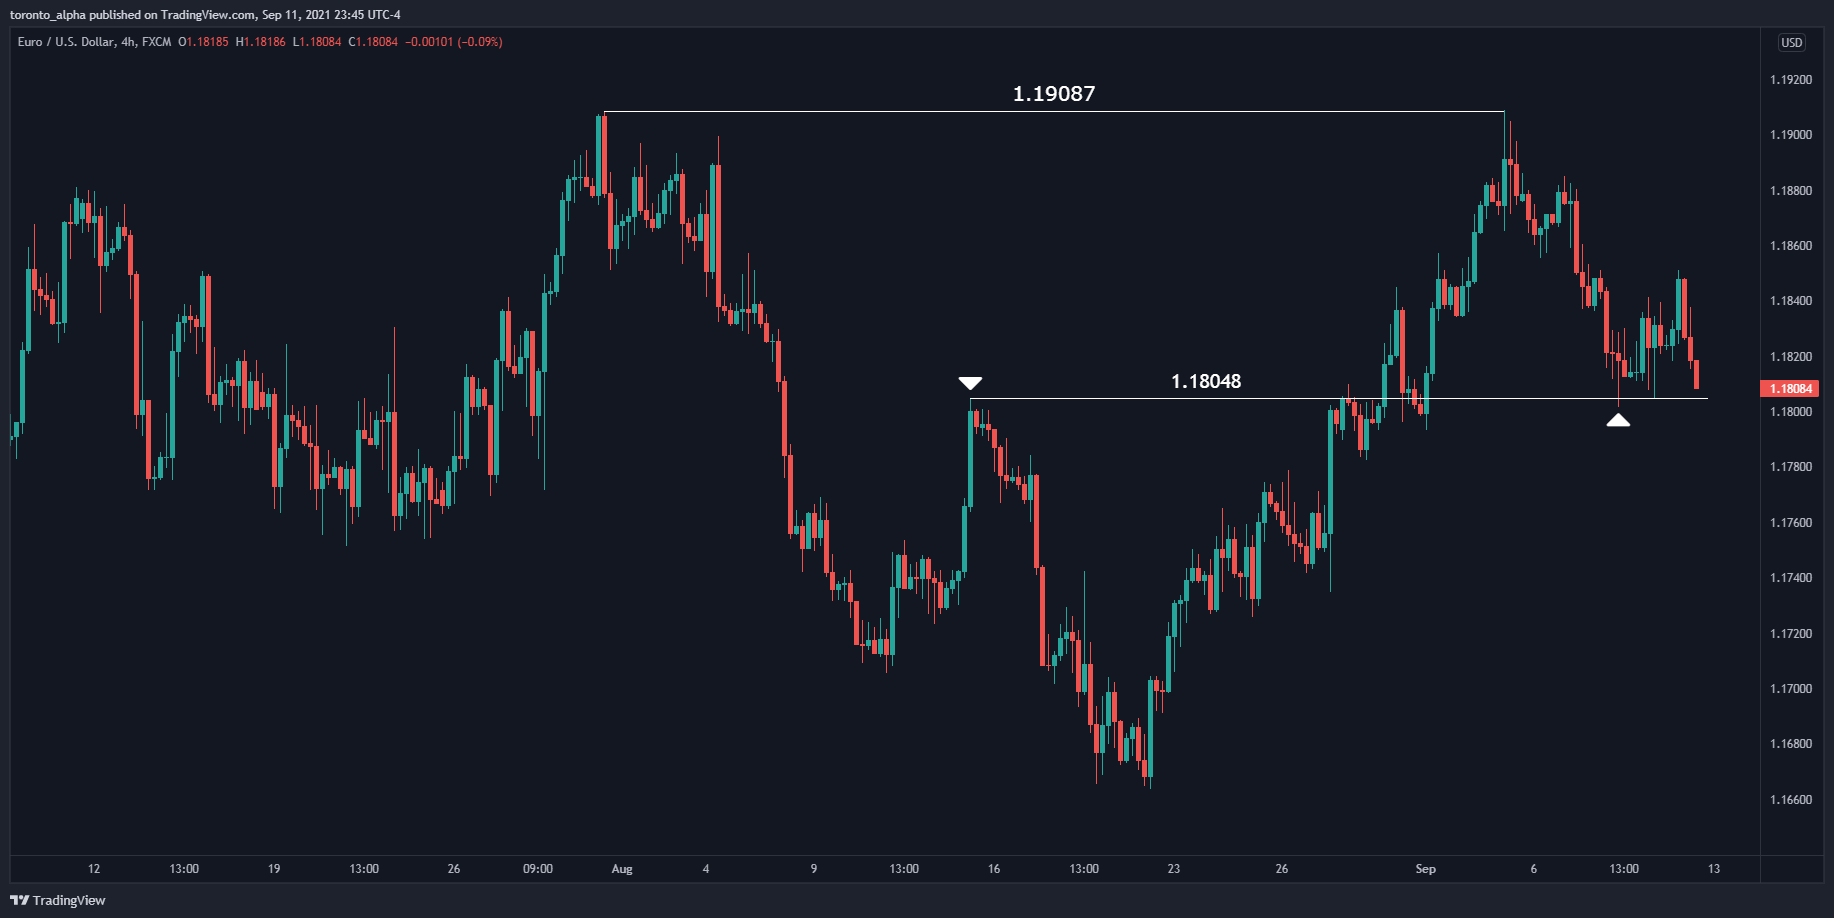
1.19087 has been a resistance on 30th July and 3rd September, making a double-top on those 2 dates (visible on the daily and 4-hour timeframes). This could act as a resistance and point to go short if the price goes back up there.
1.18048 was a resistance on 13th August (visible on 4-hour chart) and then became a support on 8th September. If the price breaks it as a support, it is a potential short-entry area, especially if it tests the level as a resistance again.
GBP/USD
Big Picture
I have a long-term bearish outlook.
The GBP/USD began an uptrend in March 2020, and it peaked in February 2021 when the price reached a previous resistance formed in early 2018, most easily visible on the weekly timeframe. The price made a double-top between February and May 2021.
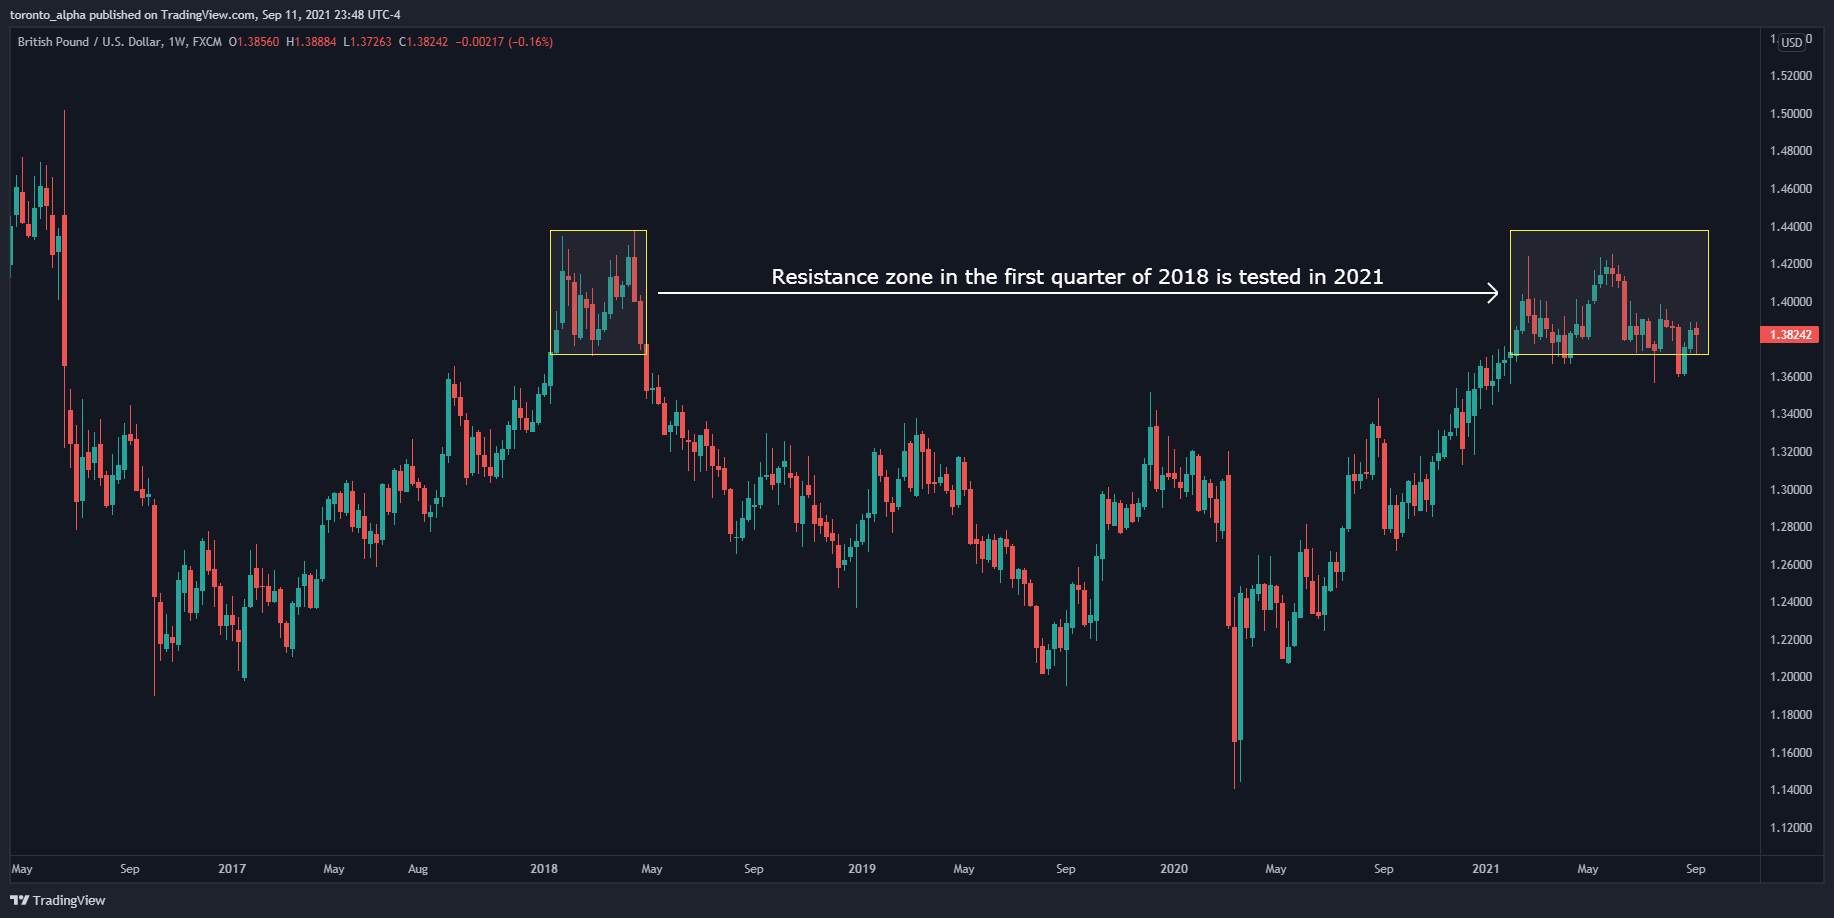
Key Levels
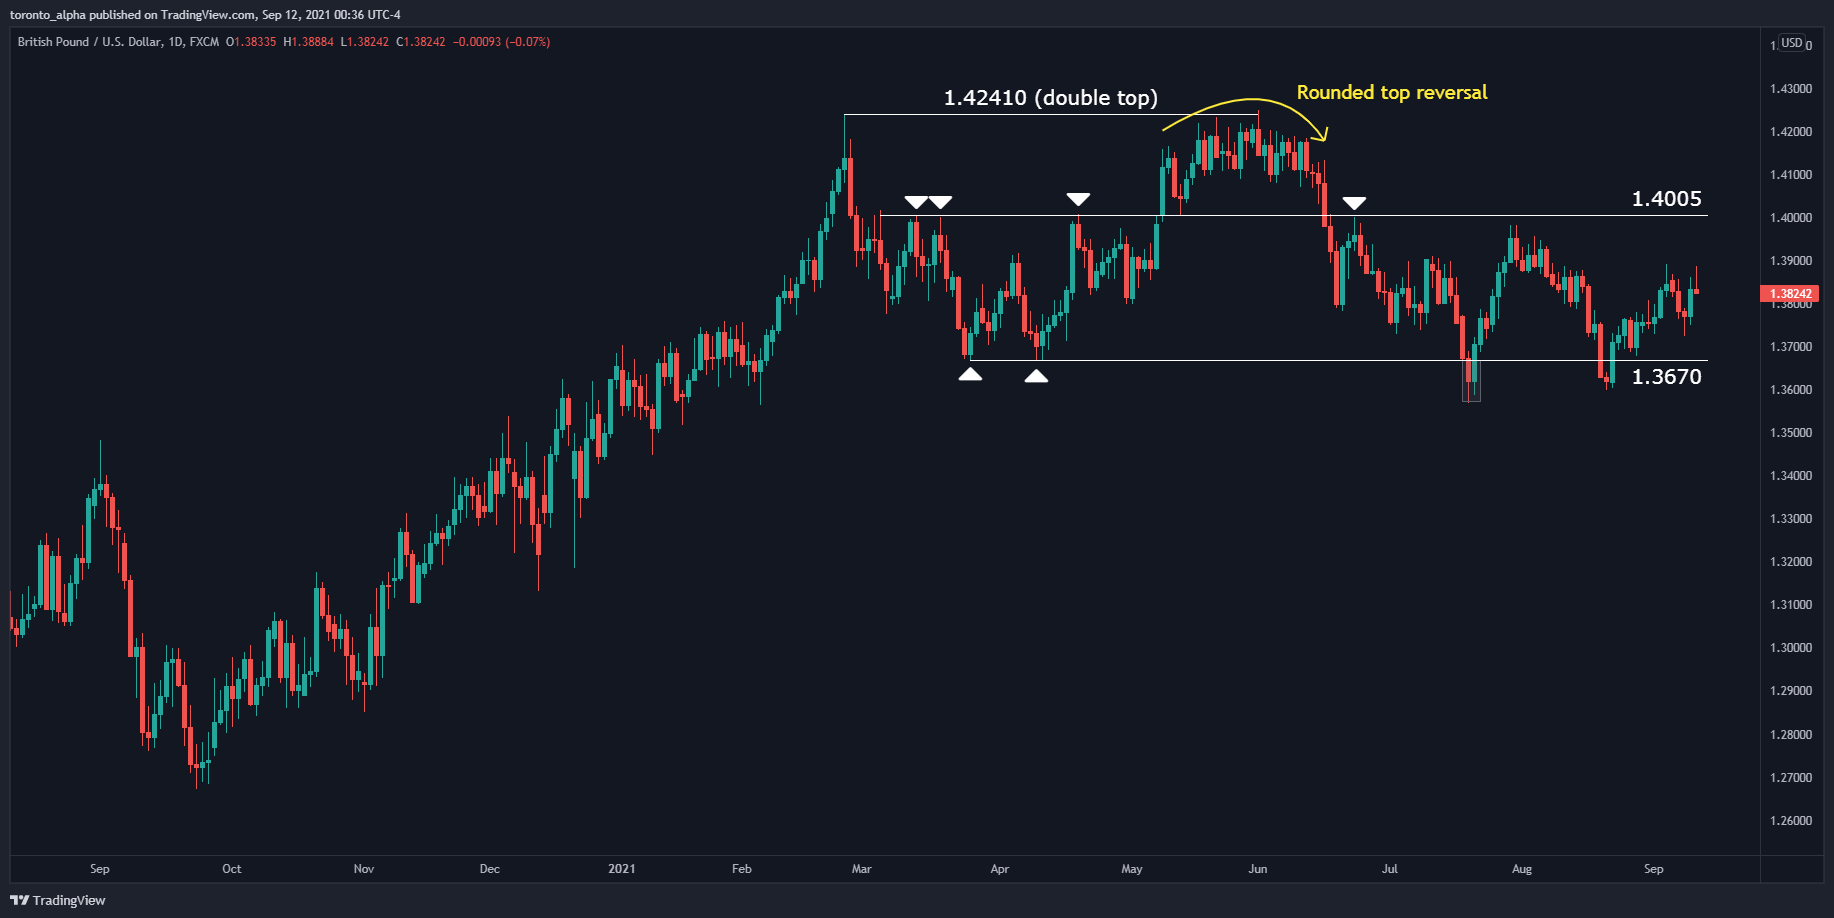
1.42410: The price made a double-top at this level between February and May 2021, visible on the daily chart. The second peak of the double-top was a rounded top formation that could present a strong resistance.
1.4005 has been a continuous resistance level in March 2021, and the price is trading below it. The level can also act as a short-entry opportunity.
1.3670 has been an area of support over 2021. It can be used as a price target if short GBP/USD, or as an area to enter if broken for a further potential downtrend.
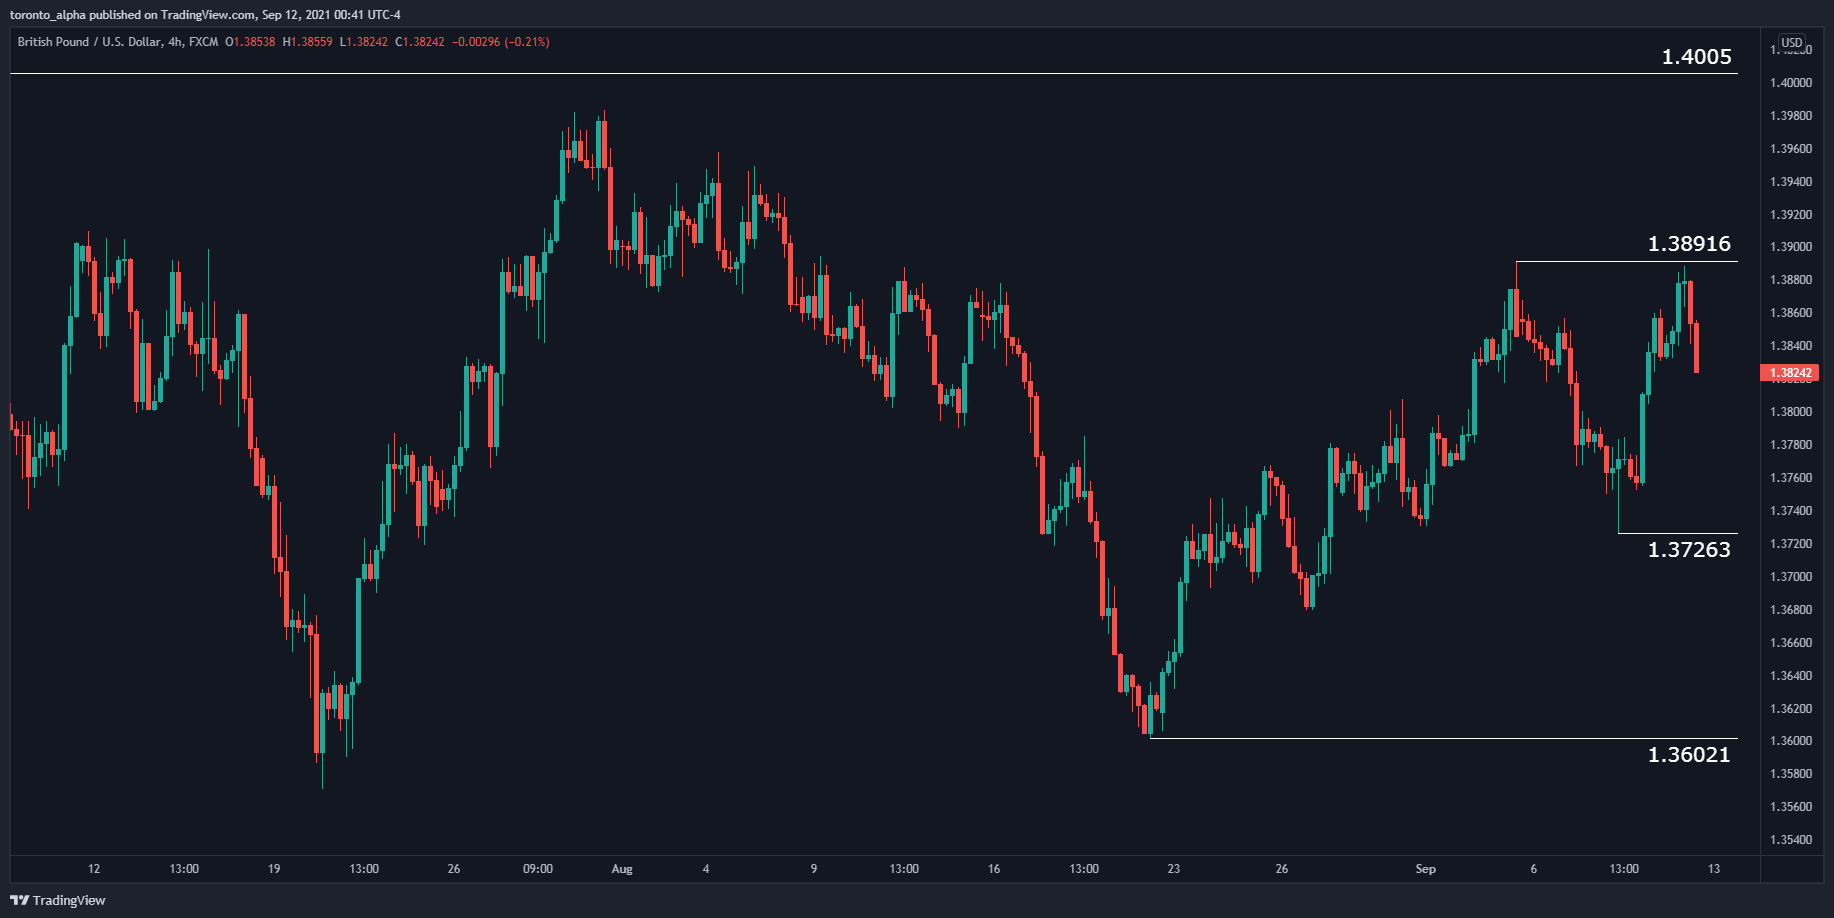
1.38916 has acted as a resistance on 3 & 10 September, creating a minor double-top visible on the 4-hour chart.
1.37263 and 1.36021 are near-term support levels that can be used as targets or entry areas for a longer-term down move.
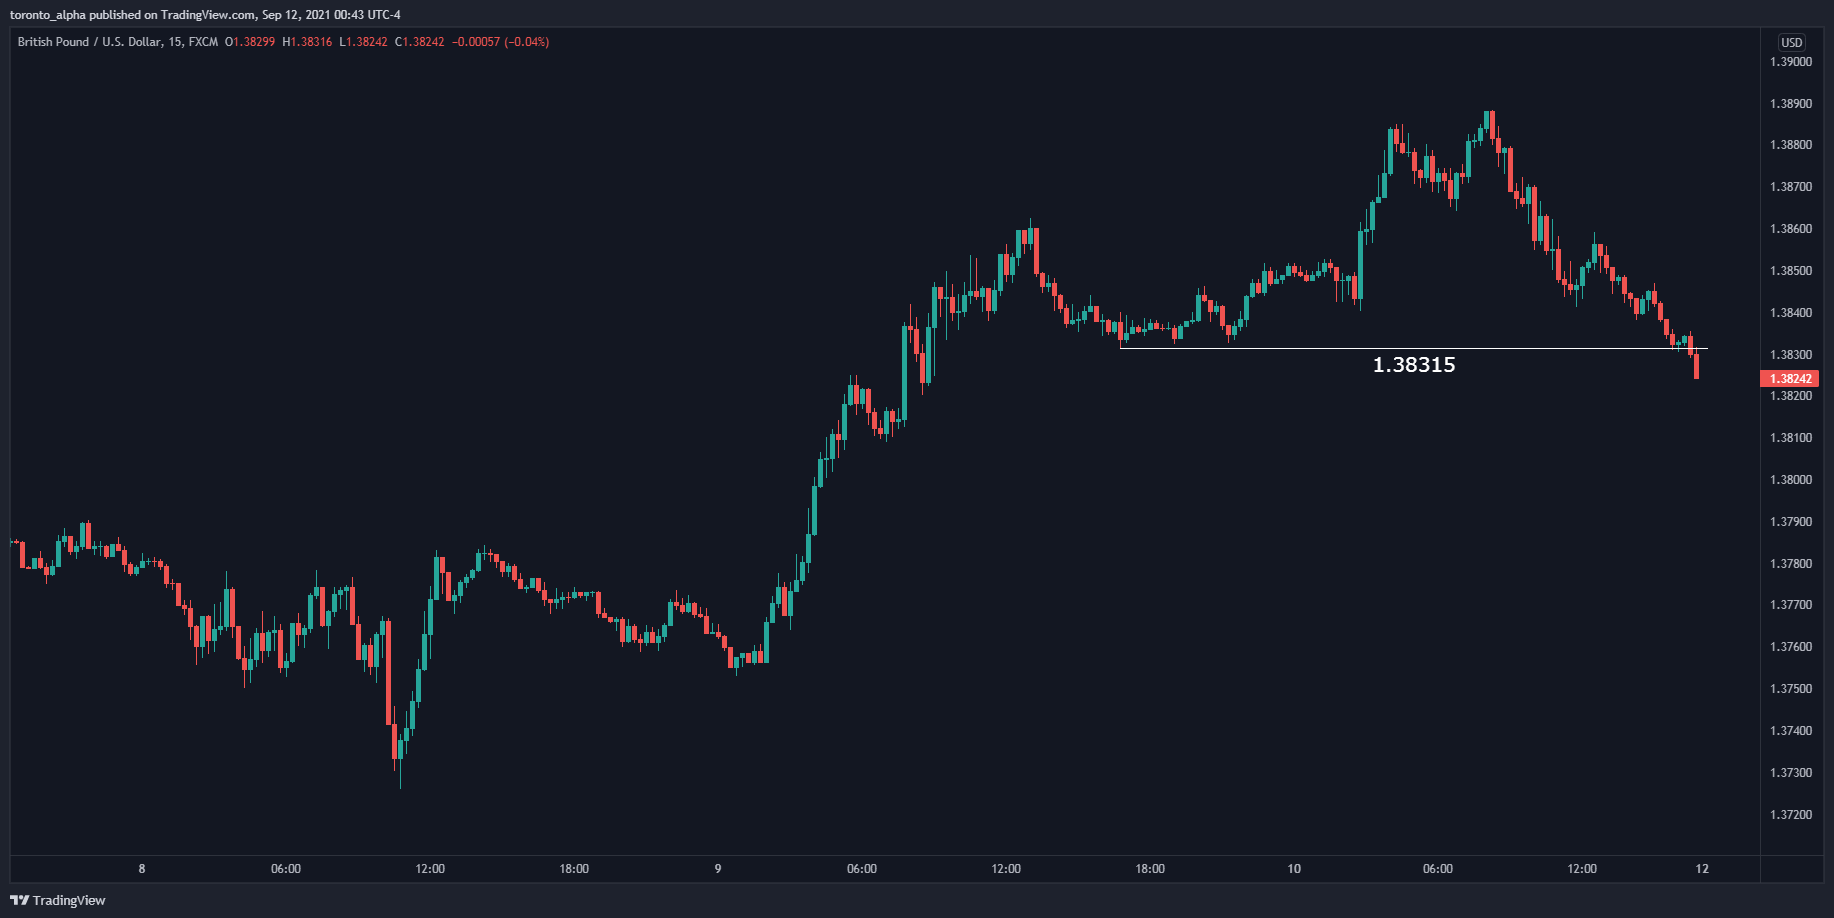
1.38315 is a small support on the 15-minute chart that, if retested as resistance, can be a short entry.
USD/CHF
Big Picture
I have a long-term bullish outlook.
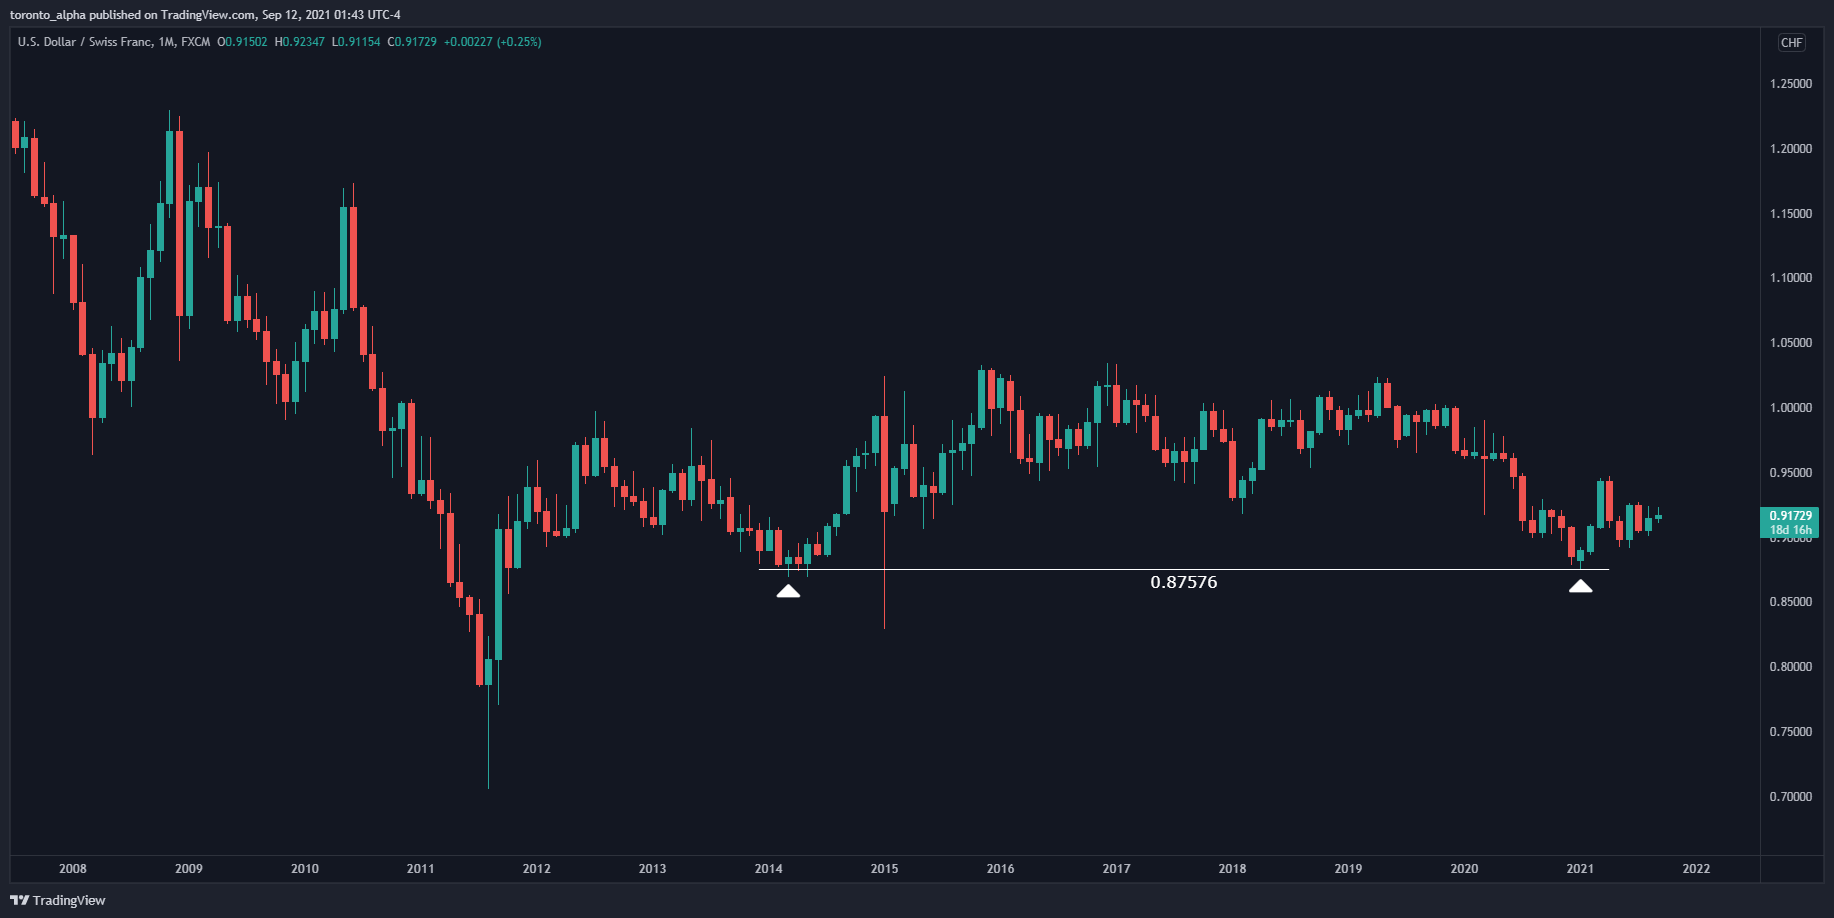
USD/CHF made a support at 0.87576 in January 2021, which lines up with a very long-term support area made in the first half of 2014.
Key Levels
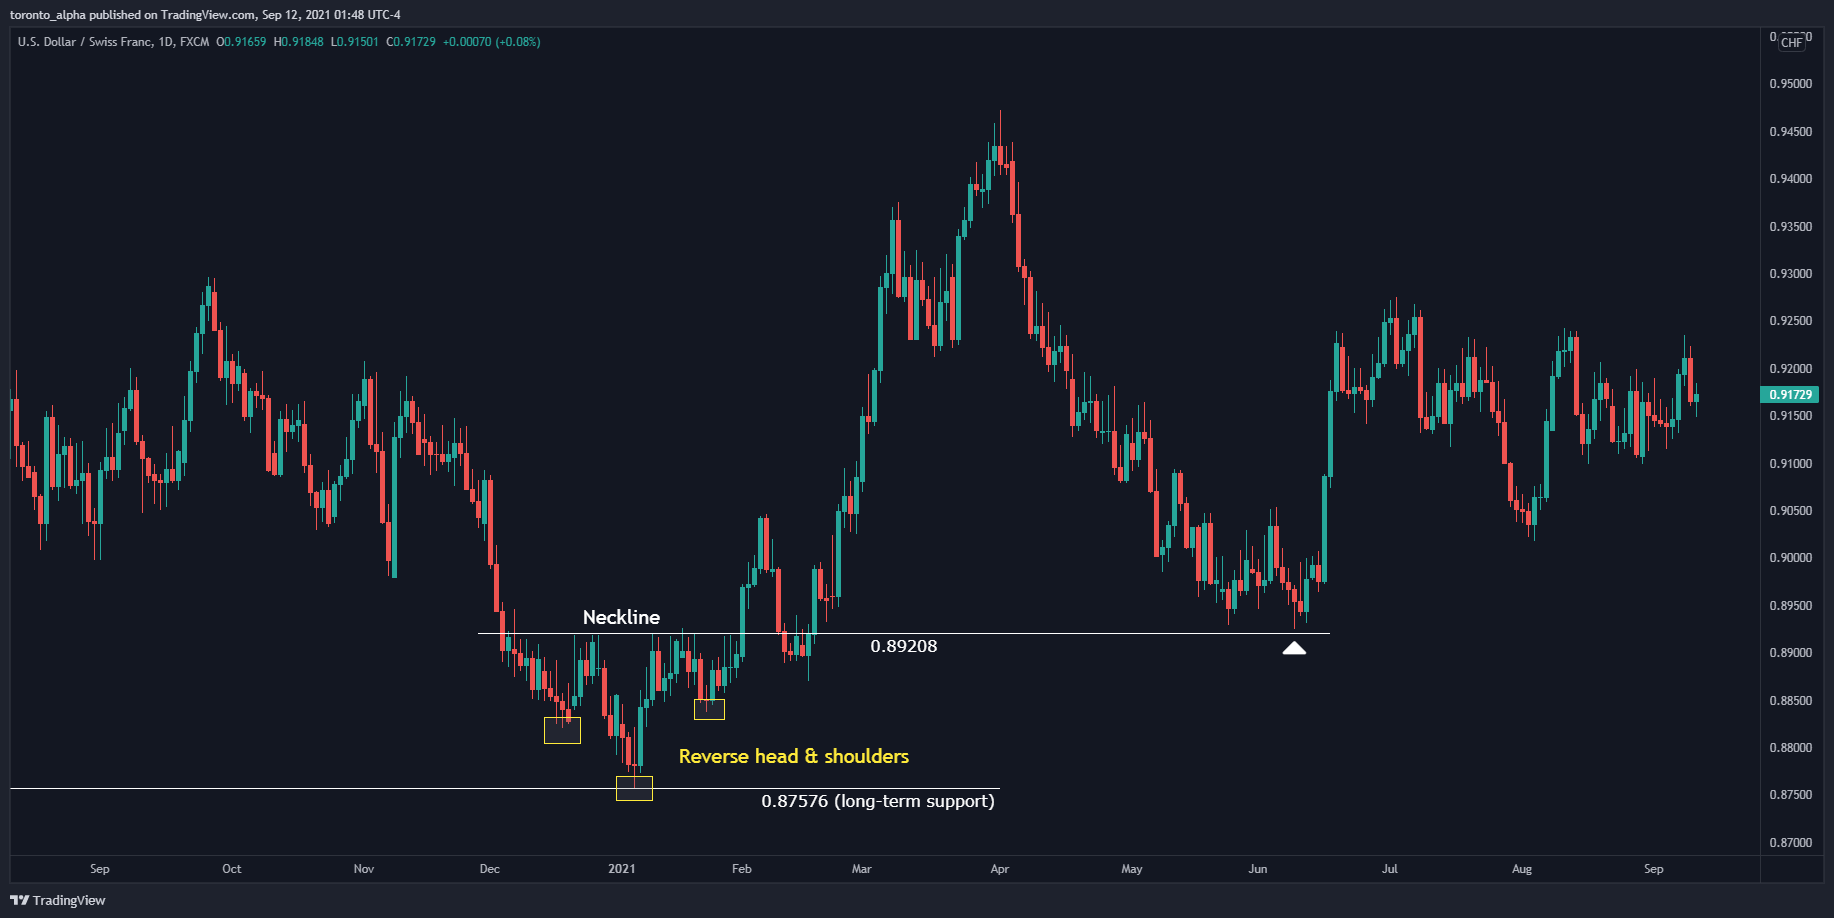
0.87576 was a key support in January 2021, where the price made a reverse head & shoulders reversal pattern.
0.89208 acted as the neckline of the head & shoulders reversal and was successfully re-tested as a support in June 2021, setting up our bullish bias for the pair.
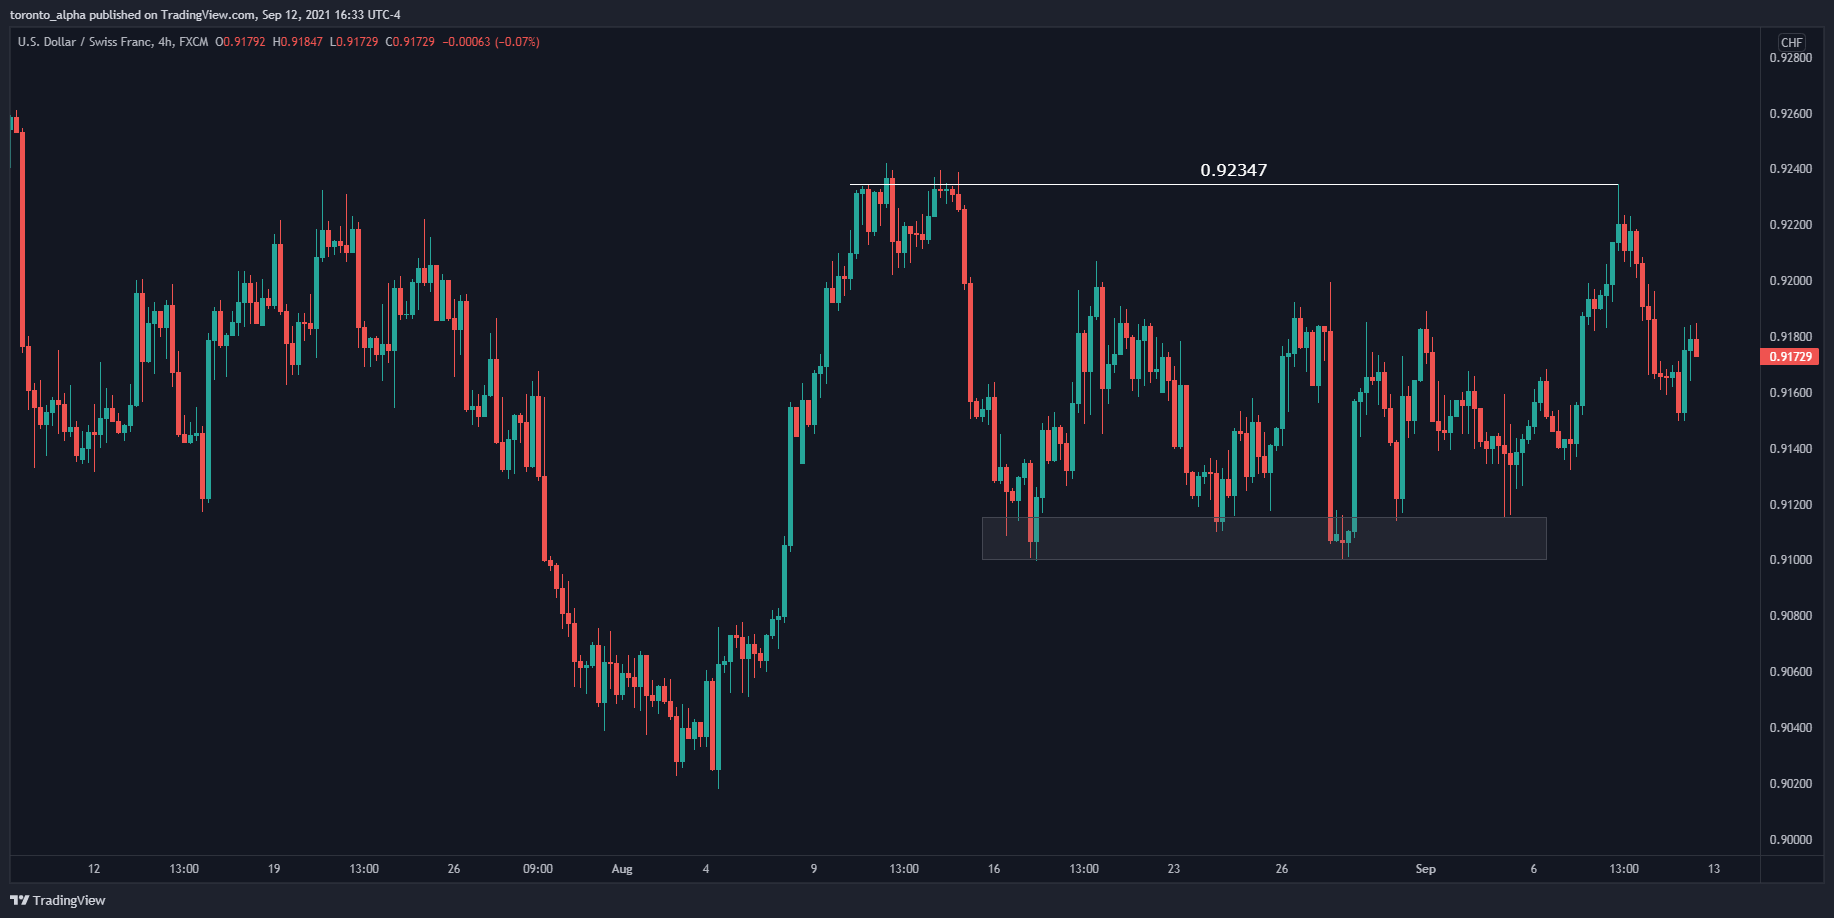
0.91000 has been a support zone since mid-August 2021.
0.92347 resistance must be broken if the pair continues to be bullish. If the level tested as a support after being broken, it could be a nice entry point.
USD/CAD
Big Picture
I have a long-term bullish outlook but in a short-term range.
USD/CAD made a support in September 2017 at 1.20613, and it bounced off that area again in May & June 2021, setting up our bullish outlook.
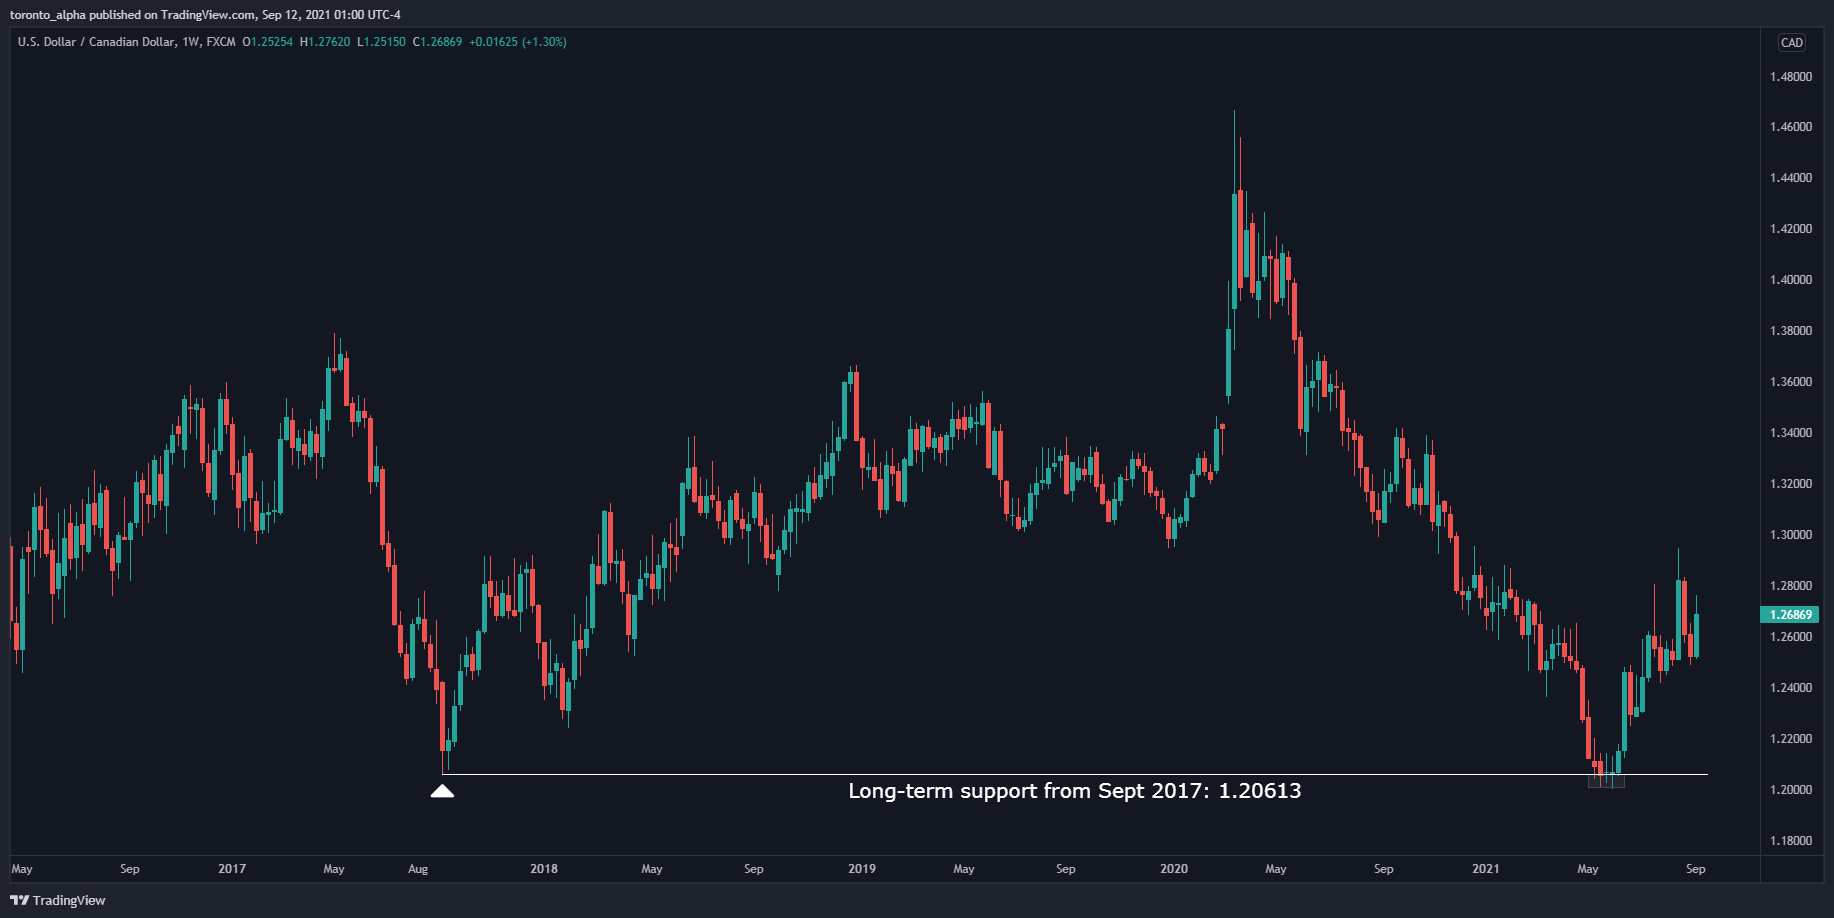
However, the uptrend after the bounce has become volatile.
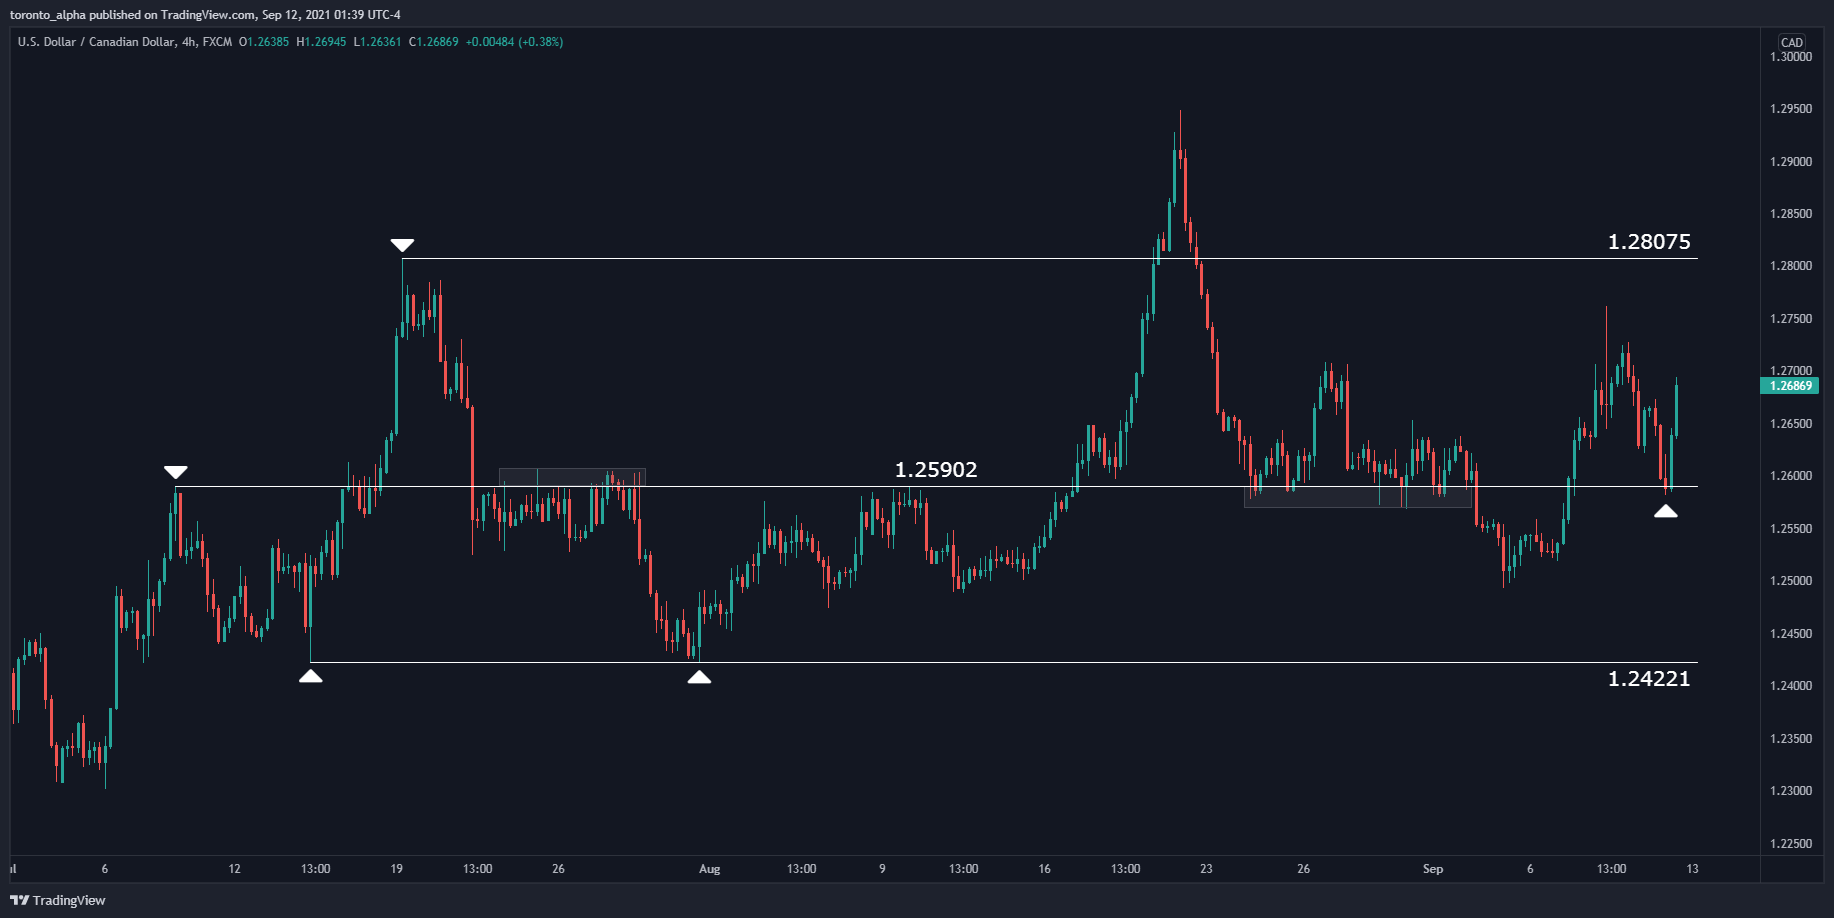
Key Levels

The price has been sideways for a few weeks but established several key levels: 1.24221 as support and 1.28075 as resistance. Within that range, 1.25902 has been an interchangeable support & resistance level. It reacted very bullishly against it on 10th September, confirming our bullish bias.
AUD/USD
Big Picture
I have a long-term bearish outlook.
From March 2020, the AUD/USD was in a strong uptrend until it made a high in February 2021, near a resistance that it made In September 2017 and January 2018, at 0.81358.AUD chart 01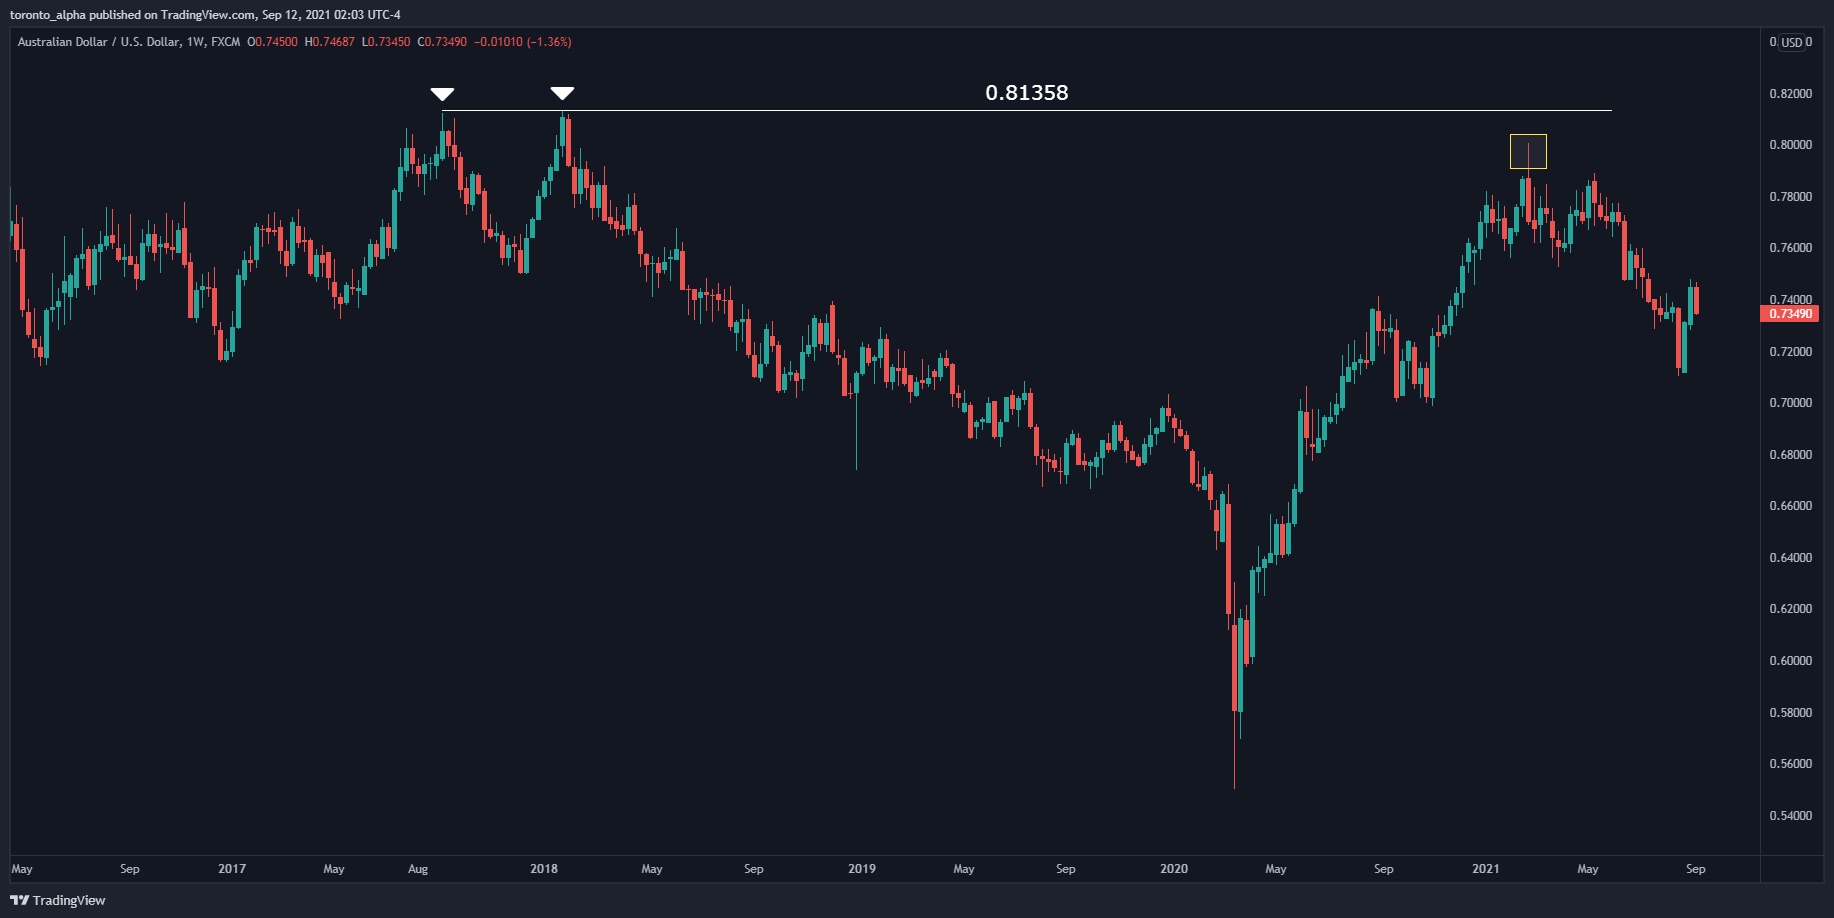
Key Levels
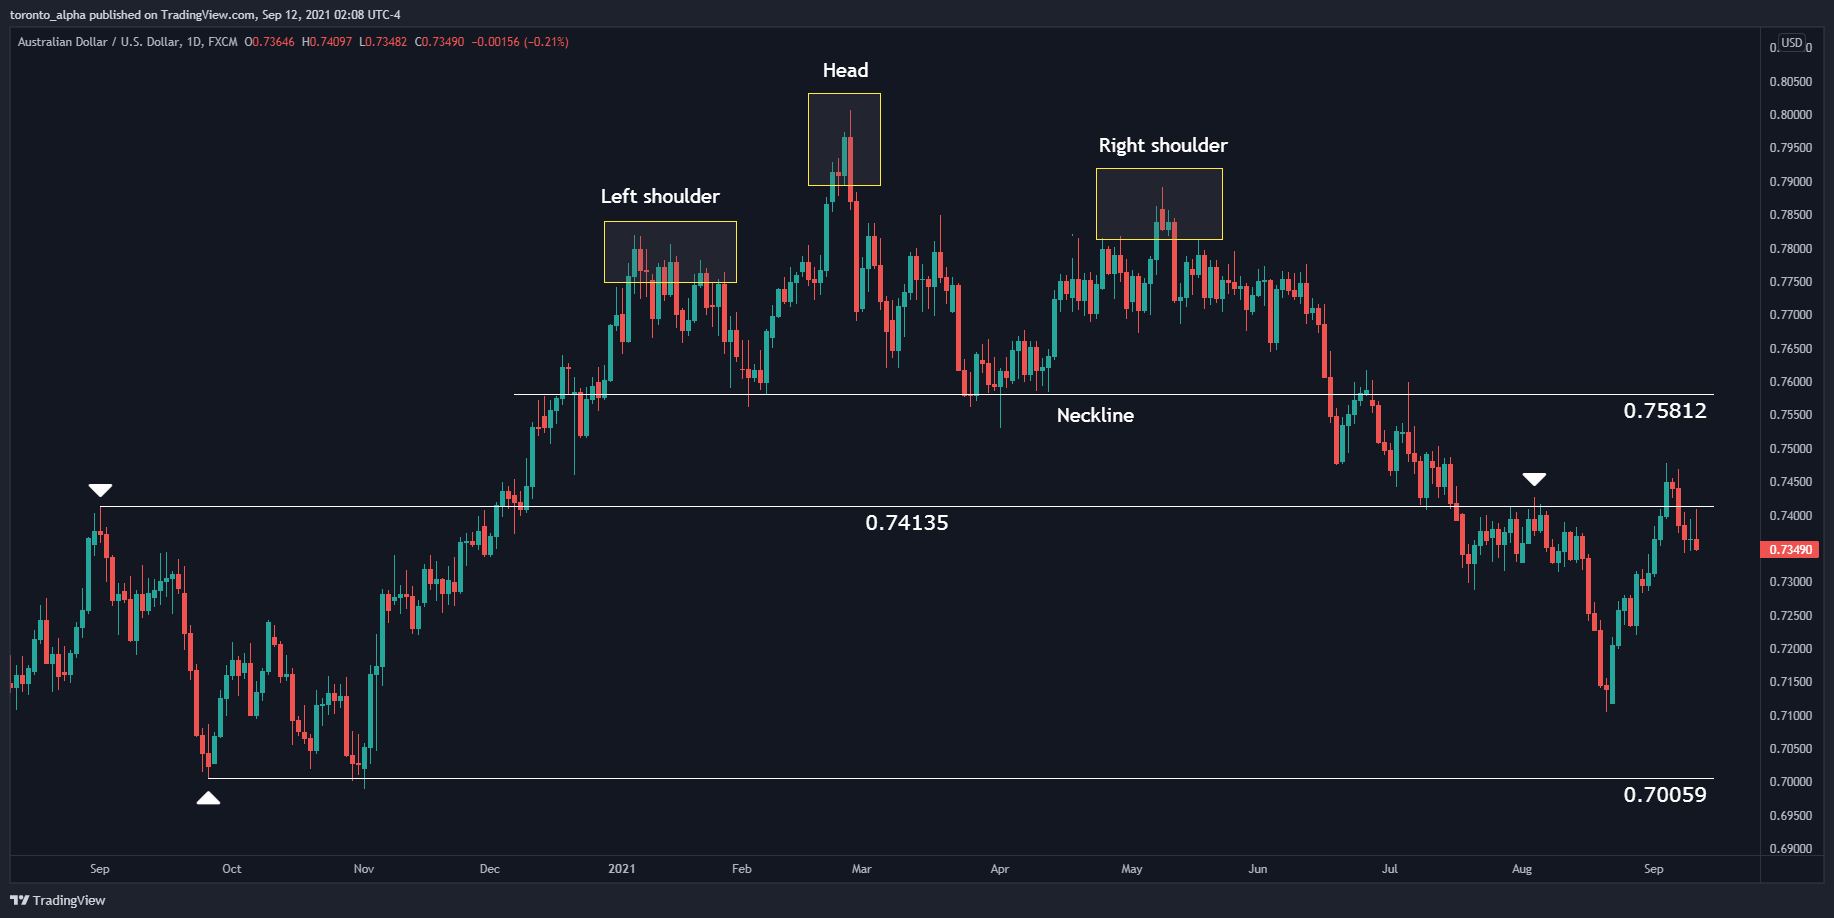
0.75812 was the neckline of the head & shoulders reversal made between January and June 2021. Our outlook will remain bearish if the price remains below this level.
0.74135 is a resistance first established in September 2020 and tested multiple times.
0.70059 is the next key support from the current price.
NZD/USD
Big Picture
I have a long-term bearish outlook.
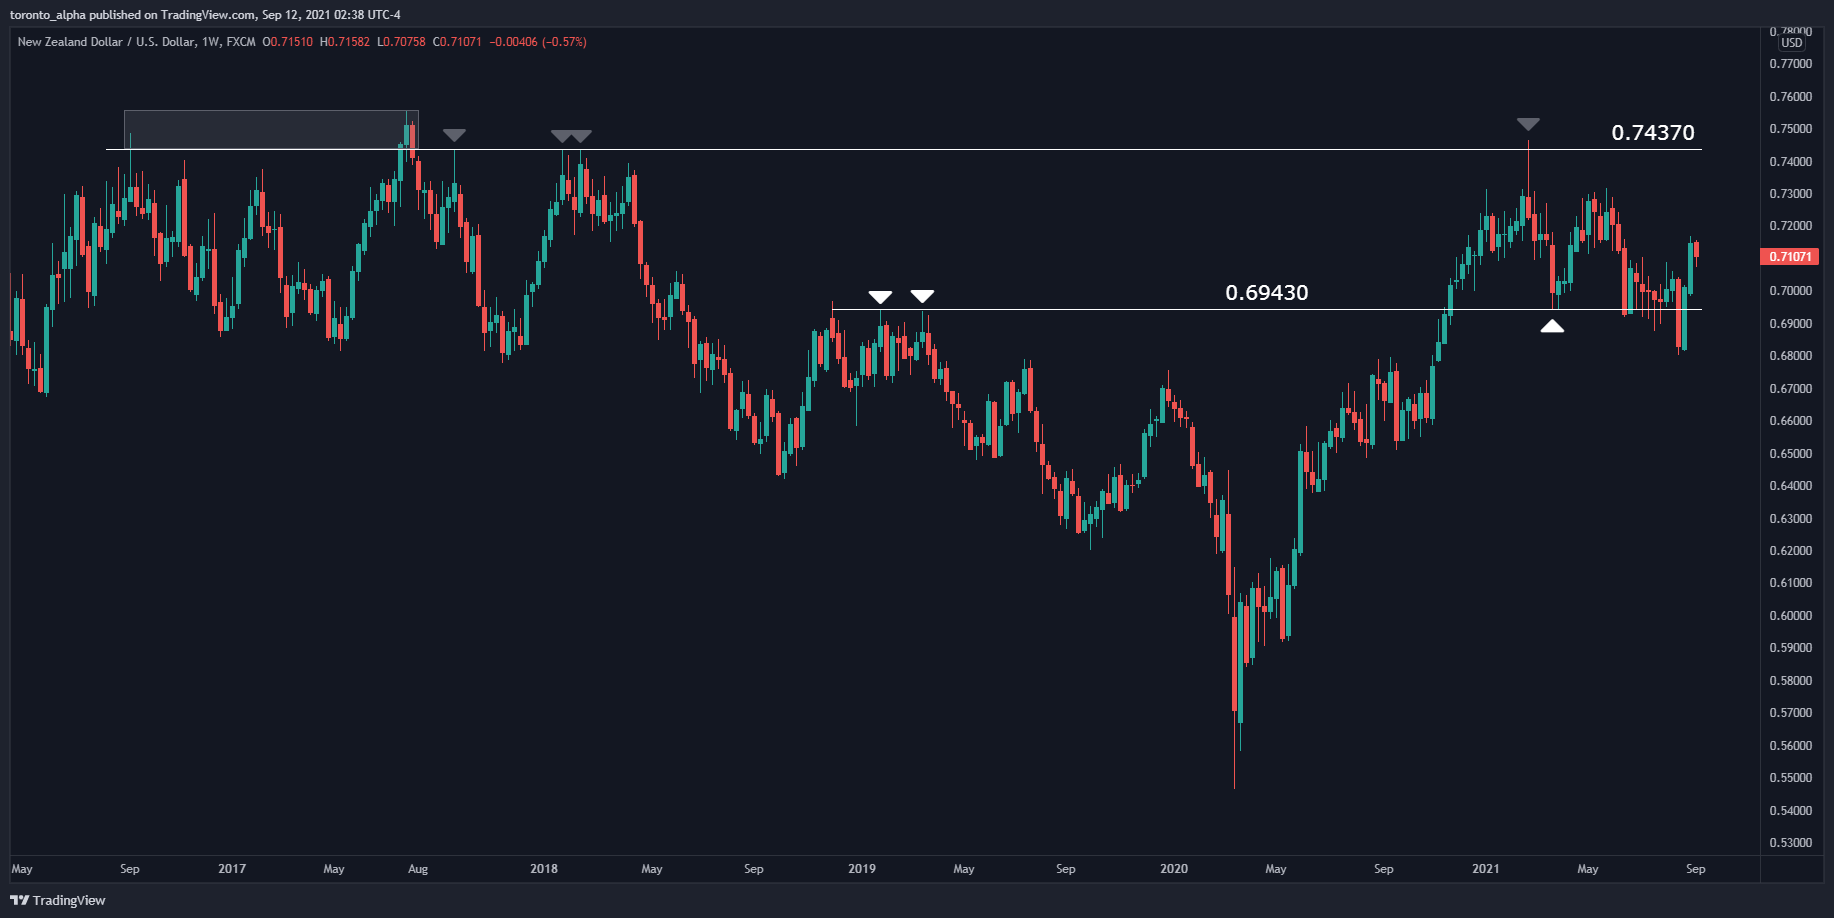
From March 2020, the NZD/USD was in a strong uptrend until it made a high in February 2021, at a resistance level touched multiple times in 2017 & 2018.
Key Levels
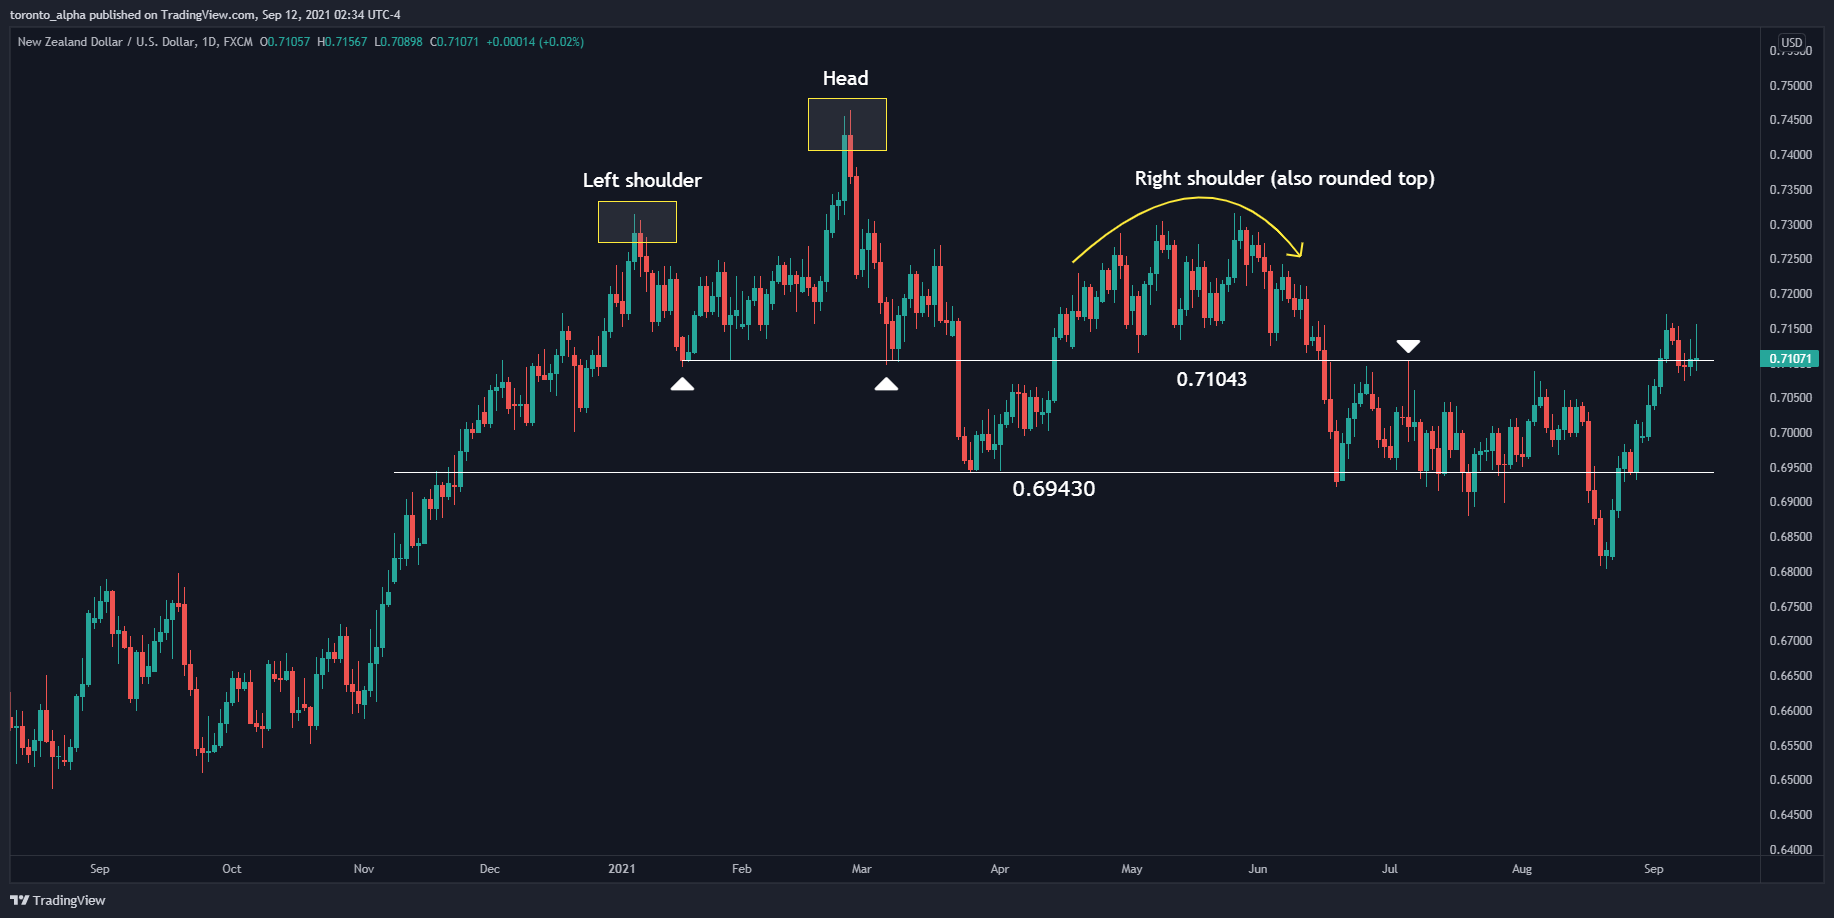
0.71043 was the neckline of the head & shoulders reversal made between January and June 2021. Our outlook will remain bearish if the price remains below this level.
0.69430 has been a support level in March 2021 that it must break again if the price is to have a sustained downtrend.
