Bearish View
- Sell the EUR/USD pair and set a take-profit at 1.0400.
- Add a stop-loss at 1.0700.
- Timeline: 1-2 days.
Bullish View
- Buy the EUR/USD pair and set a take-profit at 1.0700.
- Add a stop-loss at 1.0400.
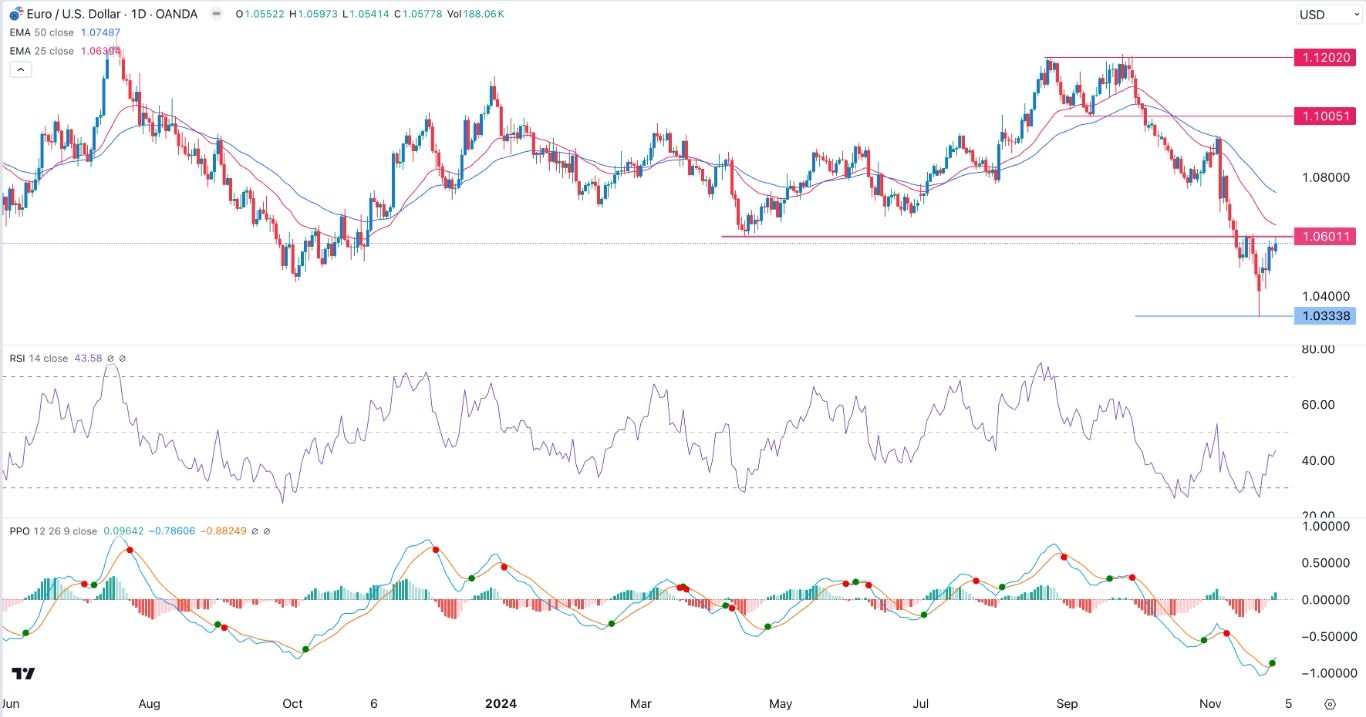
The EUR/USD exchange rate continued rebounding after the relatively strong flash European inflation numbers. The pair bounced back to a high of 1.0595, its highest level since November 20, up by 2.35% from its lowest point last month.
Top Forex Brokers
Key Economic Data Ahead
The EUR/USD pair rose after a report by Eurostat showed that the bloc’s inflation bounced back in November. The headline CPI rose from 2.0% in October to 2.3% in November, in line with estimates.
Core CPI, which excludes the volatile food and energy prices, remained at 2.7% in November, higher than the ECB’s target at 2.0%.
In Italy, the headline CPI rose from 0.9% to 1.4%, while the harmonized inflation rose from 1.0% to 1.6%. The French inflation rate also remained above the bank’s target of 2.0%.
Meanwhile, in Germany, the country’s retail sales retreated by 1.5% in October after growing by 1.6% in the previous month. Its unemployment rate remained at 6.1% during the month.
These numbers mean that the European Central Bank (ECB) may decide to hold interest rates steady in its next meeting on October 12. It has slashed rates by 0.75% this year, and analysts expect it to cut several times in 2025.
The next key EUR/USD news to watch will be the upcoming manufacturing PMI numbers from Europe and the United States. Economists expect the US ISM manufacturing PMI to move from 54.8 to 55.2 in November. The S&P Global PMI is expected to rise from 48.5 to 48.8.
The most important data to watch will be the upcoming US jobs numbers scheduled on Friday. These numbers will help to determine whether the Fed will cut rates in the next meeting.
EUR/USD Technical Analysis
The daily chart shows that The EUR/USD exchange rate has been in a strong bearish trend after forming a double-top pattern at 1.1200. The pair has remained below the 50-day and 25-day Exponential Moving Averages (EMA).
It formed a hammer pattern whose lower side is at 1.0333. This hammer is made up of a small body and a longer lower shadow. It has also retested the important resistance point at 1.0600, the lowest swing in April 2024.
The Relative Strength Index (RSI) and the Percentage Price Oscillator (PPO) have all pointed upwards. Therefore, after forming a break-and-retest pattern, there is a likelihood that it may resume the downtrend, and possibly retest the support at 1.0400.
Ready to trade our free daily Forex trading signals? We’ve shortlisted the best forex brokers in Europe to check out.


