Forex is possibly the most multifaceted asset class there is. To survive and thrive as a currency trader, it is essential to understand currency market dynamics. One key dynamic is currency correlation: even though there are over 72 different currency pairs to trade, many of these pairs move in a similar way – they are correlated to some degree.
But also, there are instruments from other asset classes that influence currency movements and as such are also correlated with currency movement. By studying prevailing Forex correlations, you will be in a much better position to identify intermarket moves, manage risk and effectively become a better trader.
Top Forex Brokers
Correlations in Foreign Exchange
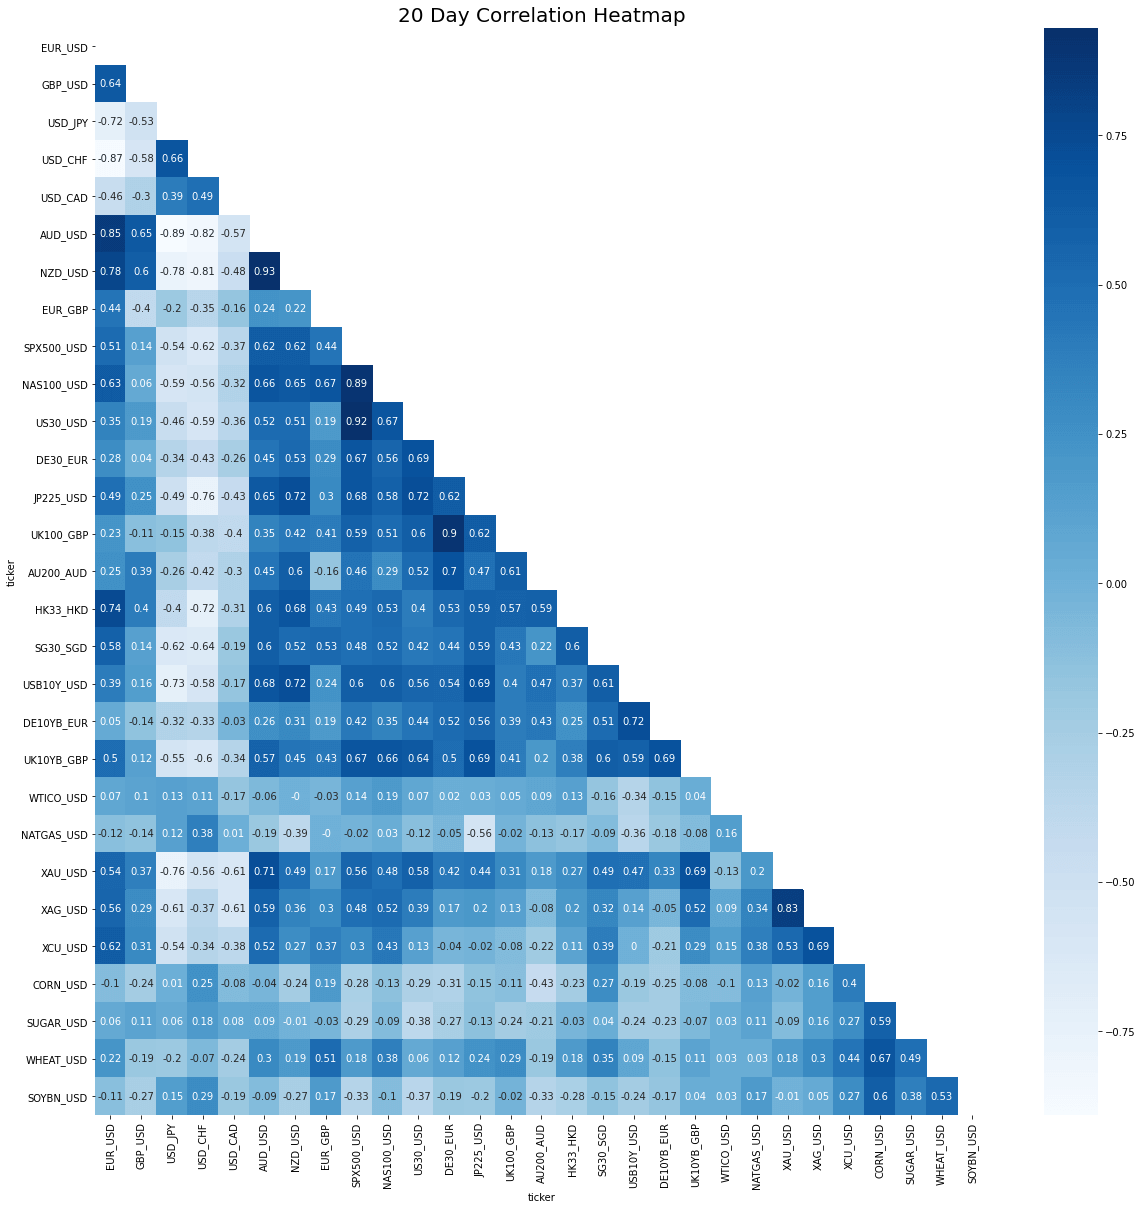
A Typical Intermarket Correlation Heatmap
You do not need to be a mathematician to understand Forex currency correlations in practical terms. Correlation is a robust statistical measure that helps describe how the movements in one currency pair mirror the movements in another currency pair.
 Correlation Illustration
If two currency pairs move in the same direction most of the time, there will be a direct correlation (with a number somewhere between 0 and 1). If two currency pairs move in opposite directions, there will be an inverse correlation (with a number somewhere between -1 and 0). Strong correlations usually have a number below -0.70 (strong inverse correlation) or above 0.70 (Strong positive correlation).
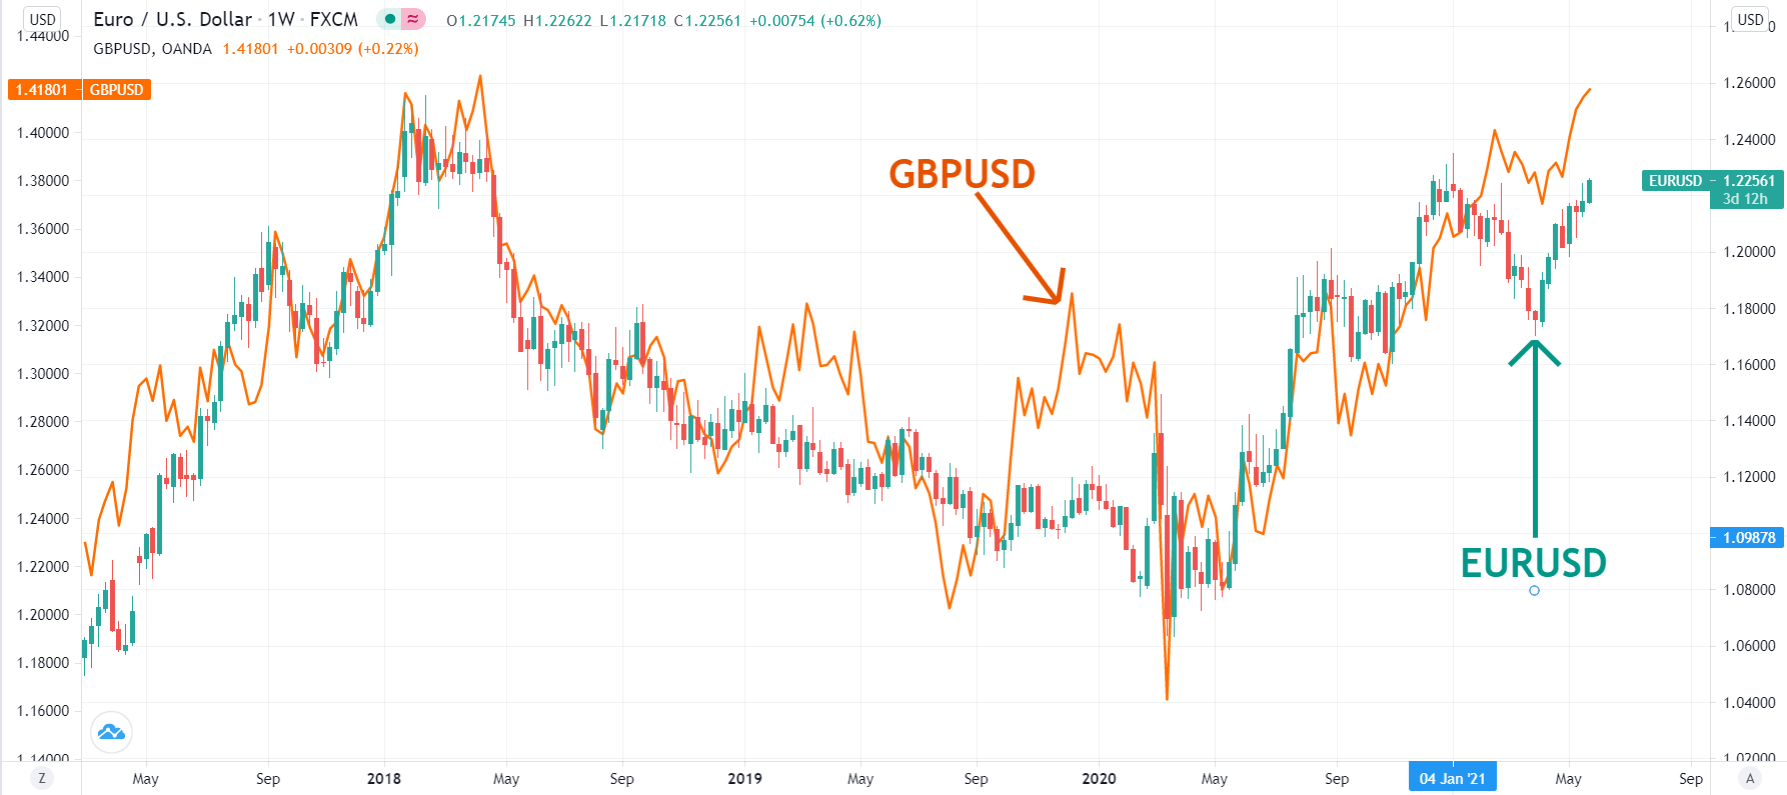
EUR/USD vs GBP/USD
The chart above visually describes the strong currency pair correlation between EUR/USD and GBP/USD. The main reason these two currency pairs tend to move in the same direction most of the time is due to the common denominator: the US dollar.
More generally, US dollar movements tend to link together all major pairs (EUR/USD, GBP/USD, AUD/USD, NZD/USD, USD/CAD, USD/JPY, USD/CHF). For example, the reason why USD/JPY and EUR/USD generally move in opposite directions is simply due to the US dollar factor.
How to Use Correlations in Forex Trading
Knowledge of Forex correlations is most helpful to one area of trading: risk management. By using any standard historical correlation table, you can check whether you are trading correlated pairs. Imagine opening a long position on EUR/USD, AUD/USD, and GBP/USD. You may feel like you are “diversifying” while really have tripled your USD exposure. It is almost like having used 300% leverage on the same trade.

A Typical Forex Correlation Heatmap (Source: MyFxBook.com)
So, for example, if you are trading a long GBP/USD position, instead of going long GBP/JPY or EUR/USD, perhaps it would be easier to target something like AUD/CAD or AUD/CHF which have a strong negative correlation with Cable (GBP/USD).
Yet we could say the same thing about having simultaneous positions in Crude Oil and CAD/JPY; having positions in AUD/JPY and the Dow, S&P500 or ASX; having positions in USD/NOK and USD/SEK.
One caveat to keep in mind is that Forex correlations are not stable over time. Correlations strengthen and weaken intermittently, even if the general tendency remains intact. For example, in the chart below we see a recent instance where EUR/USD and GBP/USD flipped to a weak inverse correlation during 2021. The key is to understand why certain instruments tend to move in tandem, so you will always be able to pick the right instruments to hold in your portfolio, instead of involuntarily adding exposure to the same trade.
Intermarket Correlations
Market sentiment drives trends in Forex, but intermarket correlations can help you to stay abreast of the current day-to-day drivers of prices. Correlations can help you:
- identify day-to-day influences,
- identify relative or absolute strength of a move,
- stay clear of risk events that might impact a similar trade,
- explain movements that might trap other traders.
Yield Spreads vs Currency Movements
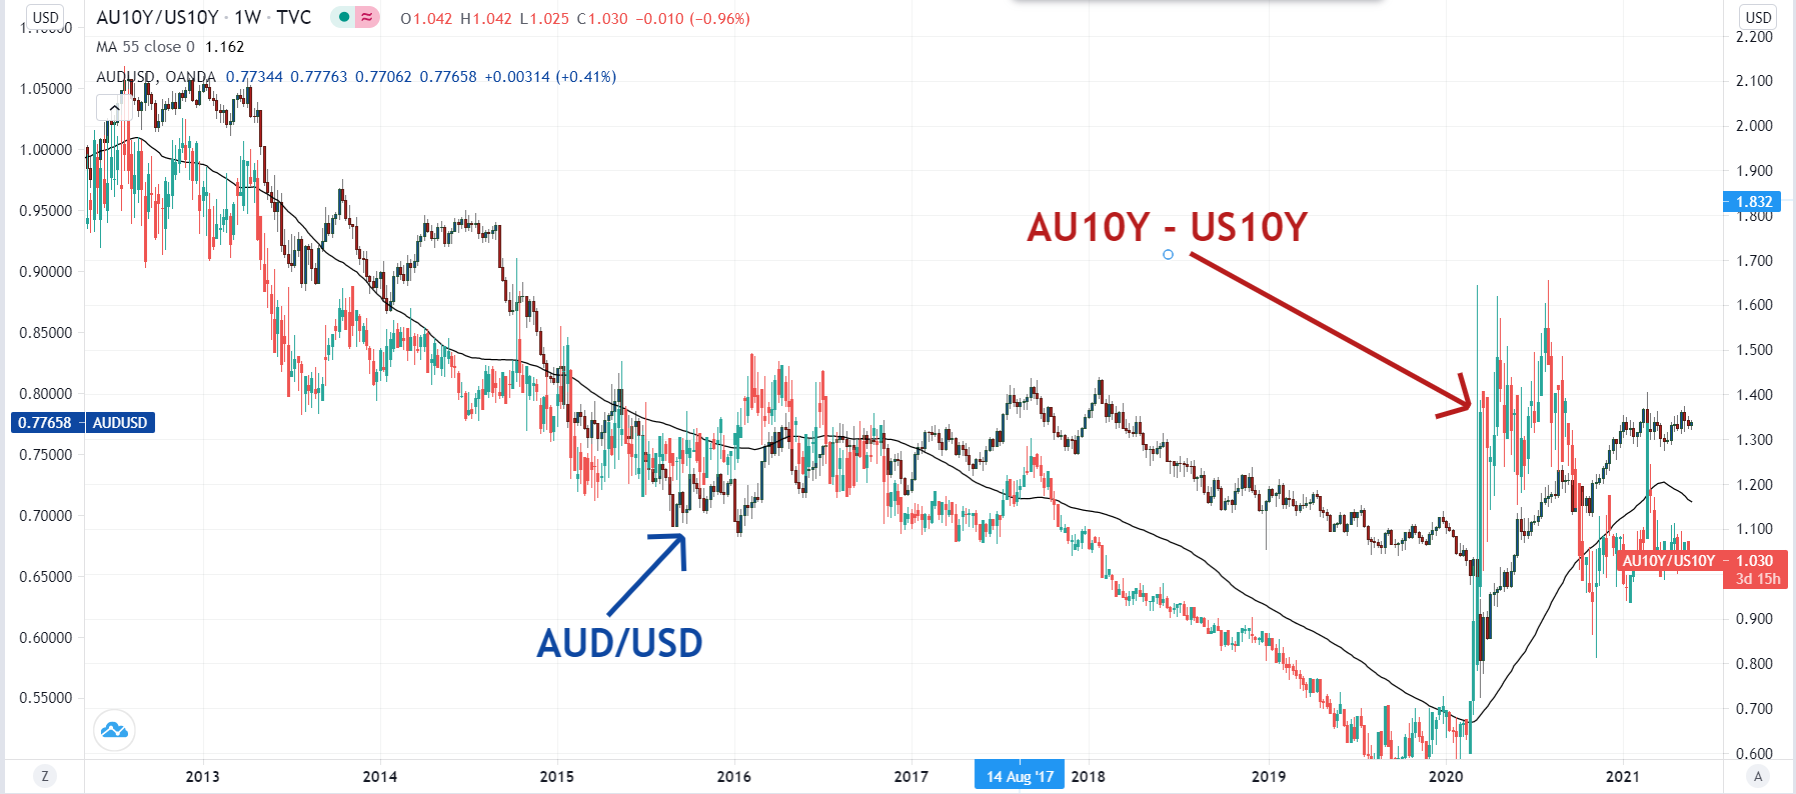
AU 10-Year Yield vs US 10-Year Yield vs AUD/USD
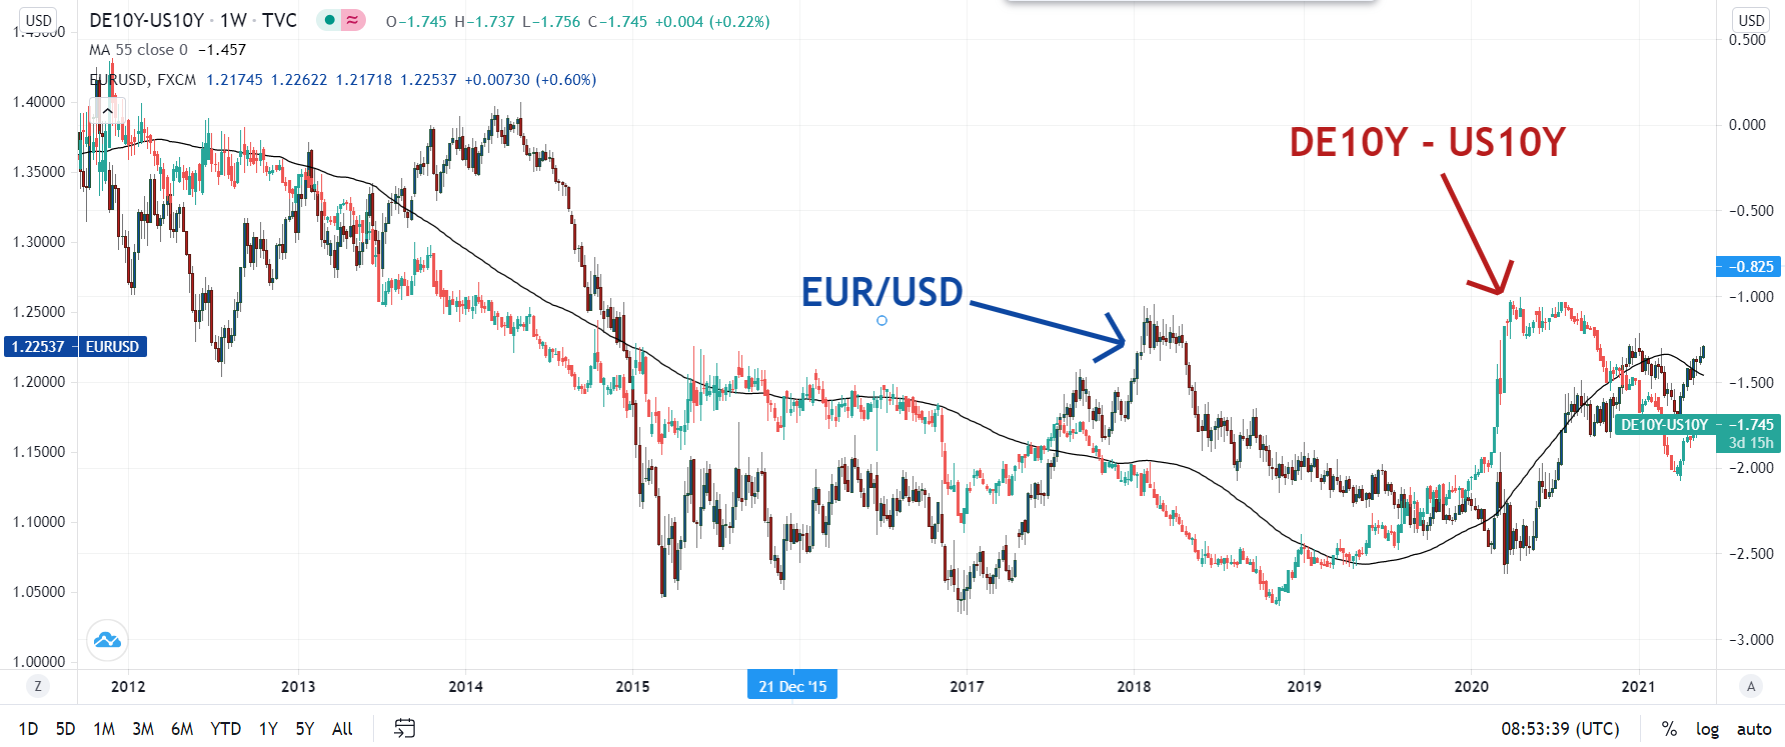
DE 10-Year Yield vs US 10-Year Yield vs EUR/USD
Why does the FX market care about the bond market? Investors are yield hunters – especially in a zero-interest rate environment. So, when monetary policies start to diverge, and the yield spreads start to widen, traders and investors alike start to invest in higher yielding securities – and therefore the demand for the currency rises.
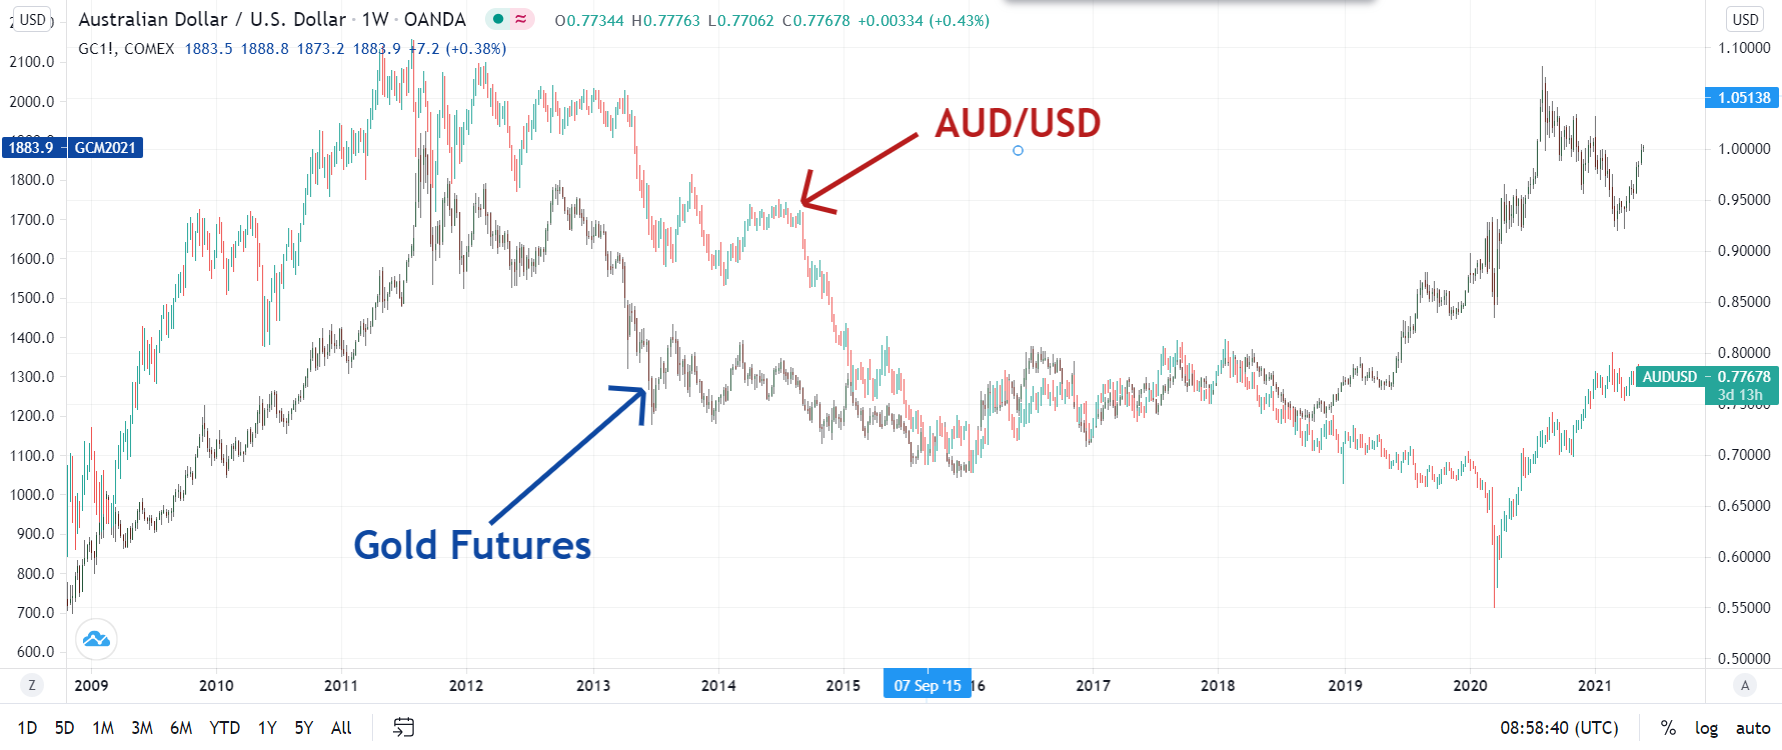
“Comm-Dolls” vs Commodities: Gold vs AUD/USD
AUD/USD vs XAU/USD: Strong Positive Correlation
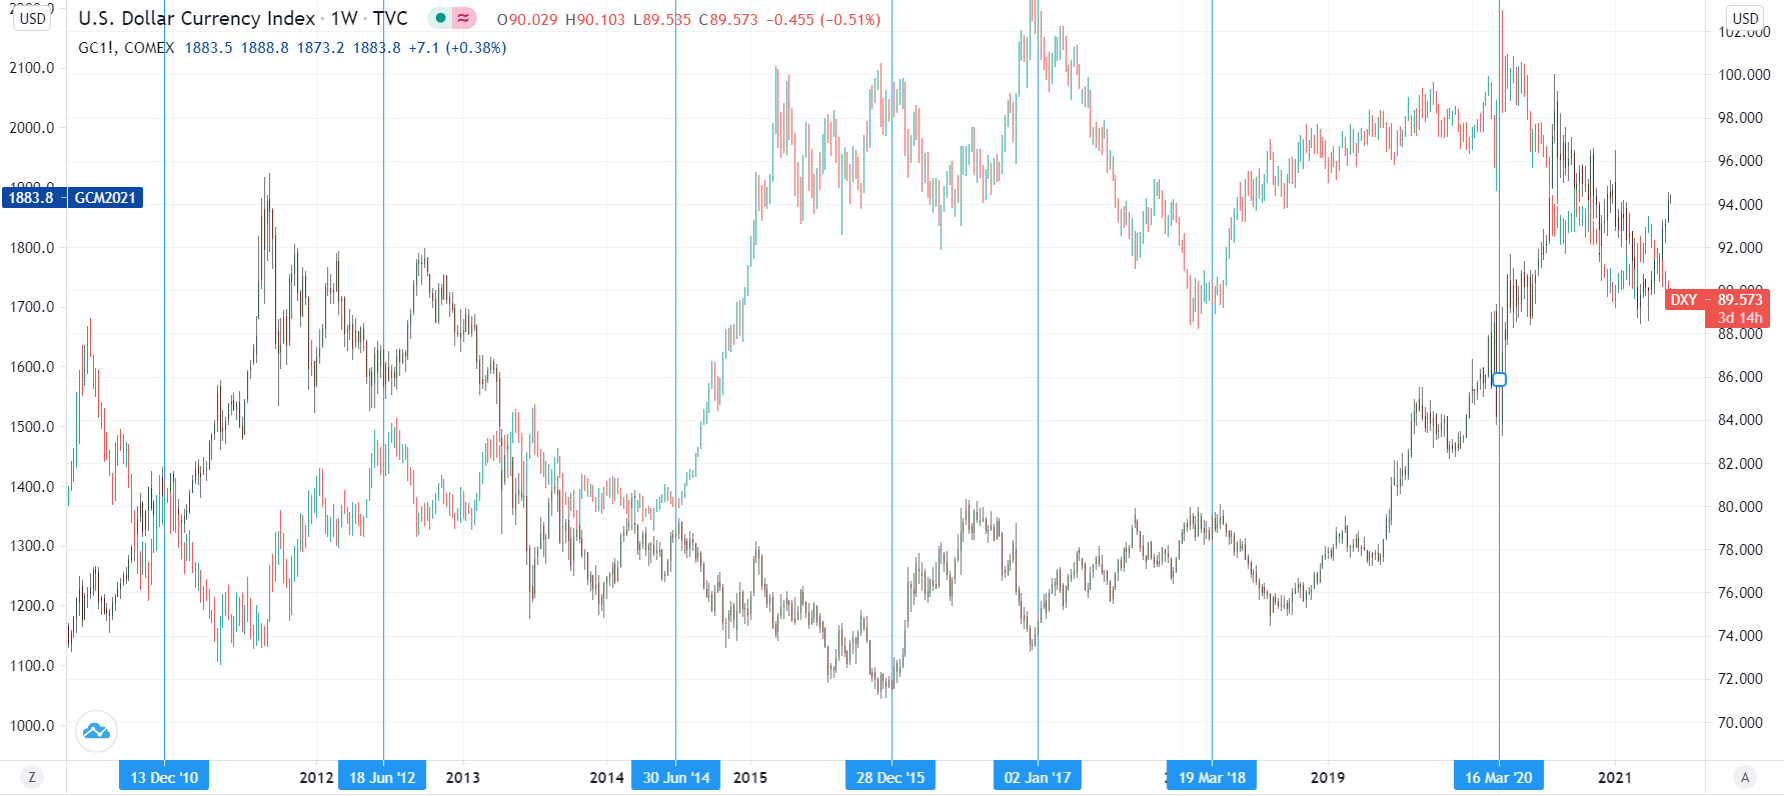
Australia, responsible for producing around 80% of the world’s gold supply, presents a significant opportunity, especially during times of economic unrest. For those wondering when it's time to trade gold, consider periods like 2021, when inflation expectations were rising rapidly. In such scenarios, savvy investors often shift their focus from the greenback and risky assets to Gold. This is because Gold serves as a robust hedge against inflation, protecting against the erosion of purchasing power in fiat currencies. Meanwhile, the US dollar is a sought-after safe-haven during geopolitical turmoil or typical risk-off scenarios, as investors move towards liquidating stocks and other assets in favor of “cash”. Understanding the dynamic correlation between Gold and the US Dollar is crucial, as they are both “defensive” (safe haven) instruments.
For insights and the best gold brokers, click here.
US Dollar Index vs Gold
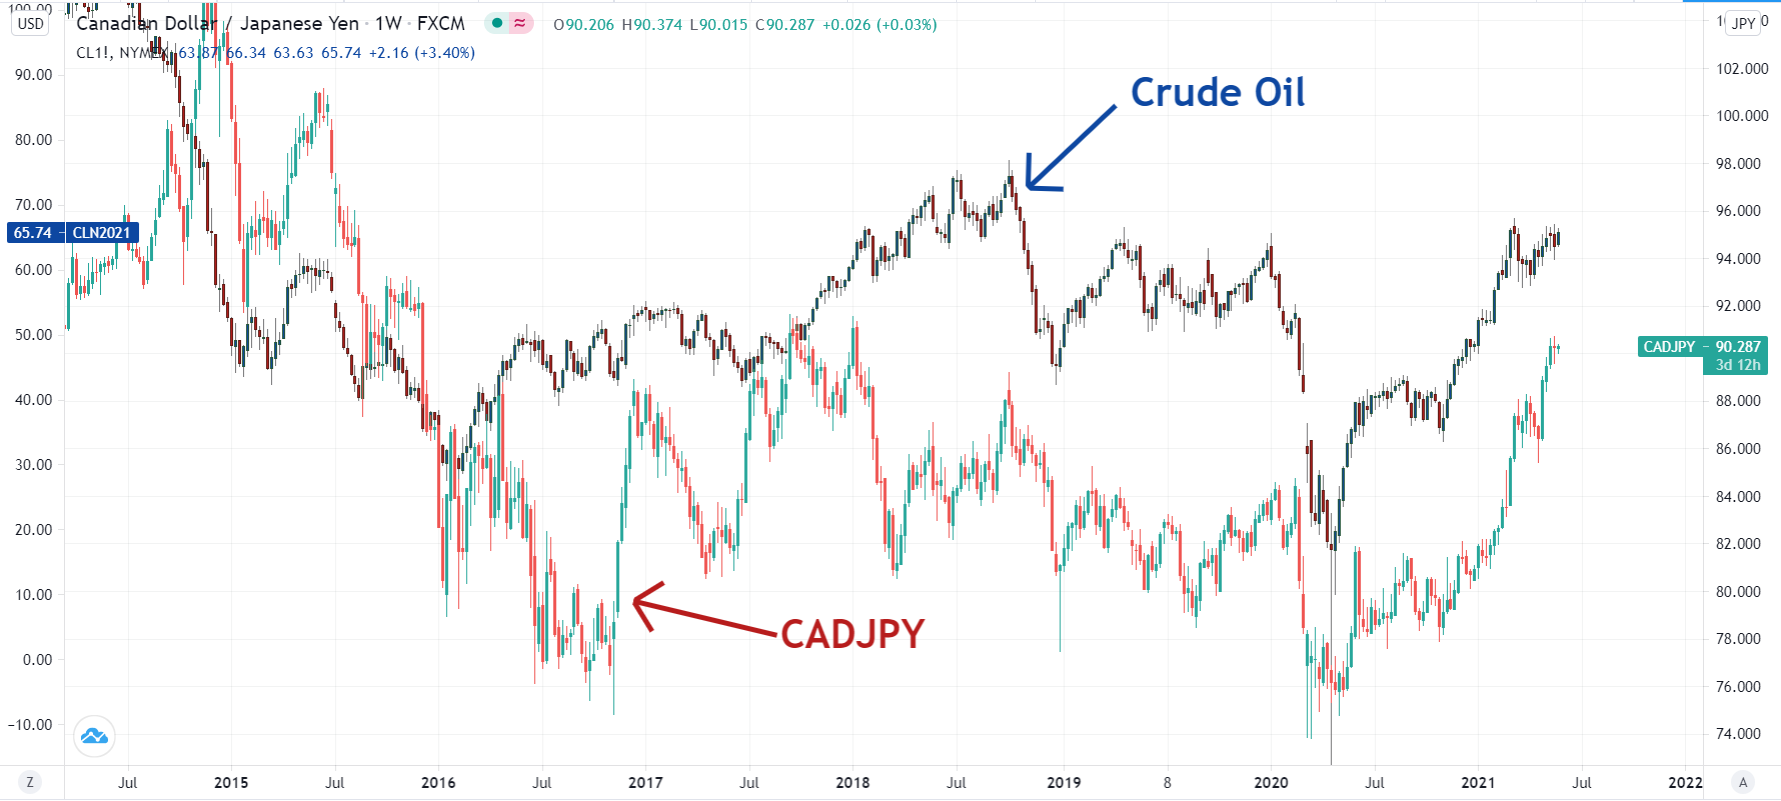
Canadian Dollar vs Crude Oil
CAD/JPY vs Crude Oil: Strong Positive Correlation
Canada is one of the top oil producers in the world and exports close to 2 million barrels/day to the US. This makes it the largest oil supplier to the US and the sheer volume involved creates a huge amount of demand for Canadian dollars. Also, Canada’s economy is dependent on exports, with about 85% of its exports going south of the border to the US. Because of this, the Canadian Dollar can be greatly affected by how US consumers react to changes in oil prices.
Most correlation tables report USD/CAD vs Crude, but CAD/JPY is often a better reflection of the trends in Crude Oil compared to USD/CAD because it also captures the risk-on/risk-off dynamic (being an XXX/JPY cross) as well as geopolitical turmoil.
Lesser-Known Correlations
And then, there are some correlations that textbooks do not always spell out very clearly, because they are emerging correlations that market practitioners are only just beginning to take note of. Below are some consolidated correlations to date.
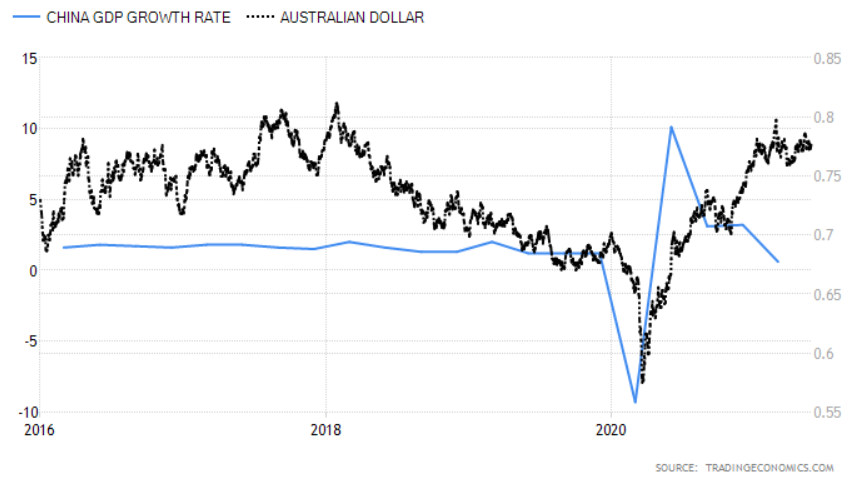
Chinese GDP vs. AUD/USD
China GDP Growth q/q vs AUD/USD (Source: Tradingeconomics.com)
China's economy is getting more and more important and has played a key role in supporting the global economy during the 2008 recession and the recovery phase. But the Chinese yuan (CNY) is not a freely floating currency yet. For that reason, traders need a proxy (a substitute) that made sense and had good liquidity. The answer to this question is the Australian Dollar. Australia's economy – being geographically so close to China – is greatly influenced by the pace of the Chinese economy because China is Australia's largest trading partner. So, traders have started to play the Aussie as a proxy for Chinese economic strength or weakness.
As a practical example, many major Australian mining companies rely heavily on China and other growing big economies such as India for exports. These companies include Fortescue Metals Group, Rio Tinto, BHP Billiton and Xtrata, all of whom have major Australian operations.
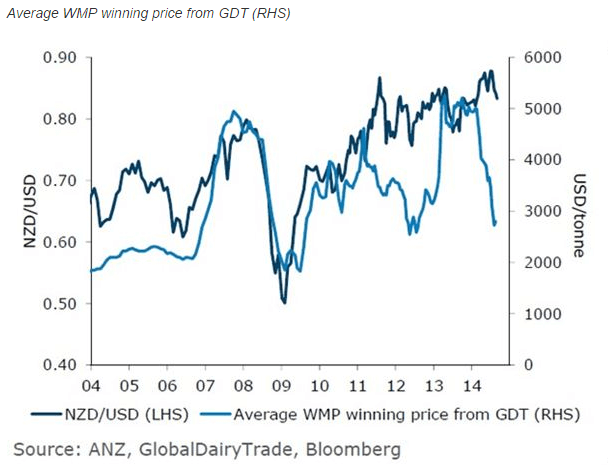
NZD Correlation with Global Dairy Products
Global Dairy Products vs NZD/USD
New Zealand is unique in that it exports 95 per cent of the 19 million tonnes of milk produced by New Zealand farmers, continuing a history of dairy exports spanning back to 1846. New Zealand farmers receive no subsidies, which has encouraged a focus on low-cost, high productivity farming systems. Processing facilities are mostly co-operatively owned by farmers, with the main co-operatives being Fonterra, Westland and Tatua. The total number of New Zealand dairy cows exceeds 4.5 million so there are officially more cows in New Zealand than people. No wonder the global dairy trade auctions are so important for the Kiwi! Learn about New Zealand's best forex brokers.
Final Thoughts
To survive as a Forex trader, it is important to understand how different currency pairs move in relation to each other, as well as the influences other asset classes have upon Foreign Exchange. Learning about currency pair correlations can help you manage your risk better and understand what is driving price movements in a certain currency pair. Regardless of your primary trading strategy, having a firm grasp of correlations can greatly enhance your results.

