When price moves in a market, it is often because it rides the waves of higher trading volumes. Sometimes, those waves are part of a larger tide pushing the price into a trend. Other times, a swirl in the ocean of volume causes somewhat erratic price movements. Or the waters may be still and calm with low volume, producing a narrow trading range.
Whatever the state of the waters, the price ultimately rests on the surface of the market volume.
Many technical analysts examine only the price action itself without paying attention to volume—at least, that is what I see on trading forums, and admittedly, I can be guilty of the same mistake. However, examining price action alongside volume opens a new layer of actionable information.
Let us look at how volume plays a role in technical analysis and how to apply the knowledge in trading.
What is Volume in Forex?
Volume bars generally represent the number of units bought and sold during the same period as the chart time frame set. For example, in a daily price chart, each volume bar represents that day's total market volume. In an hourly chart, each volume bar is the volume traded in that hour alone.
However, brokers can calculate volume a little differently in Forex instruments.
How to calculate volume in Forex
Forex is an over the counter or OTC market, meaning no central exchange exists. A Forex broker’s chart shows only their own volume information, not the volume across the entire industry—meaning volume data may differ across brokers. That is also true for all OTC markets, such as CFDs and cryptocurrencies.
In comparison, markets with central exchanges, such as equities and futures traded through NYSE and CME, should report the exchange’s actual volume and be identical across brokers offering access to said central exchanges.
Most brokers use “tick volume” for Forex. Tick volume measures the number of transactions and not their actual total monetary value, i.e., it is not true volume but more a measure of activity. Traders mostly agree that tick volume correlates well with actual volume and can be used in trading decision-making.
Spot-check the broker’s volume against other sources
Given that volume in Forex depends on the broker’s data, it can help to occasionally look at how the volume bars compare with other brokers’ demo platforms or web-based charting platforms. For example, if I see a spike or dip in volume, is it also reflected on another broker’s feed? Some web-based charting tools, such as TradingView, aggregate multiple volume sources for their data to average any discrepancies.
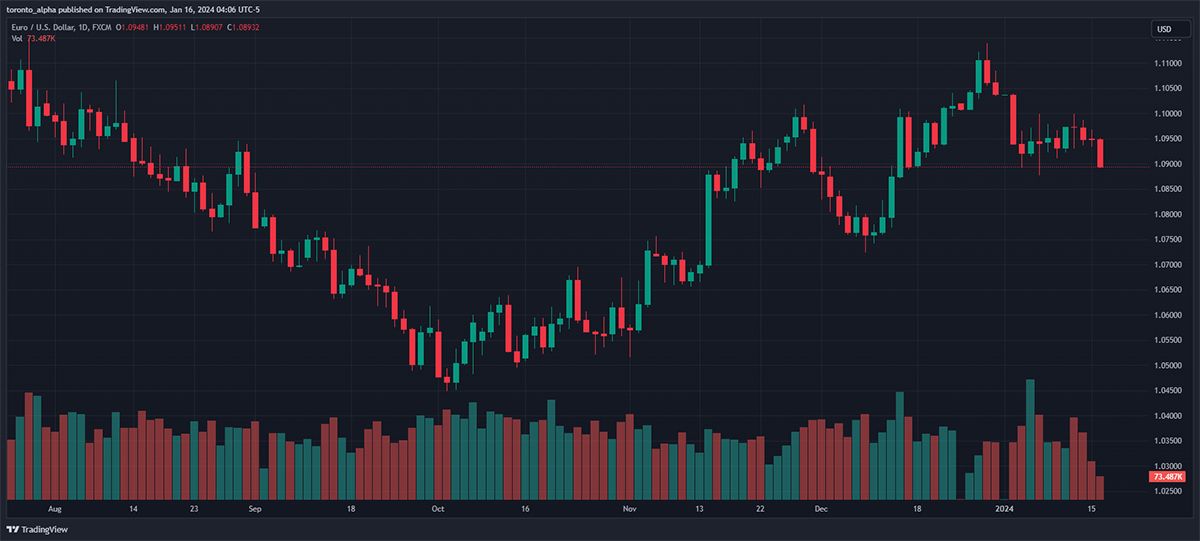
Notice how some volume bars are green, and others are red. This lines up with the candlestick colours—the green volume bars occurred on "up days," and the red volume bars occurred on "down days."
Top Forex Brokers
Factors to Consider When Trading with Forex Volume
Does strong volume support the direction of the market?
If I am riding an uptrend, I want to see strong volume on the green bars and less volume on the red bars when the market pulls back. That tells me that the actual weight of demand for the asset supports the uptrend.
On the other hand, if I am riding a downtrend, I want to see strong volume on the red bars and less volume on the green bars when the market pulls back.
Later in the article, we will look at an example of when higher volume confirms a new trend after a price level breakout.
Does a candlestick pattern produce high volume, confirming its validity?
Let us take an example using a pin bar. A “pin bar” is when the price has a small body and a long tail. Preferably, the tail should be at least two-thirds of the entire length of the candle, meaning the body should be in the bottom or top third of the candle. It does not matter if the pin bar body is green or red—what ultimately matters is the direction of the tail.
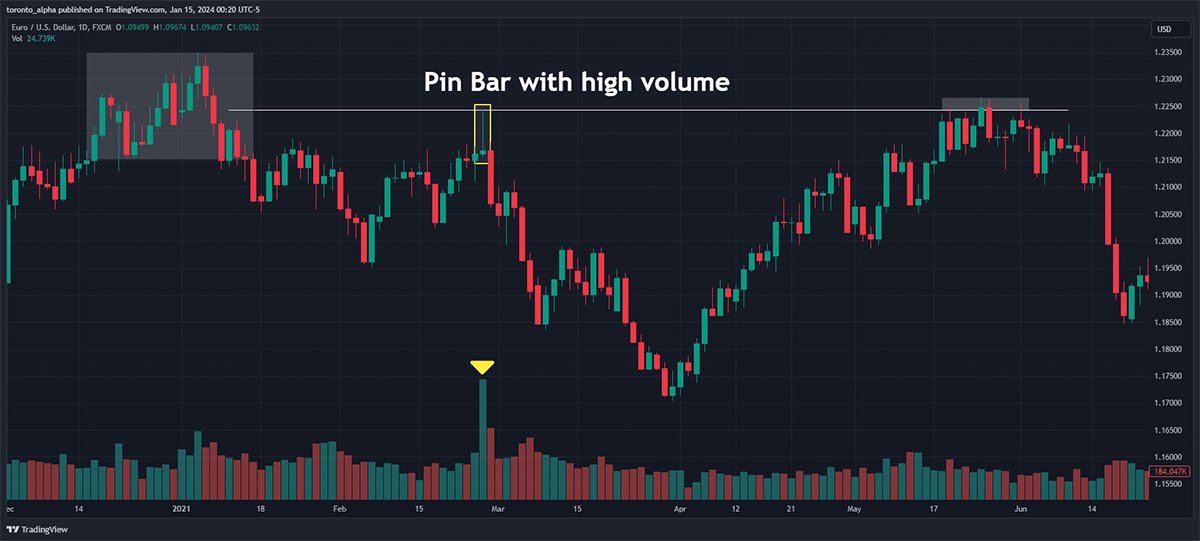
If I see a pin bar coupled with high volume, I pay attention to it. I will not just trade it blindly—I want to see some market context, e.g. is the pin bar at a previous support or resistance level? Here is a pin bar set up with high volume on the EUR/USD daily chart:
Let us break down the analysis:
- The pin bar had a very prominent spike in trading volume.
- The tail of the pin bar protruded into a resistance zone where the market had previously reversed.
These two factors made the pin bar a strong bearish signal. This proved correct when the market declined following the pin bar and returned to the same level, which was a strong resistance.
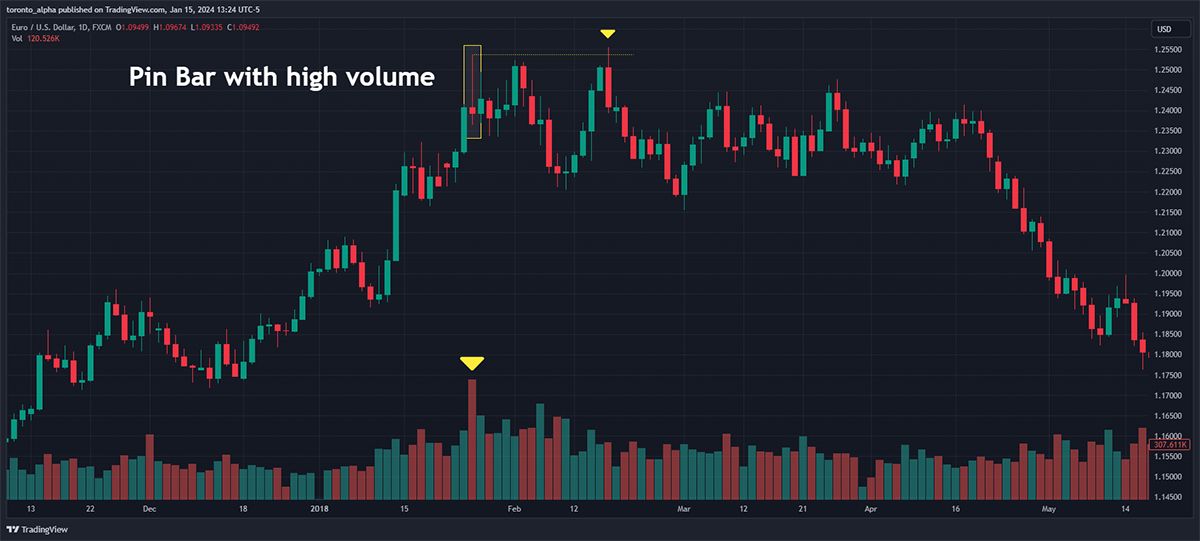
Let us take one more example.
The bearish pin bar and high volume are clear in this example. However, the pin bar was not near any recent resistance level (in fact, the price had not traded there in nearly three years). But once the pin bar was established, the price immediately paused its uptrend, began a tightening range, and eventually declined. Notice how the pin bar held as a resistance during the consolidation.
Using volume to confirm a breakout
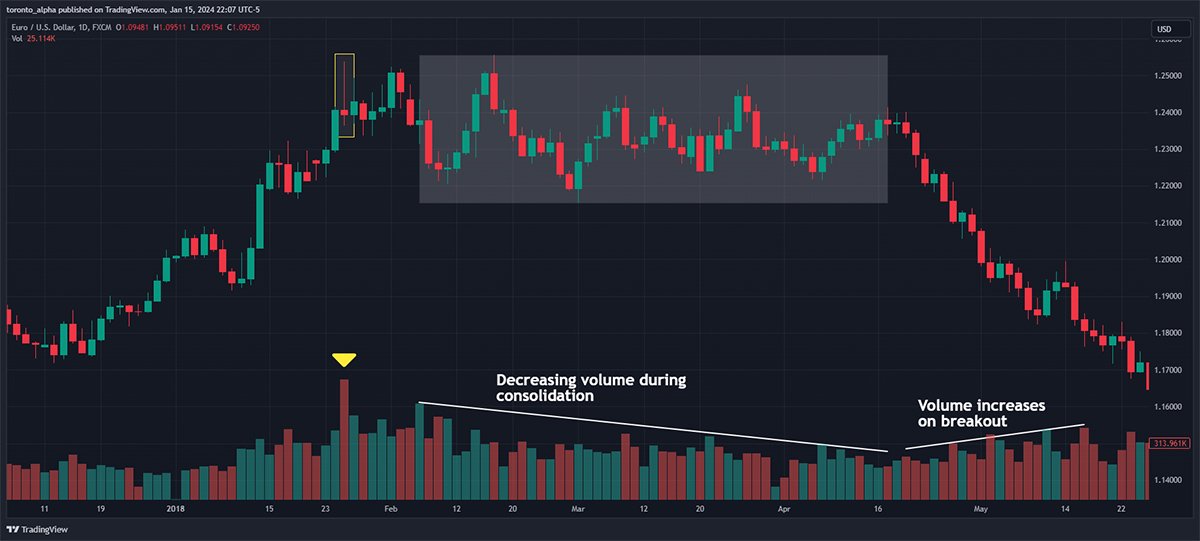
When the market consolidates, volume typically reduces. This is not surprising as lower volume helps to decrease volatility, which is how a market consolidates. If volume picks up upon the break of that consolidation pattern, it helps to confirm the breakout direction is real and the price momentum sustainable. Let us go back to our EUR/USD example after the pin bar.
Let us break down the analysis:
- As the market consolidates, the volume gradually reduces.
- As the market slopes down, the volume picks up, and we see taller red volume bars, meaning higher volume on down days. This helps to confirm the direction of the breakout is real.
Top Forex Volume Trading Strategies
My favourite volume trading strategy is volume spread analysis (VSA). It is an entire trading method: it is not a mechanical strategy, and it takes time and practice to learn and apply it to live opportunities. I have seen many traders use it successfully, and the approach stands the test of time.
Volume Spread Analysis
Volume spread analysis (VSA) is a set of ideas by Tom Williams, expanding on the Wyckoff method developed by Richard Wyckoff. There are many concepts in the VSA method, and the source is Tom William’s book, Master The Markets. I will summarize one popular VSA concept to give a flavour.
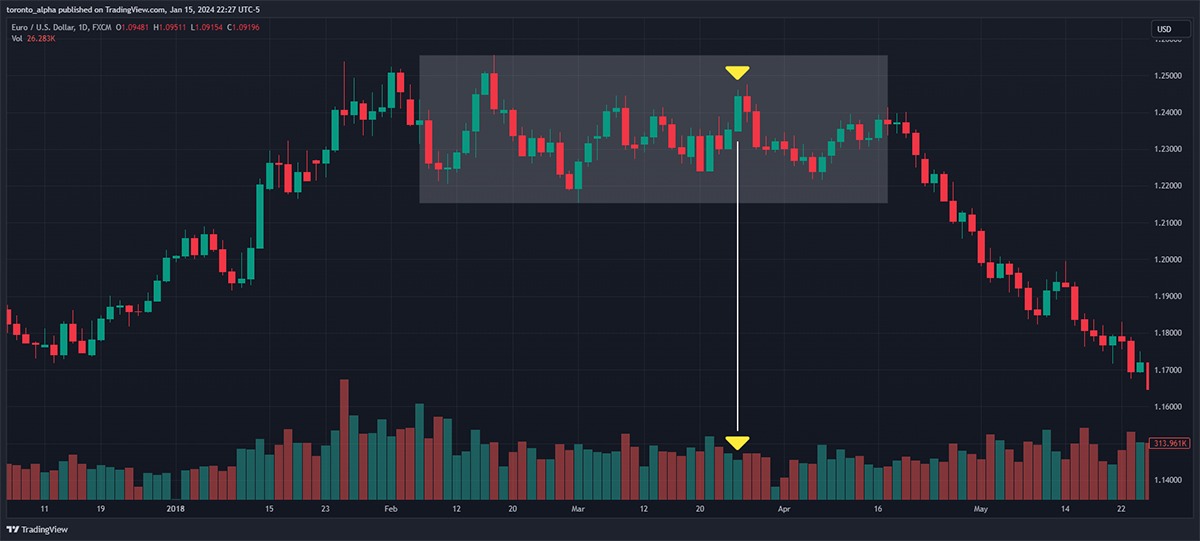
No demand up bars: The closing price is higher than the opening price for the current bar, and volume is weaker than the past two days. This is considered a bearish signal.
Let us break down the setup:
- A bullish bar appears with less volume than the two preceding bars.
- This example is excellent because the range of the bullish candle (from high to low) is larger than the range of the previous two candles. That means the price moved more in the setup candle but had moved on less trading volume, indicating a weaker move and, therefore, a bearish signal.
- The candle's high also lined up nicely with resistance areas to the left.
This “no demand up bar” signalled that the consolidation would likely end soon, and the price would decline. The setup also helped identify the top of the consolidation, giving an excellent early bearish signal.
No supply down bars: The closing price is lower than the opening price for the current bar, and volume is weaker on average than the past two days. This is interpreted as a bullish signal.
How & When to Use Volume Trading Strategies
- Always look for market context: Volume confirms price action, not vice versa.
I identify the bullish or bearish setup using price action with the trading volume as a confirming factor in all my examples.
- Make sure the signals are clear.
Volume analysis is perhaps one of the more subjective areas of technical analysis—there are mechanical rules. Ensure the setups are clear—one way I do that is by journaling the trade setup to ensure I can explain the intent in writing and it makes sense on paper.
- Higher timeframes are more reliable.
My favourite timeframe when using volume analysis is daily charts. I then use lower timeframes with just price action to find an ideal spot to execute my trades based on expected support and resistance levels.
Pros & Cons of Volume Trading Strategies
Pros
- Extra information: Volume provides clues on the chart that are only sometimes visible with price action analysis alone.
- Early reversal signs: The first signs of a reversal often appear when incorporating volume, providing early entries into a new price move.
- Volume trading has worked for a long time: Traders have tested the concepts behind volume trading over decades and are likely to stand the test of time.
Cons
- Volume trading is subjective: few traders use volume with mechanical rules.
- Long learning curve: Incorporating volume into trading successfully can take time and practice.
- Volume is a confirming factor: traders should only use it with understanding the wider market context, e.g. is the market in a trend or consolidation or near key support or resistance?
Bottom Line
All markets are powered by volume, and learning to read volume provides an extra layer of information and context for analyzing the markets and anticipating future moves. Although learning to use volume as an indicator takes time, the rewards are worth it. Volume analysis often shows that the price is about to reverse or make a new trend before any other signal. Volume can also confirm the significance of certain candlestick patterns, such as pin bars, and the potential direction of price breakouts. Most importantly, traders should always volume in conjunction with price action.
FAQs
How do you trade a volume strategy?
Use increased volume to confirm candlestick patterns such as Pin Bars or the direction of a breakout.
What is the best indicator for volume?
Volume spread analysis (VSA) provides great setups with “no demand up bars” and “no supply down bars.”
Is volume trading effective?
Yes, volume trading gives excellent information about current trends and reversal patterns.


