In this article, I will detail one of my most profitable trading chart patterns, the “Engulfing bar” candlestick pattern.
I’ve used this pattern for over a decade across many markets—Forex, equity indexes, metals, and Crypto. It is easy to spot on a chart, and the rules are straightforward, making it a simple pattern to trade. But more importantly, it’s reliable and consistently profitable, so read on if you want to improve your trading by better understanding price action.
This article will cover the following:
- The different types of Engulfing patterns
- How to use them for entries and exits
- Examples of Engulfing patterns in markets
Top Forex Brokers
What is the Engulfing Bar Pattern?
There are varying definitions of Engulfing bar patterns. Let us go through them.
Definition 1: The candle body engulfs the previous body’s candle.
This is the most basic definition and the most common. It’s a good starting point to understand how the Engulfing setup works.
Bullish engulfing: The body of a candle with a close higher than its open (a green candle on most charts) exceeds the range of the body of the previous candle, which should have a close lower than its open (a red candle on most charts).
Bearish engulfing: The body of a candle with a close lower than its open (a red candle) exceeds the previous candle’s range, which should have a close higher than its open (a green candle).
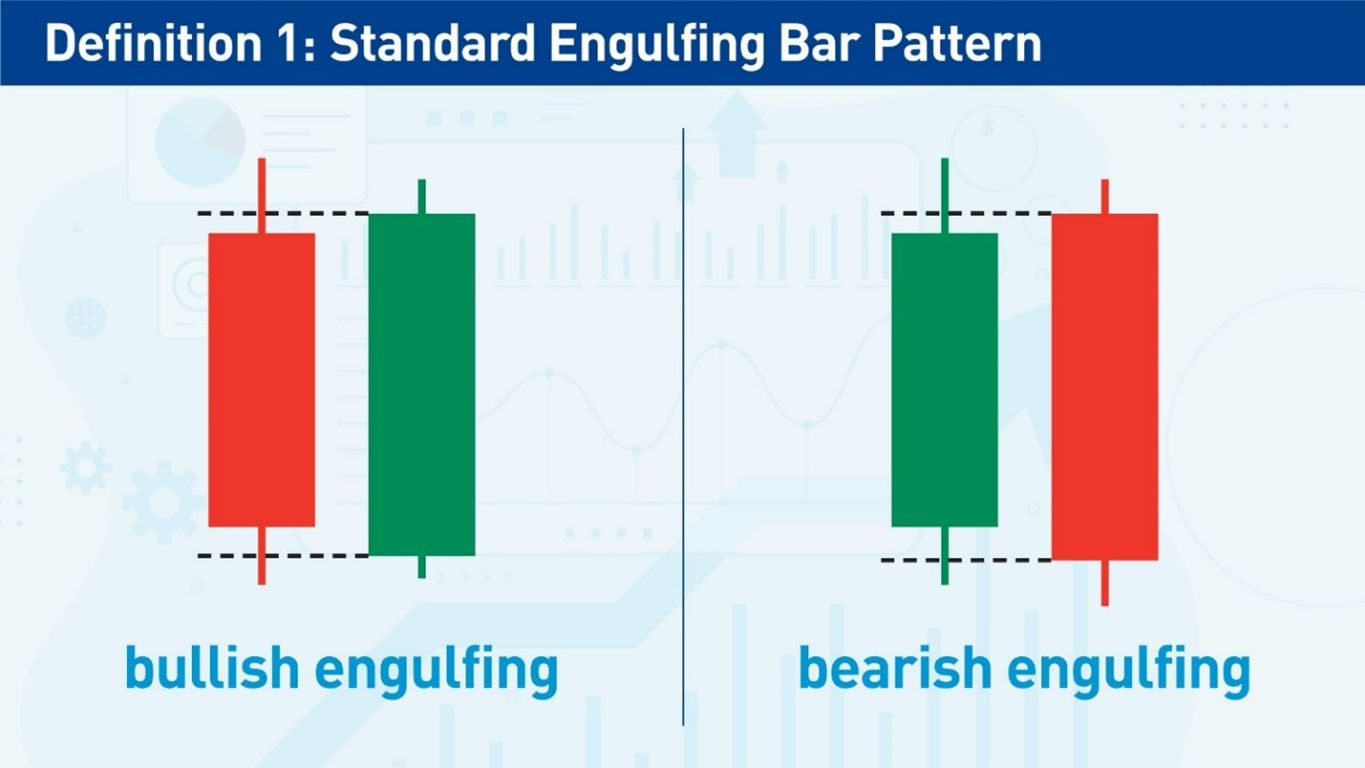
There are two limitations inherent to this definition:
- The first candle may have a small body that is not difficult to engulf, making it a less powerful setup.
- The definition does not consider the wicks, removing important price action from consideration.
Let us look at this example:
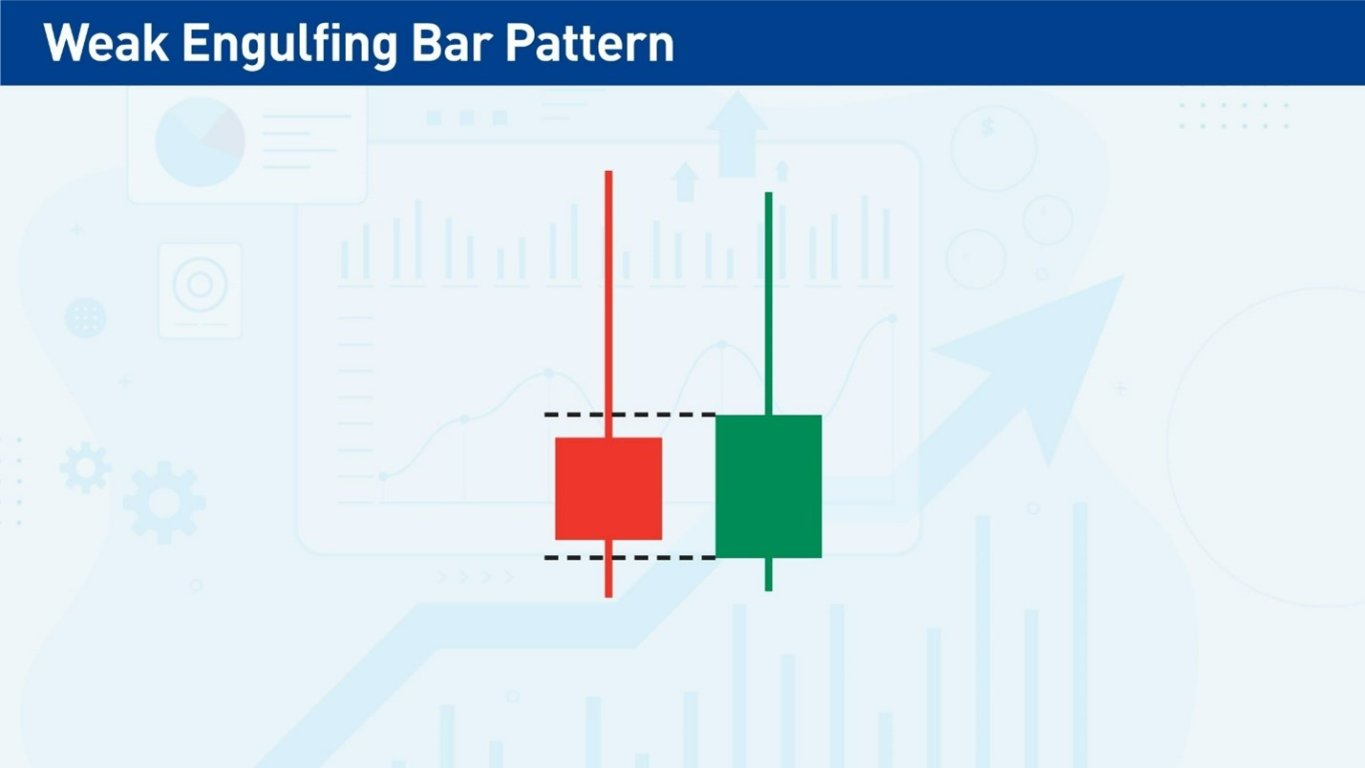
Although this technically falls under the definition of a bullish Engulfing pattern, I do not consider it a powerful setup. The wicks are long on each candlestick, suggesting indecision, and the second candlestick closed far lower than its high, which is not a particularly bullish sign.
Because the basic definition of an Engulfing pattern can produce weak setups, we want to enhance our rules. Let’s look at a stronger definition of an Engulfing pattern.
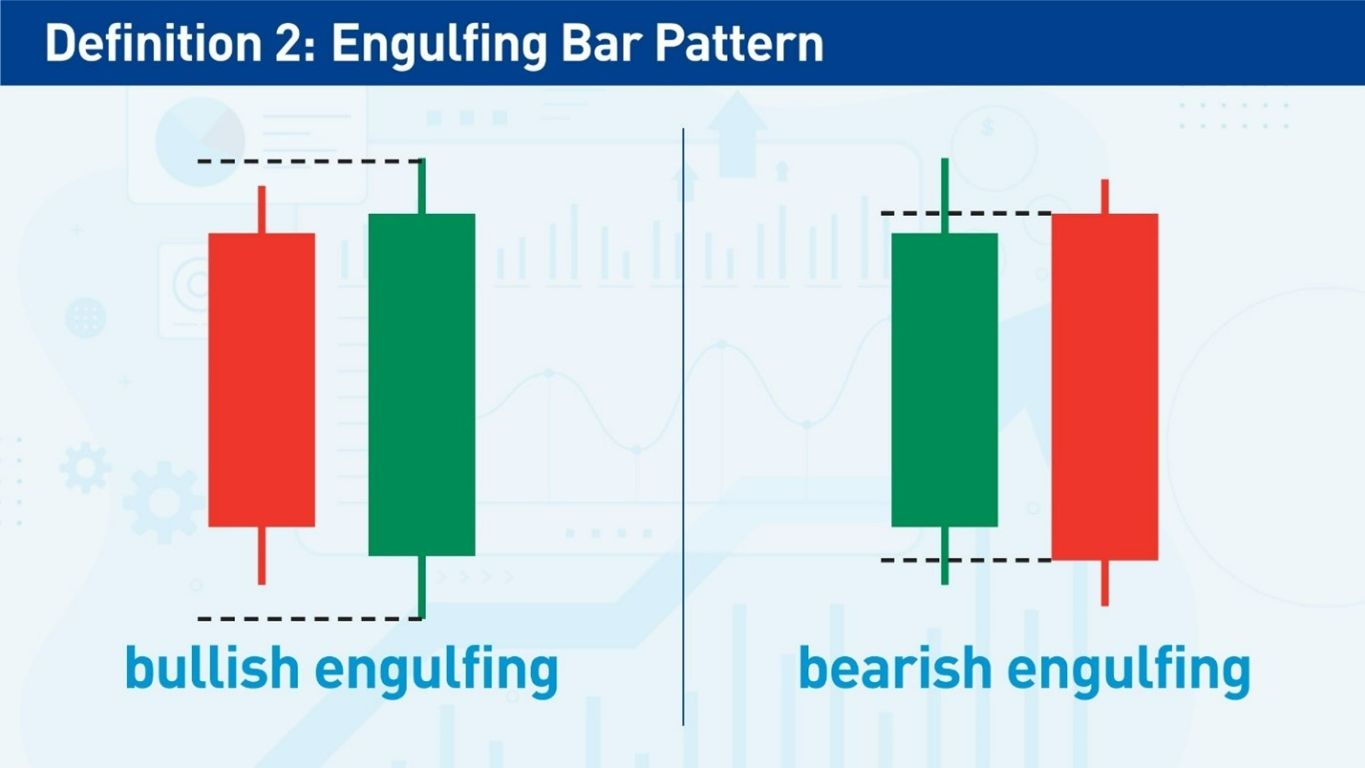
Definition 2: The candle’s wicks engulf the previous body’s wicks.
The rules are similar to the first definition, except now I want a candle’s wicks to engulf the previous candle’s wicks. I still want to see a red candle followed by a green candle for a bullish setup or the other way around for a bearish setup.
This definition of an Engulfing pattern is also known as an “outside bar.”
Definition 3: Engulfing pattern with short wicks
Long wicks represent indecision in the market. If I want to see decisive moves, I look for candles with short wicks. In this definition of an Engulfing pattern, I want to see at least the second candle with short wicks, but preferably in both candles for a more powerful signal. To keep the wicks short, I like the body to be at least two-thirds of the entire candle length (this limits the wicks to a third of the candle length).
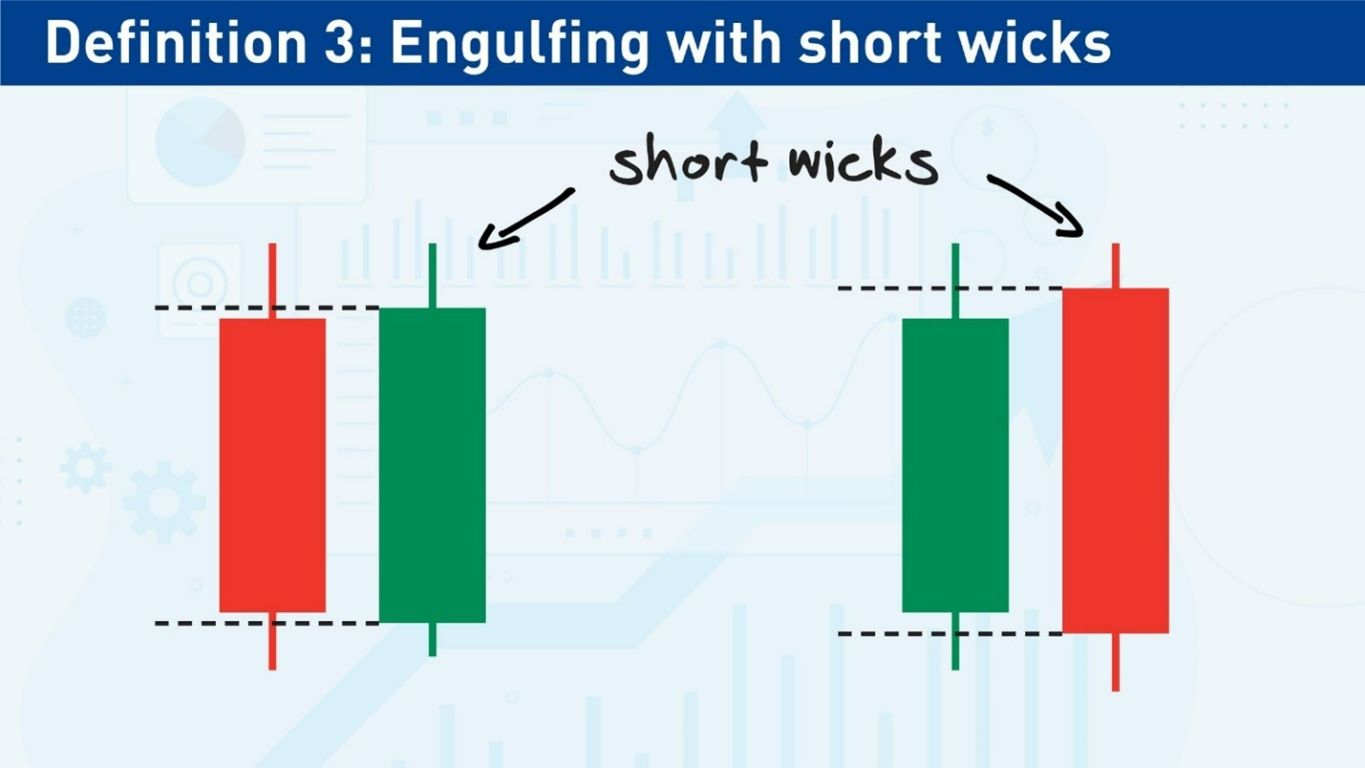
In this Engulfing definition, it does not matter if the second candle’s wicks engulf the first candle’s wicks.
How to Trade Using the Engulfing Bar
Which Engulfing Bar definition should I use?
The first step in trading using the Engulfing bar is to decide which definitions of the pattern to use.
Definition 1, which does not consider the wicks, allows too many setups of inadequate quality. I use Definitions 2 and 3 when trading the Engulfing setup.
Where should I place my entry?
Long trade: after a bullish Engulfing bar, a long entry should be above the high of the second candle.
Short trade: after a bearish Engulfing bar, a short entry should be below the low of the second candle.
Aggressive entry: If I feel confident in the trade because of market conditions, I will enter immediately at the open of the next candle once the Engulfing bar setup is complete.
Where should I place my stop loss?
Long trade: The stop loss should be below the low of the second candle or a previous support level.
Short trade: The stop loss should be above the low of the second candle or a previous resistance level.
Using a previous support or resistance level as a stop loss will result in a larger stop loss. But it also means there’s less likelihood of getting stopped out too early in the trade, i.e., it can give the trade more breathing room.
Moving the stop loss to breakeven: I’ve noticed that most Engulfing bar setups result in a quick initial move. When the price moves half the distance of the length of the second candle, I move the stop loss to break even. As a result, I take fewer losses, although I get more trades stopped out at breakeven.
Where should I place my target?
I always ensure I can get one unit of risk, or a 1:1 reward/risk ratio, on each trade. I will not take the trade if I find that 1:1 R/R gives me a target beyond a support or resistance level that might block the price from reaching the target.
Once I know the trade has at least the potential of a 1:1 reward/risk ratio, I usually keep a target at the most recent resistance level for a long trade or support level for a short trade. I may take full profits at the support or resistance level target or take partial profits and trail the stop loss.
Bullish & Bearish Engulfing Bar Patterns
Let us look at actual examples of Engulfing bar patterns on charts. If this is your first time looking at this pattern, you’ll find it very easy to spot after seeing just a few real examples.
Example 1:
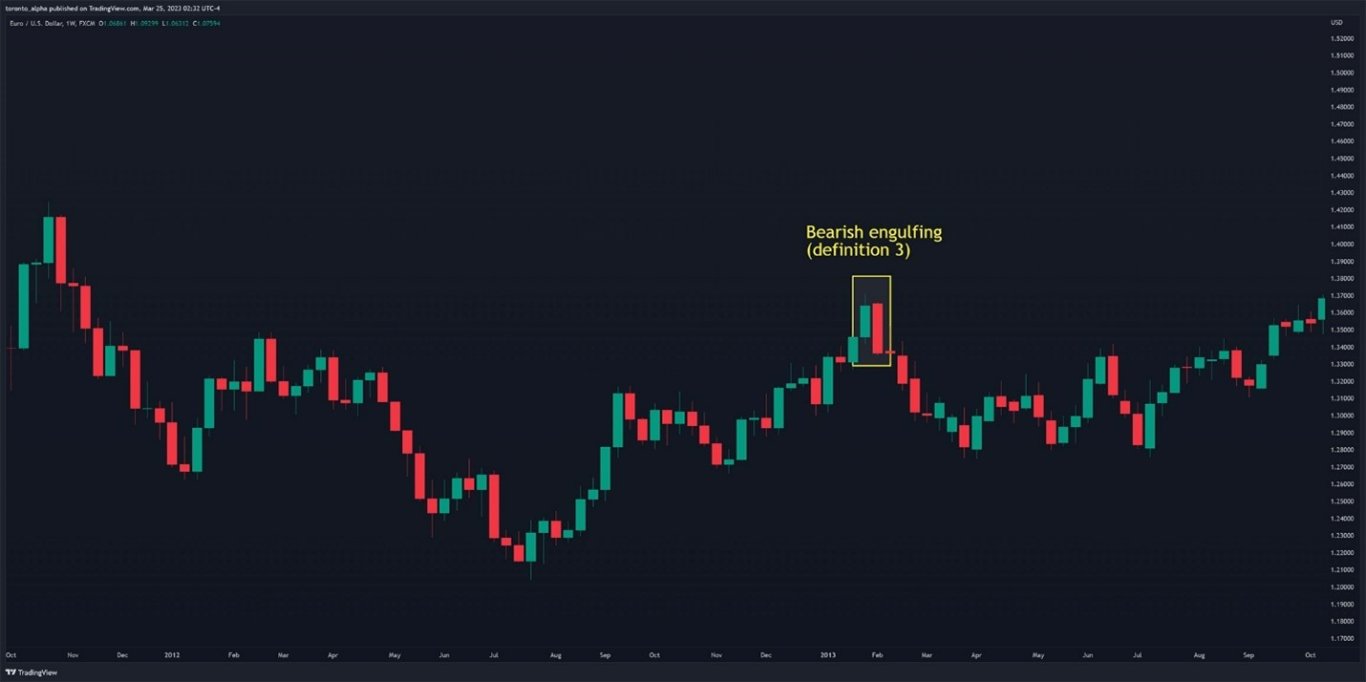
The above example fits definition 3 of a bearish Engulfing setup—both candles have relatively short wicks, especially the second candle, which shows a decisive bearish move. This bearish Engulfing pattern was the first sign that the previous uptrend was about to pause. I could either go short at the bearish Engulfing setup or exit my trade if I were long during the previous uptrend.
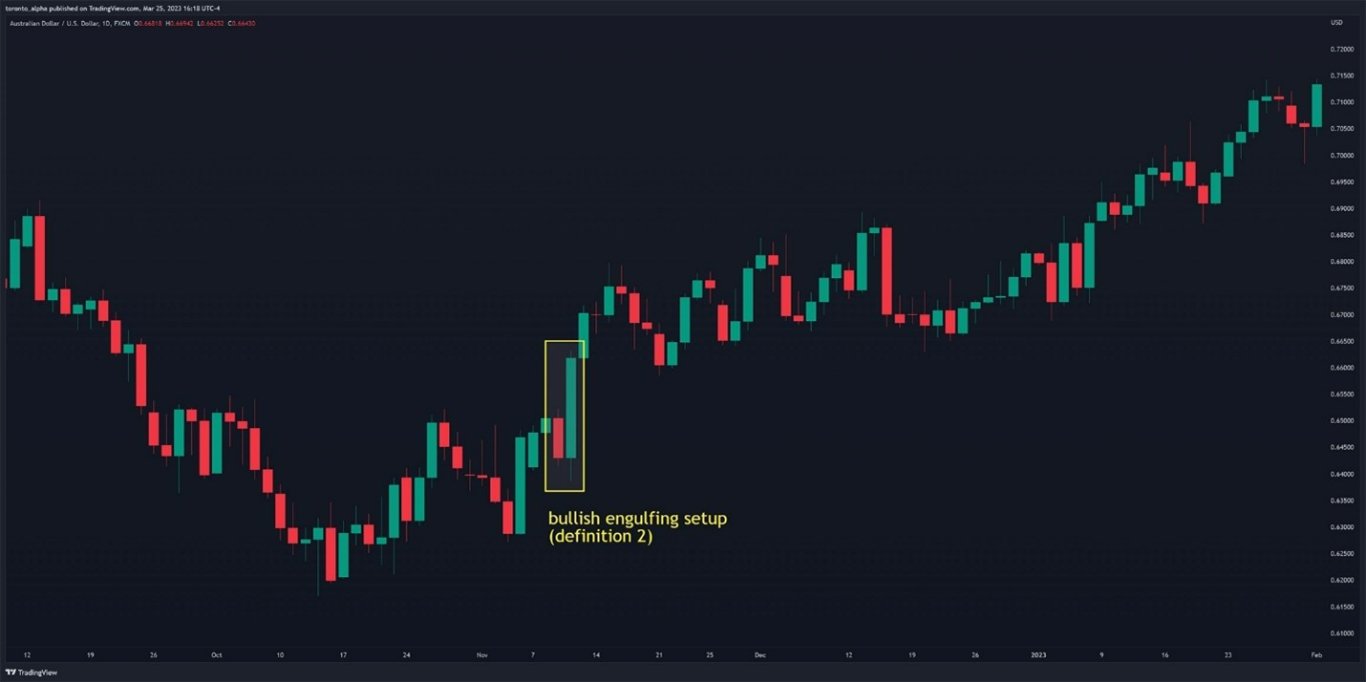
This example above is a classic bullish Engulfing bar setup. The market had been in a downtrend but paused and made a higher low just before the Engulfing setup. It might have been too early to say the downtrend was over, but the bullish Engulfing bar setup confirmed a new uptrend and would allow traders to enter near the beginning of the new trend. My only concern here would be that the second candle was very long, meaning traders would require a large stop loss for the trade.
Selecting the Best Engulfing Bar Patterns
The best Engulfing bar patterns align with the larger market conditions, and I never trade candlestick setups without considering the broader market context. There are two types of market conditions that I favour for trading an Engulfing bar pattern: trends and support and resistance levels. Let us look at both.
Using Engulfing Patterns in Trends
I look for an established trend (higher lows for an uptrend or lower highs for a downtrend) and use Engulfing bar setups to enter in the direction of the trend.
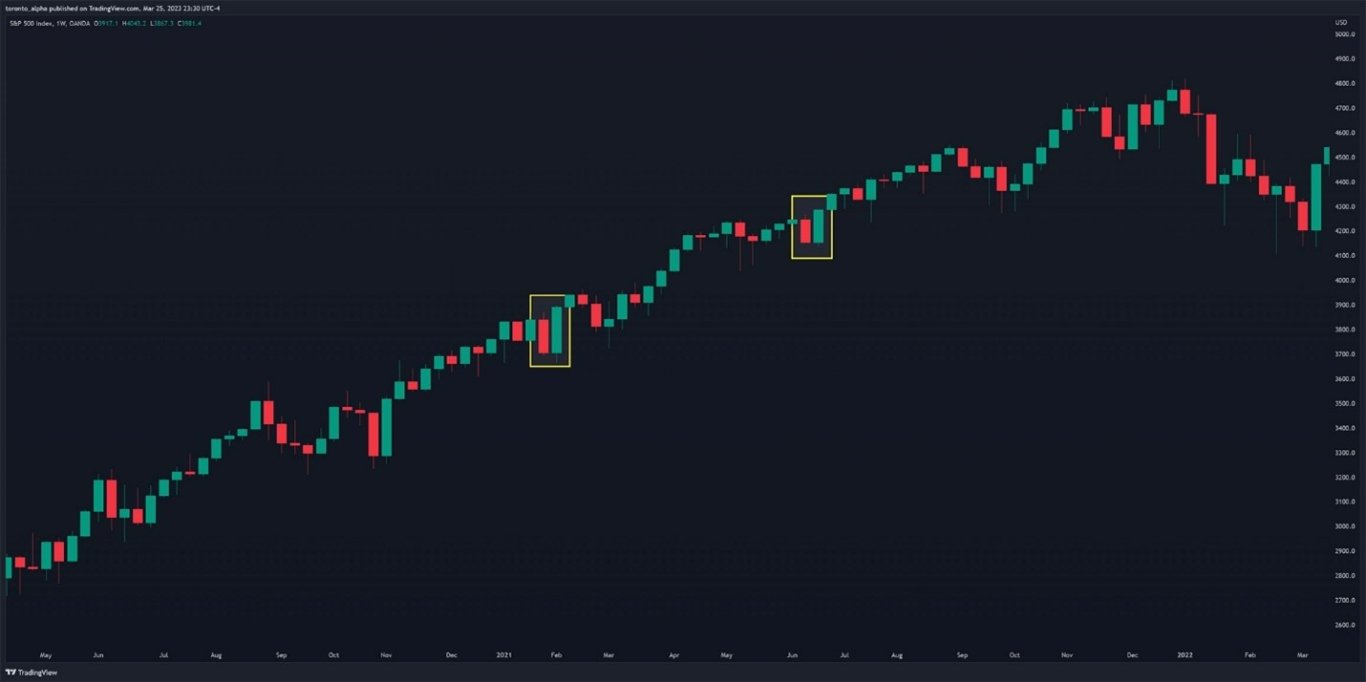
During the 2020-2021 S&P 500 Index uptrend, two bullish Engulfing patterns appeared on the weekly chart. Even though the price had been in an uptrend for almost a year when the first Engulfing pattern appeared, both Engulfing bar patterns provided entries into a mature trend. 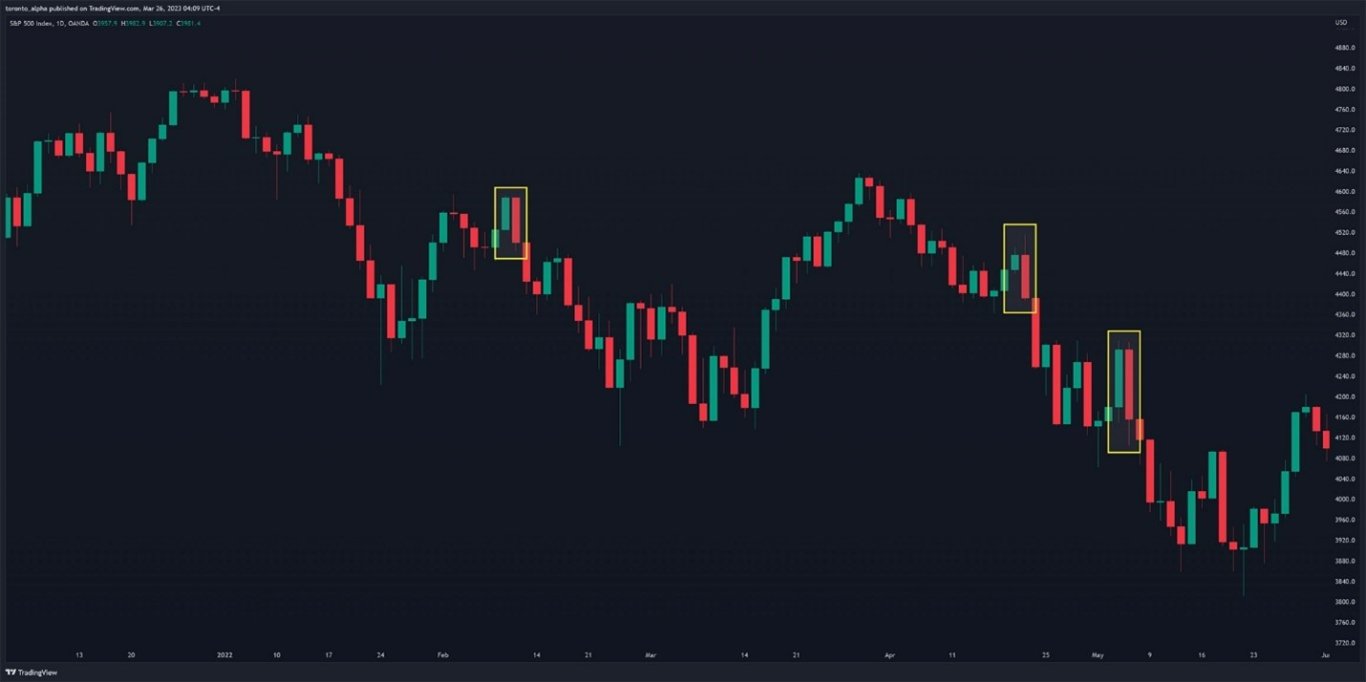
As the S&P 500 began to fall at the beginning of 2022 and started a visible downtrend, several bearish Engulfing bar patterns appeared on the daily chart. These helped tell traders that the price was forming a bear market and provided excellent bearish entries into the trend.
Let us look at another example:
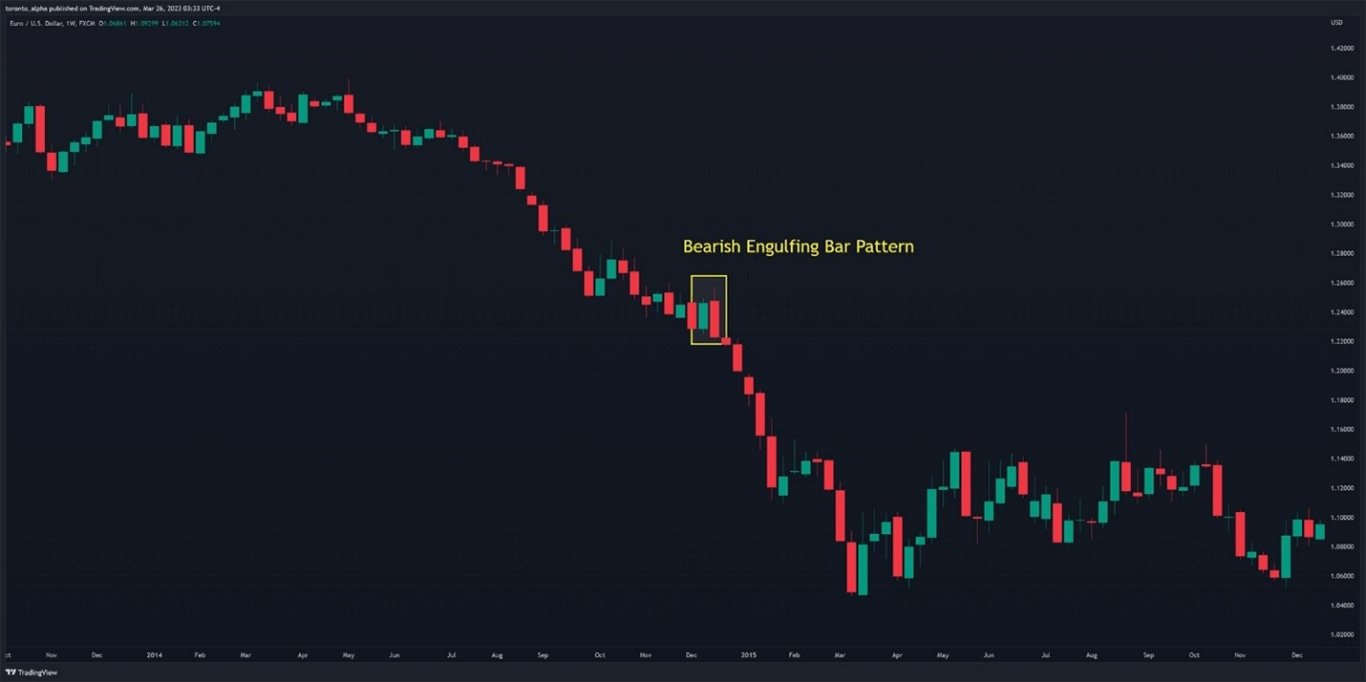
The EUR/USD was in a steep downtrend, but a quick pause and a new Engulfing pattern provided an entry point into the bearish trend.
Using Engulfing Bar Patterns with Support & Resistance
Engulfing bar patterns with support and resistance levels help confirm those levels and provide entries. Let us look at an example.
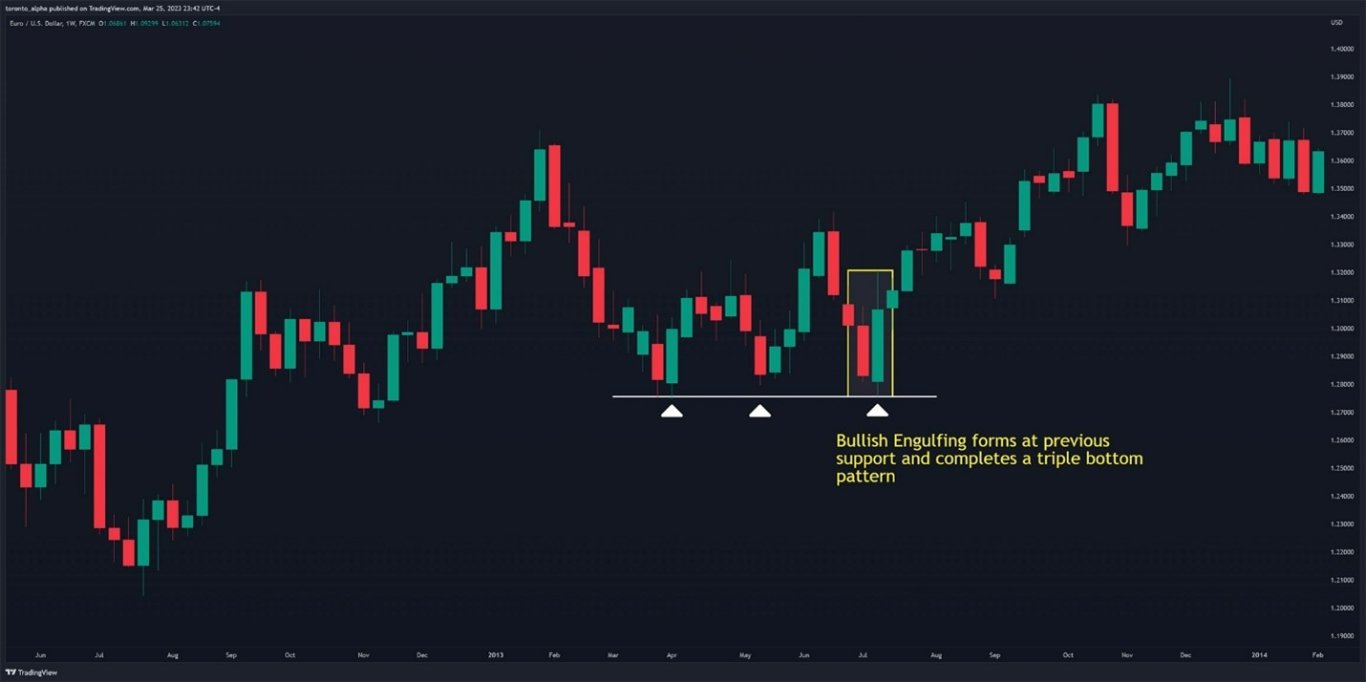
A bullish Engulfing bar pattern appeared on this EUR/USD Weekly chart which lined up nicely with a support level, giving me a textbook entry. The Engulfing pattern also made the support level a “triple bottom” pattern, i.e., three touches on the support line—a powerful chart pattern in itself.
Pros & Cons of Using Engulfing Bars
Pros:
- They can be used in any liquid market, e.g., Forex, Crypto, Equity Indexes, Commodities, etc.
- They are easy and simple to spot on a chart.
- Engulfing bars are a leading price indicator rather than a lagging indicator relying on past price data.
Cons:
- Engulfing bars on smaller timeframes, e.g., 1 hour or less, are less effective because they appear too frequently.
- They should be used only when market conditions are in alignment, not in isolation. For example, trade bullish Engulfing bar patterns in an uptrend or against a support level.
Bottom Line
Engulfing bar patterns are an effective tool in any trader’s arsenal to find entry points. They are simple and easy to spot.
The setup typically consists of a candle whose range exceeds the previous candle’s range, i.e., the second candle’s wicks are higher and lower than the previous candle. If the first candle is bullish/green, the second candle must be bearish/red, or vice versa.
A long entry can be above the high of the second candle with a stop loss at the low of the second candle. A short entry can be below the low of the second candle with a stop loss at the high of the second candle. A more aggressive entry is to enter immediately once the setup is complete.
Like many candlestick setups, they are more dependable when they appear in higher time frame charts.
Always consider the market context when trading Engulfing bar patterns. The two best scenarios to trade the pattern are in trends or against support or resistance levels, as this tilts the probability of success in your favour.
