Top Forex Brokers
A pullback strategy is one of the most common ways to trade financial markets. This means jumping into a market that has established a trend and pulled back to consolidate before the trend resumes.
Think of it this way: if you are in an uptrend, you can’t go straight up forever. Quite often, traders will buy when the market falls slightly after a move higher. This gives traders who may have missed out on the initial surge an opportunity to get involved.
It works in both directions. If the market falls over the longer term, it will occasionally bounce, and sellers will jump in at that point. Pullbacks happen in both up and down trends.
What Is Pullback Trading?
Pullback trading generally involves entering a trade when the asset is in an uptrend, following a brief price retracement. The idea is to pick a trending asset, wait for it to dip as it consolidates temporarily, and then go long before it continues its trend.
Getting your timing right is critical, so using an indicator like the Relative Strength Index (RSI) can help determine when the asset is oversold and primed to resume its uptrend.
Also, buying the asset when Fibonacci retracement levels measure a price drop between 38.2% and 61.8% is considered optimal.
Pullback trading has the potential to be profitable, but the ability to identify high-probability opportunities and avoid a major reversal takes skill and experience in technical analysis. However, applying a cruder method, which takes no real skill, is possible by applying a grid to a price chart of a trending currency pair and buying at set retracement levels. Fibonacci retracement levels can also achieve the same result.
Top Forex Brokers
How Does Pullback Trading Work?
Implementing a pullback strategy is to find an asset in a trend, identify brief retracements, and open a position as soon as the pullback bottoms and the price are ready to bounce back.
This sweet spot might be identified by looking at the Fibonacci support level or using an oscillator such as the RSI to decide when the asset is oversold. Alternatively, support or resistance levels can be identified by analyzing historical price action.
Stop losses should be placed at the pullback low, and the trade should be held with a trailing stop until the trend reversal. If the trade is timed right, the stop loss will never be triggered as the asset trends.
Available Tools for Pullback Trading
Many tools are available for pullback strategies, including moving averages, Fibonacci retracement tools, support, lines, resistance lines, trendlines, round numbers, Bollinger Band indicators, and many others. What you choose to use is purely a personal choice, but some very common trading systems are based upon pullbacks that I have found useful over the years.
Fibonacci Retracement
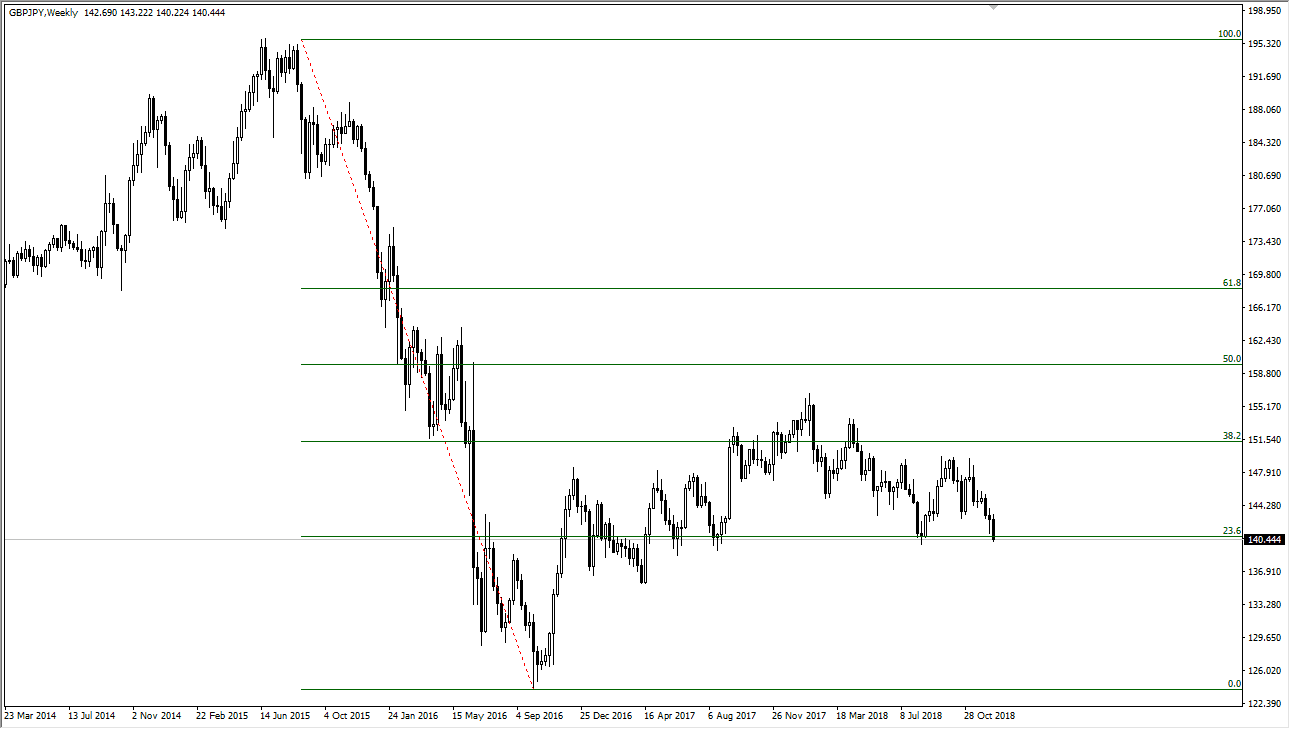
One of the most common ways to play a pullback is to use a Fibonacci retracement tool on a trend. A handful of Fibonacci levels are more important to most traders, with the 50% and the 61.8% Fibonacci retracement levels being the most desirable, perhaps followed by the 38.2% Fibonacci retracement level.
The attached chart shows that the AUD/NZD pair fell from the 1.0880 region to the 1.08 area. It bounced back towards the 1.0850 level, an area that I have marked right at the 50% Fibonacci retracement level. Sellers re-entered on this pullback and continued to push lower.
Trendlines
Using a simple trend line can also be an excellent way to play pullbacks. A well-defined trend line lasting for several candles is a way to play the market because many others are paying attention to the same thing. A trend line, by its very definition, defines the trend and, therefore, the directionality that you should be following.
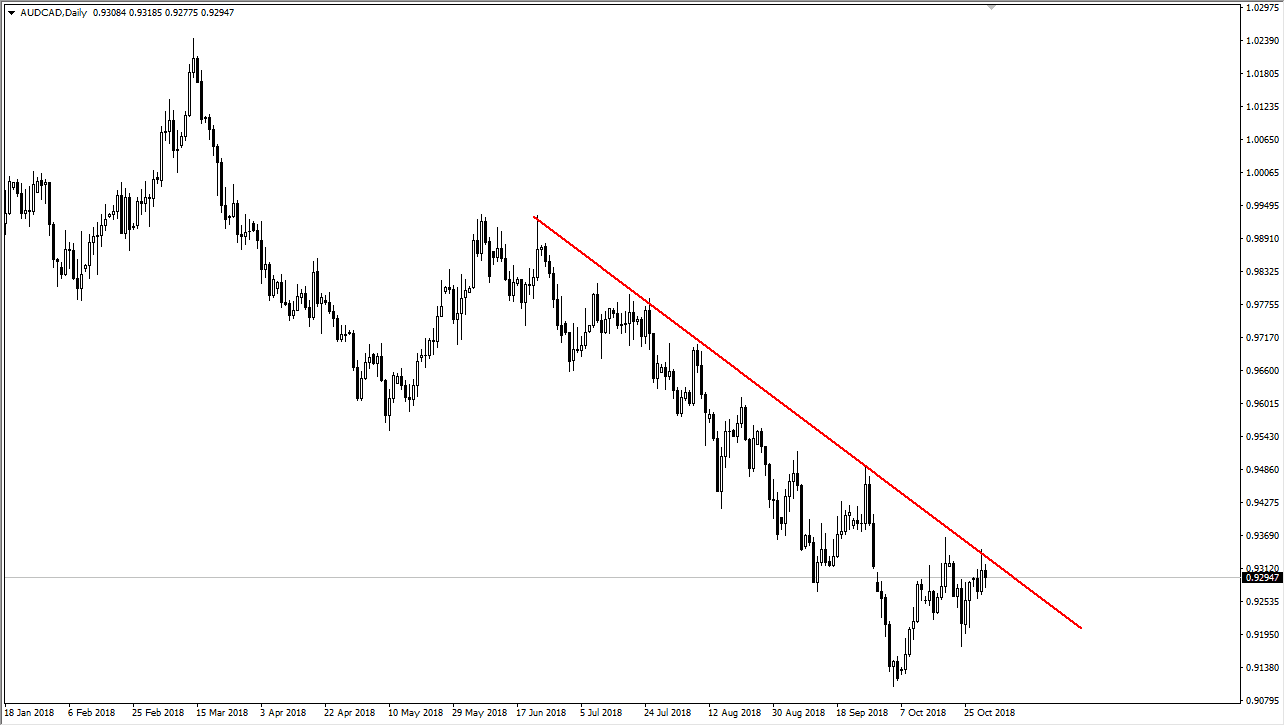
On the below AUD/CAD chart, sellers pushed the Australian dollar lower against the Canadian dollar every time we bounced towards the red downtrend line. For several months, this has been "easy money."
Moving averages
Moving averages can be one of the easiest ways to play a pullback strategy, but you should ensure you use a moving average that people care about. The most important moving average on the daily chart is the 200-day moving average, as it shows the longer-term trend. This is the moving average over the last calendar year, which carries some weight. Other moving averages are also important, including the 20 EMA, 50 EMA, and the 100 EMA.
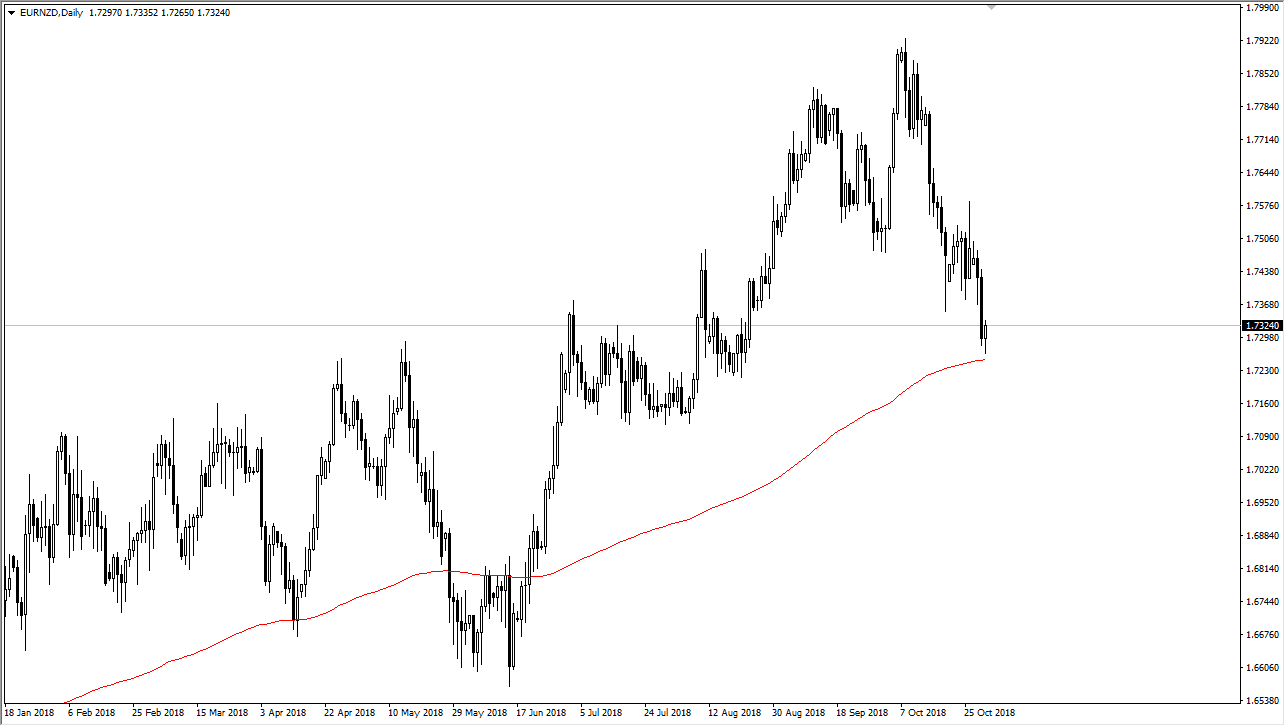
The attached chart shows that the EUR/NZD pair rallied significantly over about five months before selling off drastically. However, I have the 200-day EMA plotted on the chart, and you can see that the candlestick is starting to form a hammer candlestick, a bullish sign. Beyond that, there has been a cluster of trading action in this vicinity since July, so there's a good chance there's buying pressure waiting to be released in this area.
Support and resistance
The most basic and most important type of pullback system is built around simple support and resistance. A basic horizontal support or resistance line can greatly affect how you view a marketplace. Most of the time, you will see major support and resistance at large, round whole numbers. For example, on the attached USD/ZAR daily chart, you can notice that there has been both support and resistance at the 14 handle. This large, round whole number will attract a lot of order flow and large trading. We have rallied significantly for some time but have returned to the 14 handle multiple times and found buyers every time we have. Because of this, you can see how powerful this type of trading can be. As a side note, you can also notice that the 13 handle acted the same way.
Hundreds of varieties
The idea of this article isn’t to give you the “one-size-fits-all” trading strategy that many others will. It is more of an attempt to open your eyes to the various possibilities that can form a good pullback strategy. Try all these on a demo account and see what works best for you.
Like almost anything else technical analysis-related, these work better on higher time frames. Some of you will find trendlines to your liking, while others will like using Fibonacci. But here's a better question: "Have you ever thought about using multiple tools?" The best traders I know will be able to use all these interchangeably, recognizing that they are all crucial, and the more of these that line up in the same direction, the better off you are with your trading results. Why trade for one reason when you can trade for three or four? Remember, you need other people pushing in the same direction you are to profit. The more obvious a setup is, the more likely you will have enough people driving the trade in your direction. In fact, some of the best traders I know can't be bothered taking a trade unless there are at least three reasons to do so, and even then, they considered to be a lacklustre opportunity as opposed to the ones that light up for five, or even six different reasons.
Find the right combination for you in demo trading, and then apply as many as needed with your live account. You'll be glad you did because pullback trading essentially buys a currency when it's "on sale."
The Pullback in Forex
Foreign exchange (Forex) trading involves anticipating the fluctuating exchange rate of a currency, and as it is a highly liquid, dynamic market, Forex pullbacks occur frequently.
Pullback trading within the Forex market involves going long on a currency pair in an overarching uptrend after a brief retracement. The entry order is placed just above the pullback high as soon as a bullish engulfing pattern can be identified, and stops are placed below recent support levels. A moving average hourly chart can be used to precisely time entry, by holding on for a pullback to the 20 or 50 period.
Pros and Cons of Pullback Trading
Here are the key benefits and drawbacks of implementing a pullback trading strategy:
Pros:
- Pullbacks can deliver great risk-to-reward setups.
- Entry is enabled at the most attractive price point.
- A pullback can confirm the strength of a trend.
- Oversold conditions provide a good indicator of high-probability entries.
- Pullbacks can occur in every type of market (uptrend or downtrend).
- As a pullback trend extends, sizable moves can be captured.
Cons:
- Advanced skills are required to identify real pullback opportunities.
- If a trend reverses, this can trigger a major loss.
- Substantial price volatility can end up stopping out a pullback.
- It can be challenging to time entry points correctly, requiring a lot of experience.
- Pullbacks work best in strong trends, but the conditions are only sometimes favourable.
- Wins can be limited by pullbacks developing into reversals.
Pullback vs. Reversal
While a reversal occurs when an uptrend changes course, kicking off a new downtrend, a pullback is more of a blip on the radar – a minor dip in an established uptrend.
In a reversal, the trader will sell and exit before the price can fall further, whereas, for a pullback, the trader will enter by buying on the dip before the retracement.
The primary risk involved in pullback trading is mistaking a major reversal for a short-term
consolidation before the uptrend resumes. To get it right, you can check the trendline. In a reversal, the price will break the support level, whereas in a pullback, it will bounce back from the support level. Another indication of a reversal is that a downturn will exceed the Fibonacci level. Meanwhile, a pullback will retrace under 61.8%.
Pullbacks also have a shorter duration, tending to last just hours or days, while a reversal is more sustained and can go on for more extended periods of weeks or even months.
Bottom Line
A pullback strategy offers great opportunities for entering established uptrends and capitalizing on their momentum at the optimal time following a dip. However, success relies on precision timing and the ability to differentiate between a pullback and a reversal, which can be achieved using oscillators like RSI, Fibonacci, and trendlines.


