Table of Contents
Affiliate Disclosure
Affiliate Disclosure DailyForex.com adheres to strict guidelines to preserve editorial integrity to help you make decisions with confidence. Some of the reviews and content we feature on this site are supported by affiliate partnerships from which this website may receive money. This may impact how, where and which companies / services we review and write about. Our team of experts work to continually re-evaluate the reviews and information we provide on all the top Forex / CFD brokerages featured here. Our research focuses heavily on the broker’s custody of client deposits and the breadth of its client offering. Safety is evaluated by quality and length of the broker's track record, plus the scope of regulatory standing. Major factors in determining the quality of a broker’s offer include the cost of trading, the range of instruments available to trade, and general ease of use regarding execution and market information.

GBP/USD - Will We See 1.6700 Again Soon?

By Colin Jessup
Colin Jessup is certified in both Securities & Technical Analysis from the Canadian Securities Institute, founder of Omegatrader Canada and a Live Trading Coach at TheTradingCanuck.com, a service that calls live trades to captures dozens of pips daily with low drawdown.

By: Colin Jessup

The USD weakened a little more today after the FOMC's Fisher & Plosser expressed different views on the US economy's future. Fisher believes interest rates will need to be adjusted before 2013 while Plosser is optimistic that the US economy will grow 3% before the end of the year. This comes as good news to anyone who is bullish on the pound right now.

When we look at the 4 hour chart we see that a bullish engulfing long shadow has formed off of daily support level at 1.6344 and closed above the next daily resistance zone of 1.6500. Price action will almost definitely retrace back to this level in the Asian session before resuming its bullish run during the UK and New York sessions. When using a Fibonacci tool on today's price action, note that the previous resistance level of 1.6500 has now turned to support, and is the 38.2% retracement level...adding to the strong possibility that this level will hold. Should price break below the 1.6500 level we could see a retracement to 1.6450 where we see a 4 hour ascending trend line established starting on August 10, 2011, and allot of 'traffic' to the left, this will be a hard level for the bears to break through.

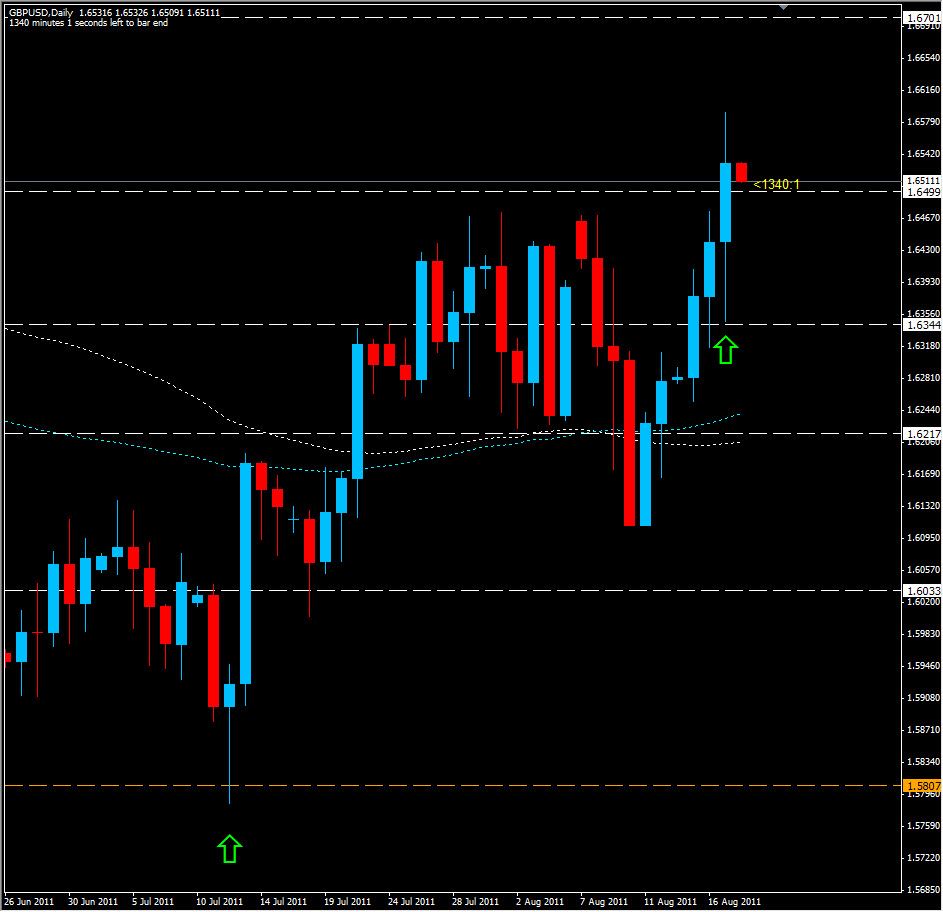
Daily time frames paint a similar picture having formed a power candle off of the 1.6344 level, mirroring the 4 hour price action almost perfectly. The 100 EMA has crossed over the 62 SMA also indicating that price could move higher. If price can hold above 1.6500 we should see a free run up to the 1.6700 level with a technical vacuum from current price all the way up. A fibo extension draw from the low of 1.5786 established on July 12 to today's high indicates we could see 1.6900 if we break above 1.6700.

GBP Analysis, August 18, 2011

GBP 4 Hour Chart, August 18, 2011

Colin Jessup
About Colin Jessup
Colin Jessup is certified in both Securities & Technical Analysis from the Canadian Securities Institute, founder of Omegatrader Canada and a Live Trading Coach at TheTradingCanuck.com, a service that calls live trades to captures dozens of pips daily with low drawdown.
 

Most Visited Forex Broker Reviews