By: Doug Rosen
In yesterdays analysis I stated I was bearish on this pair, yet I also mentioned that we were merged with the weekly 233 ema and we were sitting in the zone between the 38.2 and 50.0 fib to the upside. Today, we are just a bit above the level we were at yesterday. We are also back within the Bollinger Bands and sitting above the lower band that I believe could give price a slight lift.
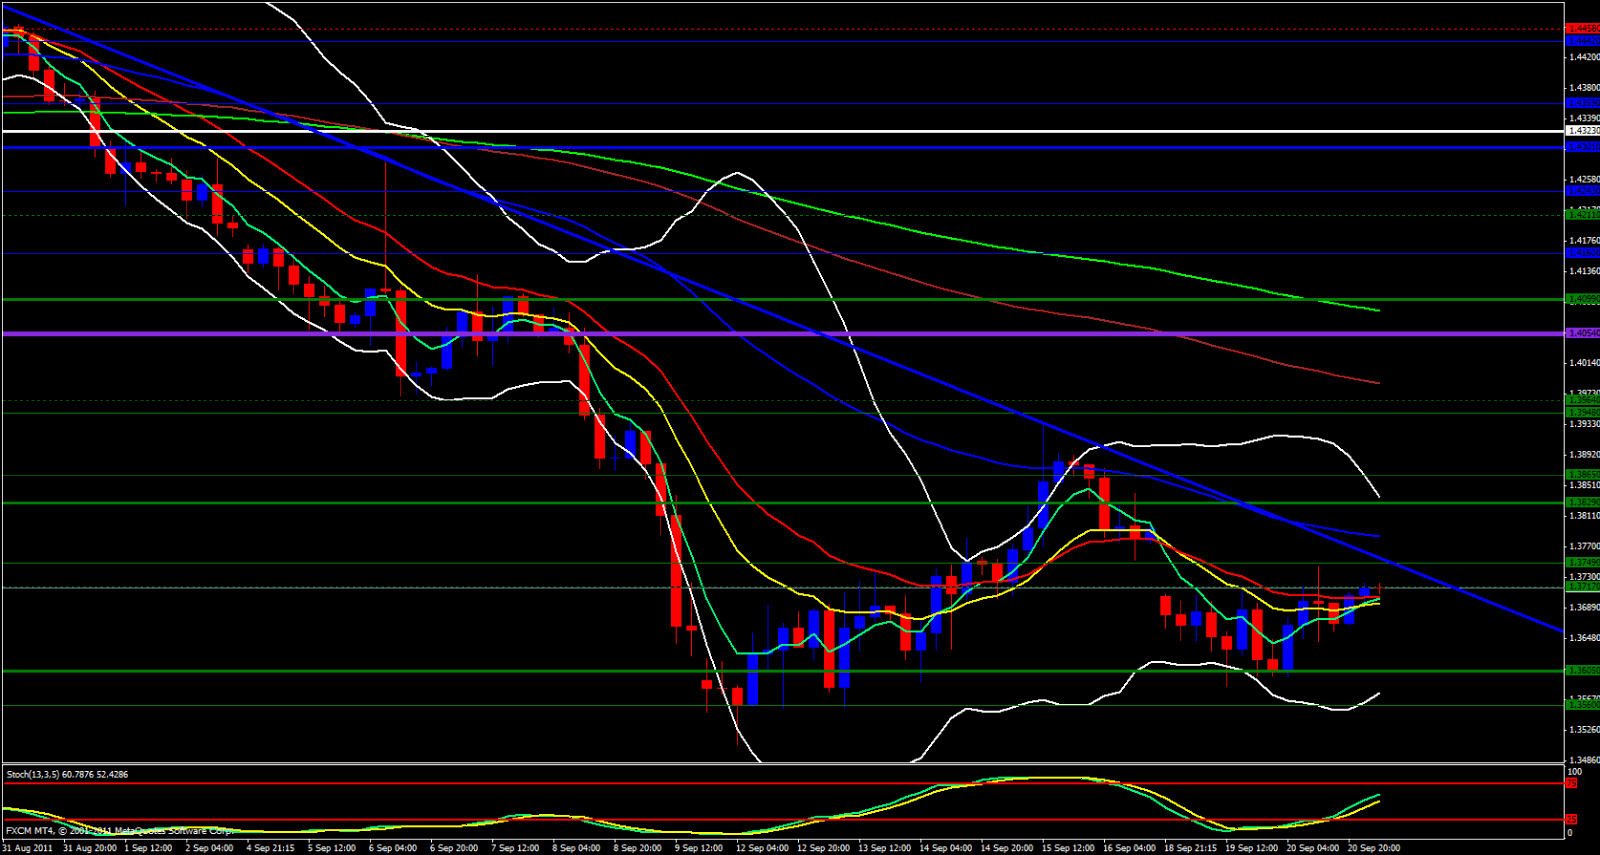
Looking at the daily chart I see that yesterday made a higher high and a higher low of the previous day and the Stochastic is close to the oversold zone. The daily candle is just above the 5 ema and it appears the 5 ema wants to give price a boost.
I use other pairs when I do my analysis to determine relative strength based on correlation. I look at the EUR/CHF and I see that the EUR continues to be bullish against the CHF. Next, I look at the USD/CHF and I see that on a weekly chart price is at a 38.2 fib of the recent swing down, overlapped with a 55 ema. This tells me that the USD/CHF may be coming up to resistance, a push down could cause some USD weakness. I am also looking at the USD/CHF pivots and all in all I see some monthly reversal pivots and even weekly not too far up. Taking a quick peek at the EUR/GBP I see that it has fibbed on the daily chart and the daily 5 ema is attempting to cross the 13 ema.

Looking at the lower timeframes such as the 4 hour, 1 hour and 15 minute the EUR/GBP looks bullish. Bullish on this pair means a stronger EUR just as bearish on the USD/CHF means a weaker USD so based on all this I will be bullish on EUR/USD today.
Looking at the 4 hour EUR/USD I see that the 5 ema cas crossed the 13 ema and price is rising above the monthly M0 so this pair may be back on the rise. We are however, 35 Pips away from a trend line so we will see if it breaks. Not far above the trend line is a 55 ema so we must be careful.

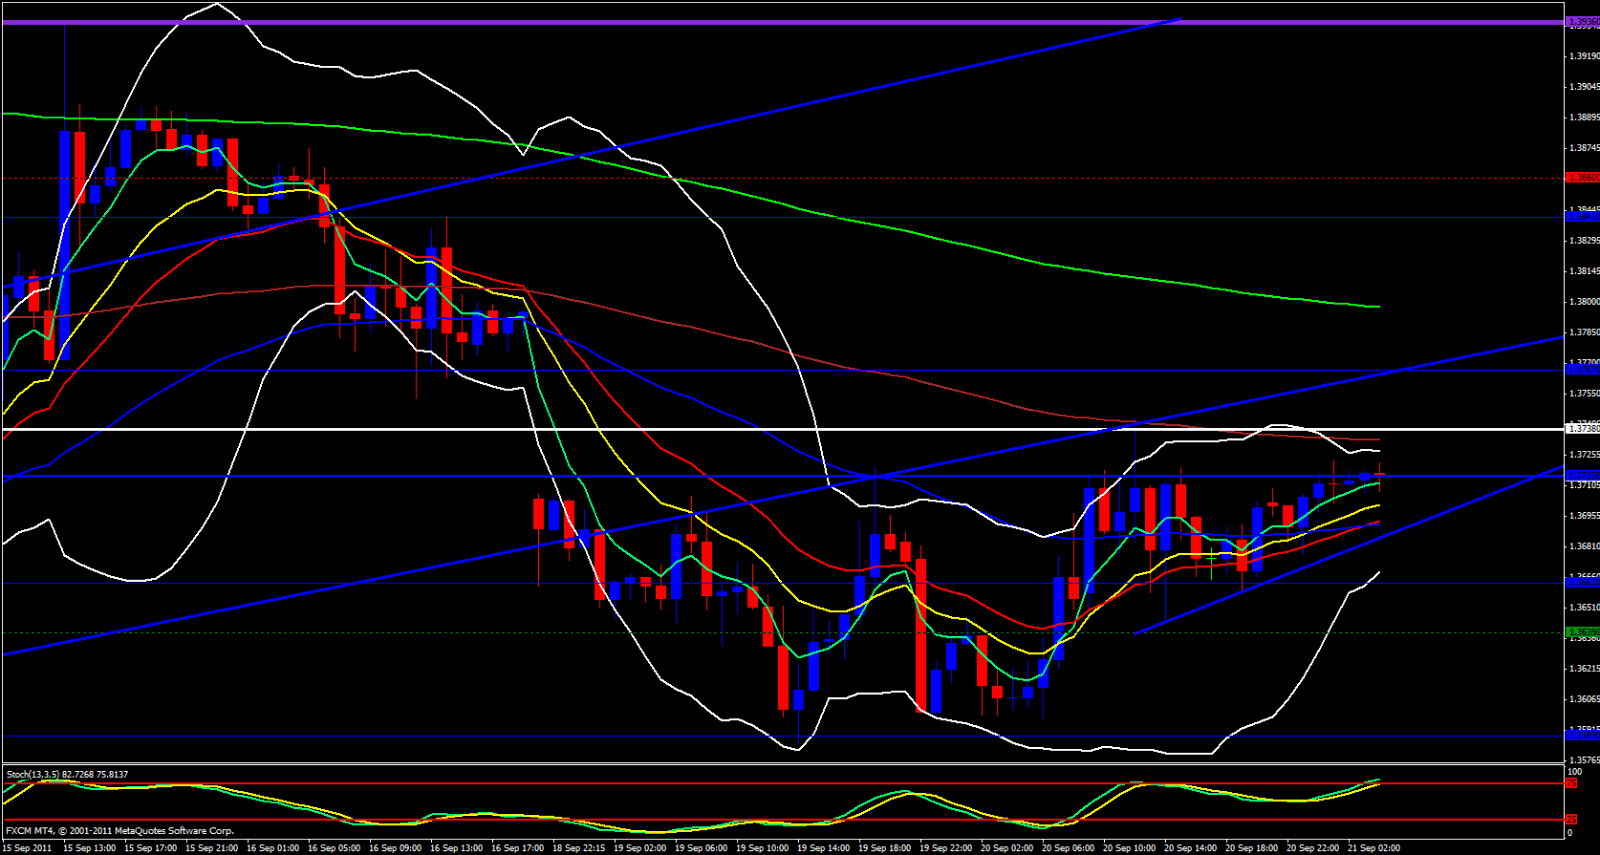
Moving over to the 1 hour chart we are riding the 5 ema but heading towards strong resistance. We have the upper Bollinger Band just above price and it has not yet opened and just above that is a 144 ema and the Weekly Central Pivot, There will certainly be bears in this area. Hourly Stochastics also is just entering the oversold zone. We have a bit of a mixed bag of signals here.

I am looking at the 15 minute and I see price is bouncing off a trend line overlapped with a 21 ema, but, the daily M3 is just above price at 1.3722 and the upper Bollinger Band is above price closing in on price. There will be bears in this region and hopefully a slight break above the daily M3 could trigger some stop losses from the bears forcing price up and causing a breakout from the trend line on the 4 hour chart and hopefully bust the 55 ema, otherwise, I would keep my eye on the EUR/GBP and USD/CHF and watch for a sudden change in relative strength. If the USD appears to be getting stronger and the EUR appears to be getting weak, then look for shorts in the 1.3745 region. If there isn't a change in relative strength, take a pullback off of resistance and take the long.
