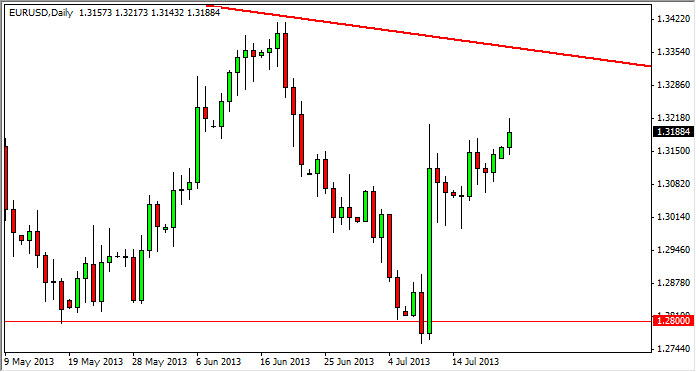
The EUR/USD pair tried to rally during the Monday session, but as you can see gave back quite a bit of the gains in order to form something along the lines of the shooting star. This market of course is one that I think is having a "two speed moment", as short-term traders will certainly see a bullish opportunity in this market overall, while a longer-term trader may see that we are forming a very bearish pattern at the same time.
Because of this, I feel that it really comes down to which timeframe you choose to trade. The shorter timeframe trader will see that the most recent sessions all look like hammers or at least supportive action, and as a result they will more than likely look to be buying. However, when you look above, I see a downtrend line from the weekly chart that is somewhere around the 1.33 handle. With that being the case, I think the longer-term trader will look at that is an excellent place to sell. In other words, we could have a situation where the shorter-term trader will be "handing off" control of the market to the longer-term trader of that that general area. The buyers will take a step back, while the sellers take control. This happens over and over in markets, something commonly called support and resistance.

The descending triangle
The descending triangle that I see on the longer-term charts tells me that the 1.28 level is the "floor" of the market. The level will be supportive, but there is the possibility that it breaks down. If it does, I fully believe that we will eventually see the 1.20 level or so get hit. Obviously, the 1.25 level will be supportive based upon the large round number aspect. But in the end I think this market will chop around in this decision that will be made sometime in September, probably as a result of whether or not the Federal Reserve begins to taper off of quantitative easing. Until then, expect a lot of back-and-forth action - something that this pair has proven itself to be very good at.

