In my last analysis one weeks ago, I concluded by predicting:
What will be key will be whether the zone between 1.0274 and 1.0244 is taken out decisively to the downside. If it is, we can expect to see a test of the bullish trend line. However, if it holds well, we might get some upwards momentum taking us back up to the resistance zone at around 1.0430-43, and if this is broken decisively to the upside then the bulls will be back in full control.
If we not get any dramatic reversal candles, it will be best in the meantime to look for longs off any failed tests of 1.0274, and shorts off any failed tests of the area around 1.0430.
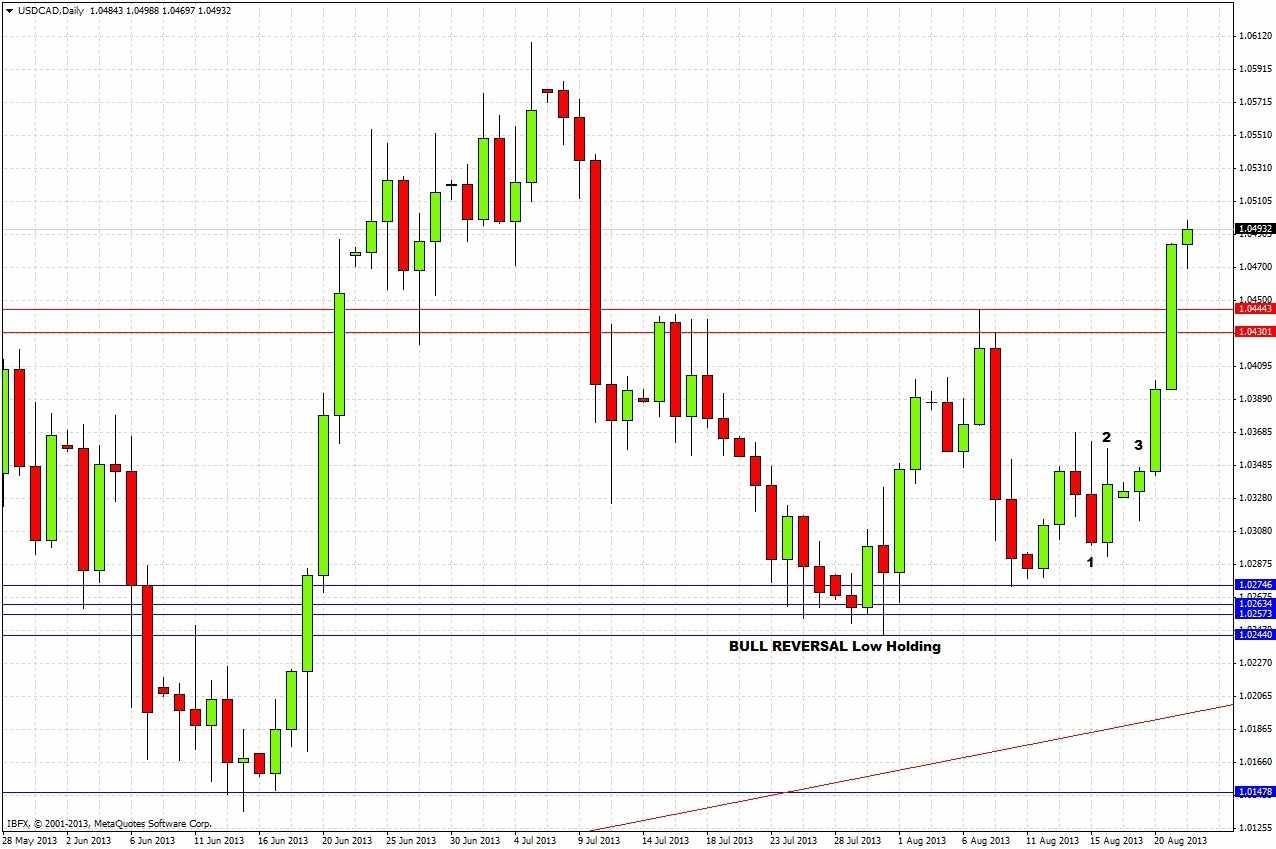
Let's look at the daily chart since then to see how things turned out:

The day of my prediction is marked at 1. The very next day, marked at 2, was a bullish reversal candle. It broke to the upside 2 days later, marked at 3, and since then it strongly broke through the resistance zone at 1.0430. The support zone held, in fact it was not even tested, so the prediction was accurate.
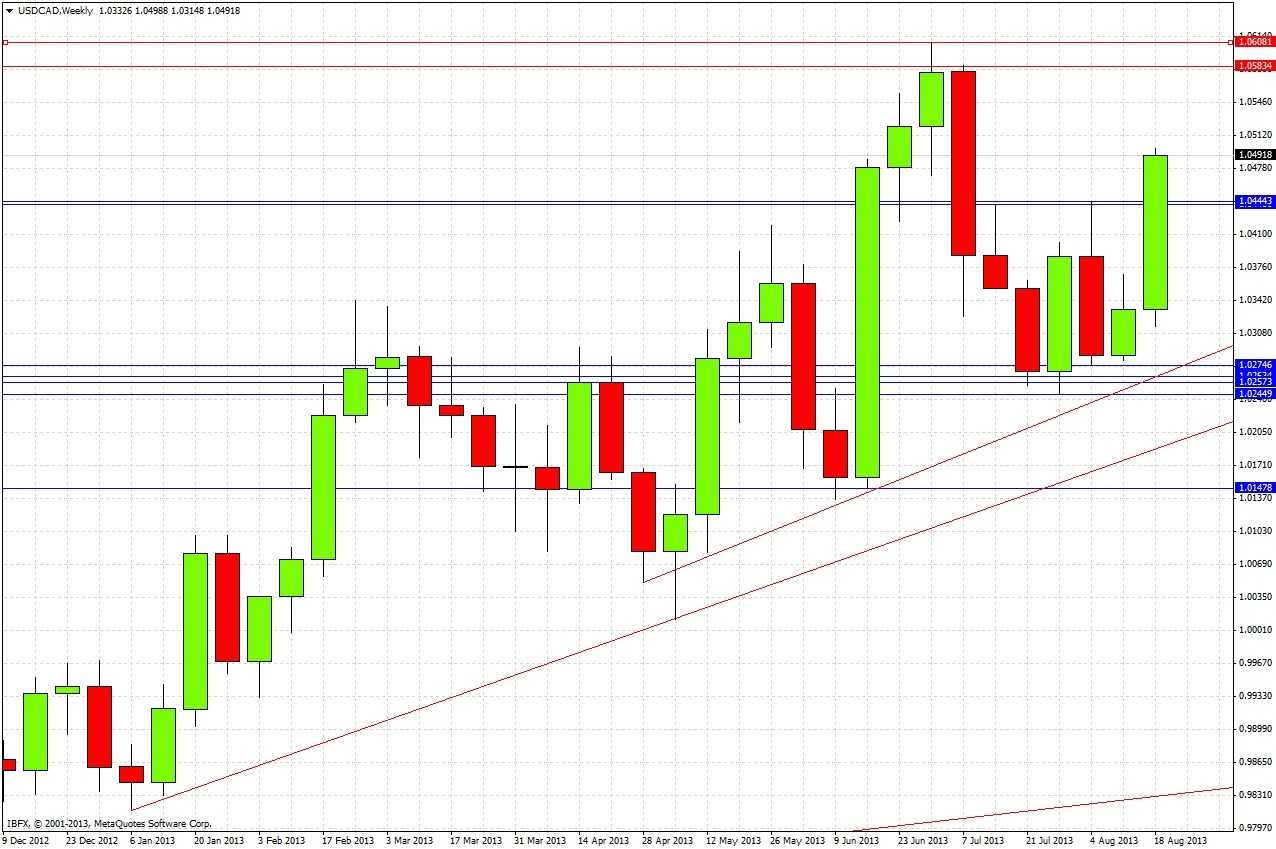
Turning to the future, let's take a look at the weekly chart:

The chart shows that this current week has formed very bullishly so far, breaking out of the upside of last week's bullish inside candle. Another bullish supportive trend line can be drawn above the previous one (the higher red angled line). There is resistance overhead at about 1.0583. It might be that the resistance zone at 1.0444 has now turned into support.
So, for an overall trading plan, for the time being bulls are firmly in control. Momentum is strong so it is possible to trade pullbacks long. The obvious zone to wait for would be a test of 1.0444 which might act as good support. Alternatively, if the price moves very quickly up to the resistance zone at 1.0583, a failed test and a retest of that level could provide a good short opportunity. That zone is part of a high that has held since October 2011.
If you are holding a long, aiming for 1.0575 as a target would be a good idea.
Should price fall very quickly back below 1.0440, which would be unlikely, it would be better to wait for a return to the higher trend line before going long.
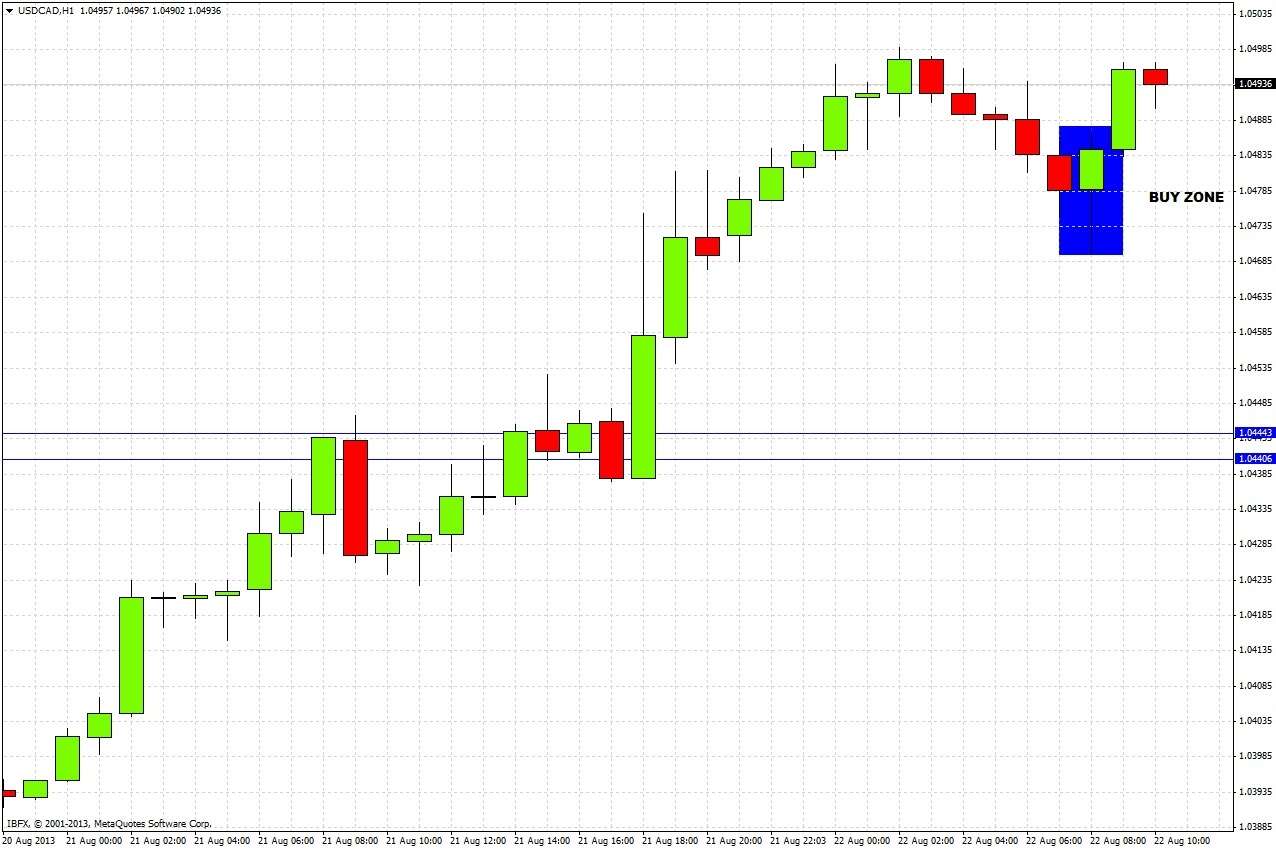
We just had a bullish reversal candle after a pullback on the hourly chart, so this could be a good buy zone for day trading today (watch out for the USD news a bit later): < style="font-family:arial,helvetica,sans-serif;">

