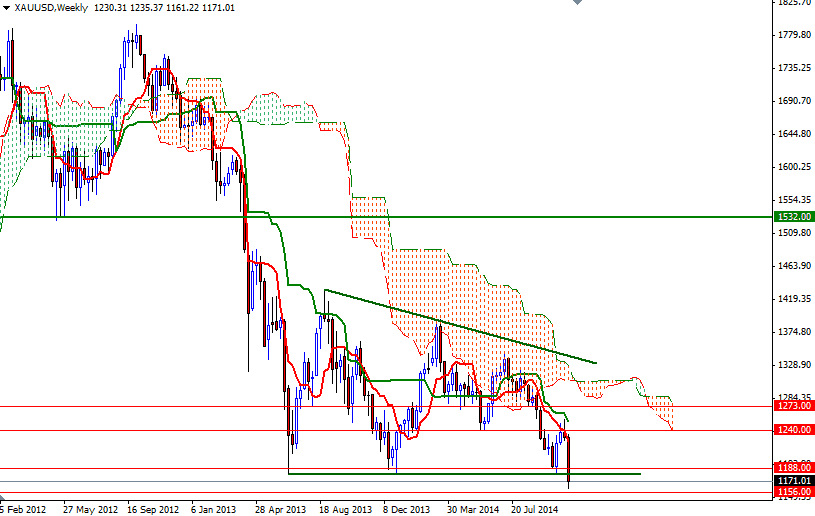
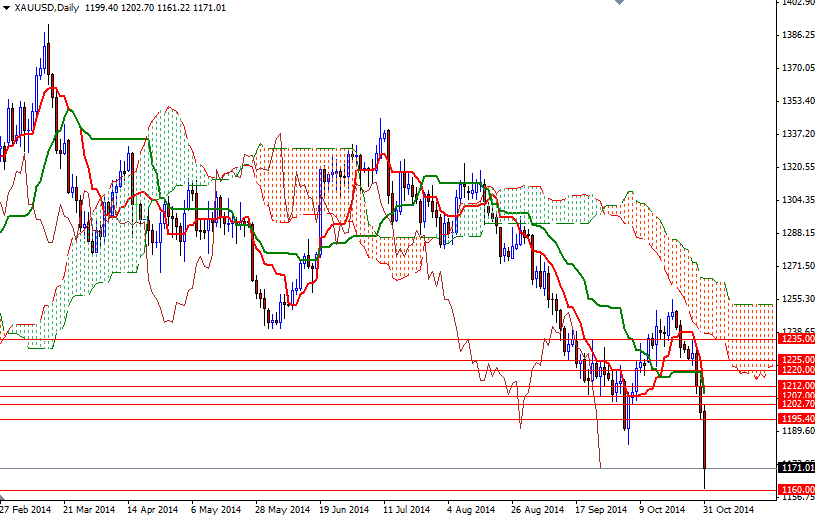
The price of gold bullion tumbled another $29 per ounce on the last trading day of the week and the month as investors liquidated bullish bets after the American dollar got a boost from the Bank of Japan's unexpected decision to expand its already massive monetary stimulus program. Japan’s plans to ramp up purchases of financial assets (to ¥80 trillion from the previous target range of ¥60 trillion to ¥70 trillion) and the news that Government Pension Investment Fund will double its allocation to domestic and foreign stocks sent gold prices below the 2013 low of $1180.21.
Although gold started the month with a bullish tone, the initial rally faded after the bulls run out of steam around the critical 1252/60 resistance zone. But of course technically this wasn't a big surprise because we had identified this area as a strong barrier which would attract some serious sellers. Aside from the negative technical outlook, lack of safe-haven demand brought a certain amount of pressure to the market. Moreover, low inflation expectations, steadily improving U.S. economic data and the Fed's shifting stance will continue to work against gold.
Last week's candle looks pretty interesting because the market finally shattered an important support area which was the bottom of the descending triangle (a bearish formation that usually forms during a downtrend as a continuation pattern). Dropping below the 1180 level is clearly a bearish sign and suggests that gold prices (XAU/USD) will continue to decline but it is also possible to see a bounce before drifting lower. Technically speaking, when a strong support (or resistance) line is broken, the market may respond and revisit it before resuming the trend. If that is the case, expect to see resistance at 1180/8, 1195.40 and 1220/5. However, if the bears can maintain the control, I think (based upon the measurements) their new targets will be 1156, 1127 and 1088.


