USD/JPY
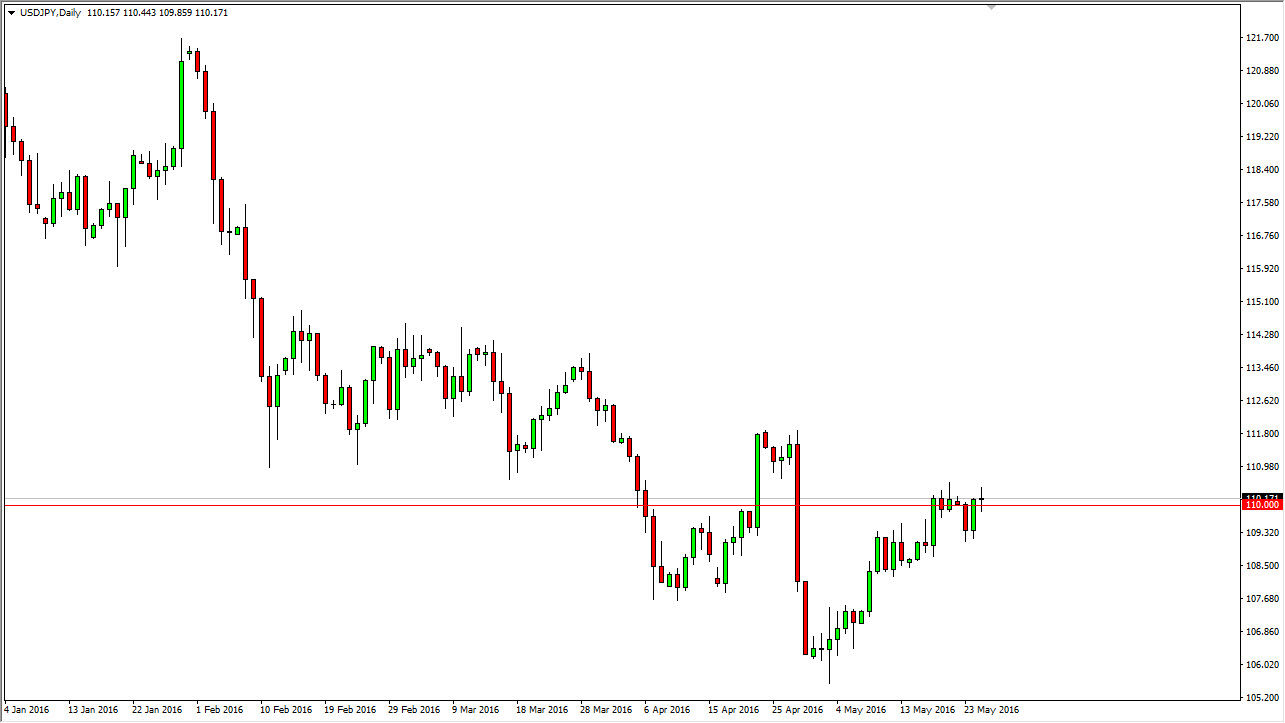
The USD/JPY pair went back and forth during the course of the day on Wednesday, as we continue to meander around the 110 level. If there is a chart that is indicative of how quiet the Forex markets are at the moment, this is the poster child. After all, we just simply continue to grind around this big figure and wait to see which direction the market uses to go. I think that if we can break above the top of the shooting star from last week, we could very well reach towards the 112 level, but a move above there is going to be difficult. At the same time, I can also say that if we break down below the bottom of the candle for Wednesday, we will more than likely reach for the 109 level. Either way, I’m not expecting much of a move over the next several sessions.
AUD/USD
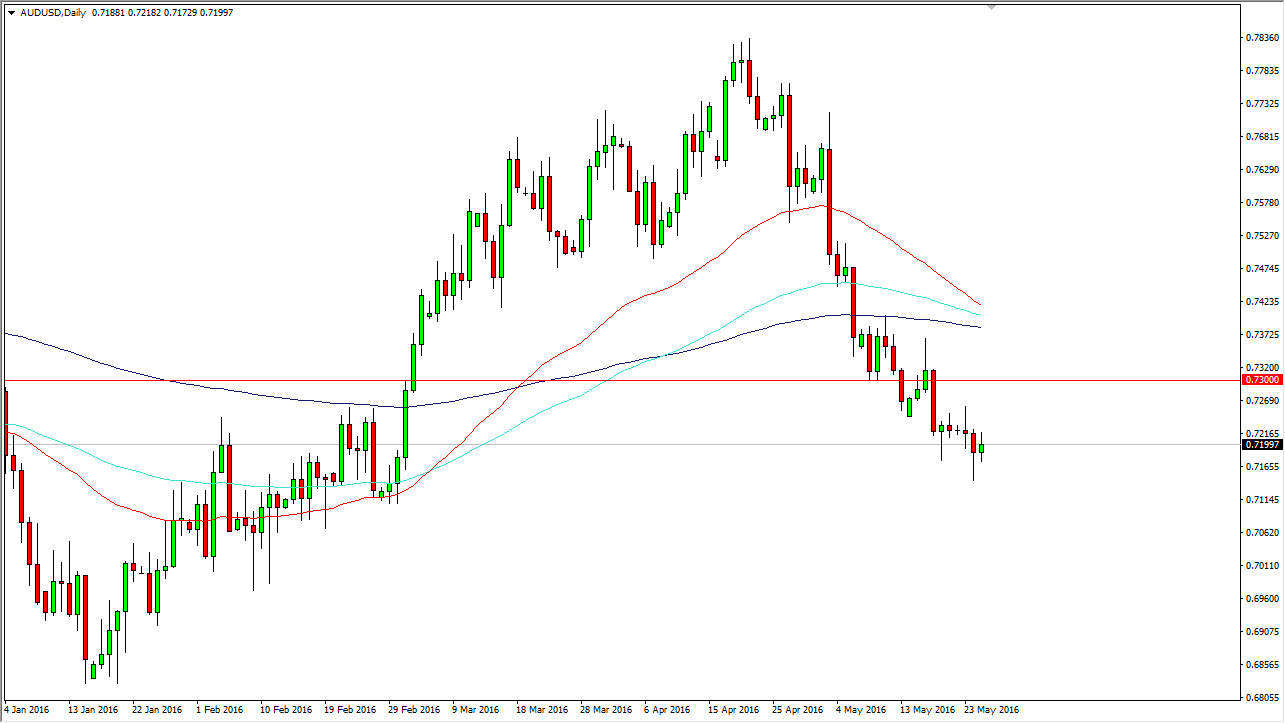
The AUD/USD pair had a fairly neutral day as well, but unlike the USD/JPY pair there are potential longer-term signals in play. On this chart, you can see a red, green, and black moving average displayed. This is the 50, 100, and 200 Exponential Moving Averages plotted, and you can see that they are getting ready to cross again. They are getting ready to cross to the downside, and that’s extraordinarily negative. We don’t have that yet, but it is most certainly something that I am paying attention to.
While I am not necessarily a huge proponent of moving averages, I do recognize that these 3 particular moving averages tend to be followed by longer-term traders. It’s likely that any rally at this point in time will find quite a bit of resistance at the 0.73 level, and of course these moving averages, with special attention being paid to the black one which is a 200 day exponential moving average. With this, I’m looking to sell weakness after a short-term rally, or a break down below the bottom of the hammer from the Tuesday session.


