The difference between success and failure in Forex trading is very likely to depend upon which currency pairs you choose to trade each week, and not on the exact trading methods you might use to determine trade entries and exits. Each week I am going to analyze fundamentals, sentiment and technical positions in order to determine which currency pairs are most likely to produce the easiest and most profitable trading opportunities over the next week. In some cases it will be trading the trend. In other cases it will be trading support and resistance levels during more ranging markets.
Big Picture 30th April 2017
Last week, I predicted that the best trade for this week was likely to be long the British Pound and Japanese Yen, and short of the U.S. Dollar. This trade was a little unprofitable, as although the GBP/USD currency pair rose by 1.09%, the USD/JPY currency pair also rose, by 2.35%, producing an overall loss of 0.63%.
The Forex market is in a more settled mood, but this week will see the FOMC Statement and Non-Farm Payrolls, the most crucial events in the calendar, which are always capable of producing surprises and big turns in the market. As for political developments, the French election looks as if it will be comfortably won by the centrist candidate, although the Euro is finding it hard to rise any further yet. There is still tension over Korea but North Korea has failed again to get a new missile launched into the atmosphere. President Trump’s team has announced a plan to cut corporate tax to 15%.
Ahead of the key U.S. releases, the greenback has shifted into neutral, with the British Pound the most clearly strong currency, while the Canadian and New Zealand Dollars are clearly weak. The U.S. Dollar should be flat until the FOMC release. Therefore, I suggest that the best trade of the coming week will be long the British Pound, and short of the U.S., Canadian, and New Zealand Dollars.
Fundamental Analysis & Market Sentiment
The major elements affecting market sentiment this week are likely to be the FOMC Statement and Federal Funds Rate, followed by Non-Farm Payrolls data.
Technical Analysis
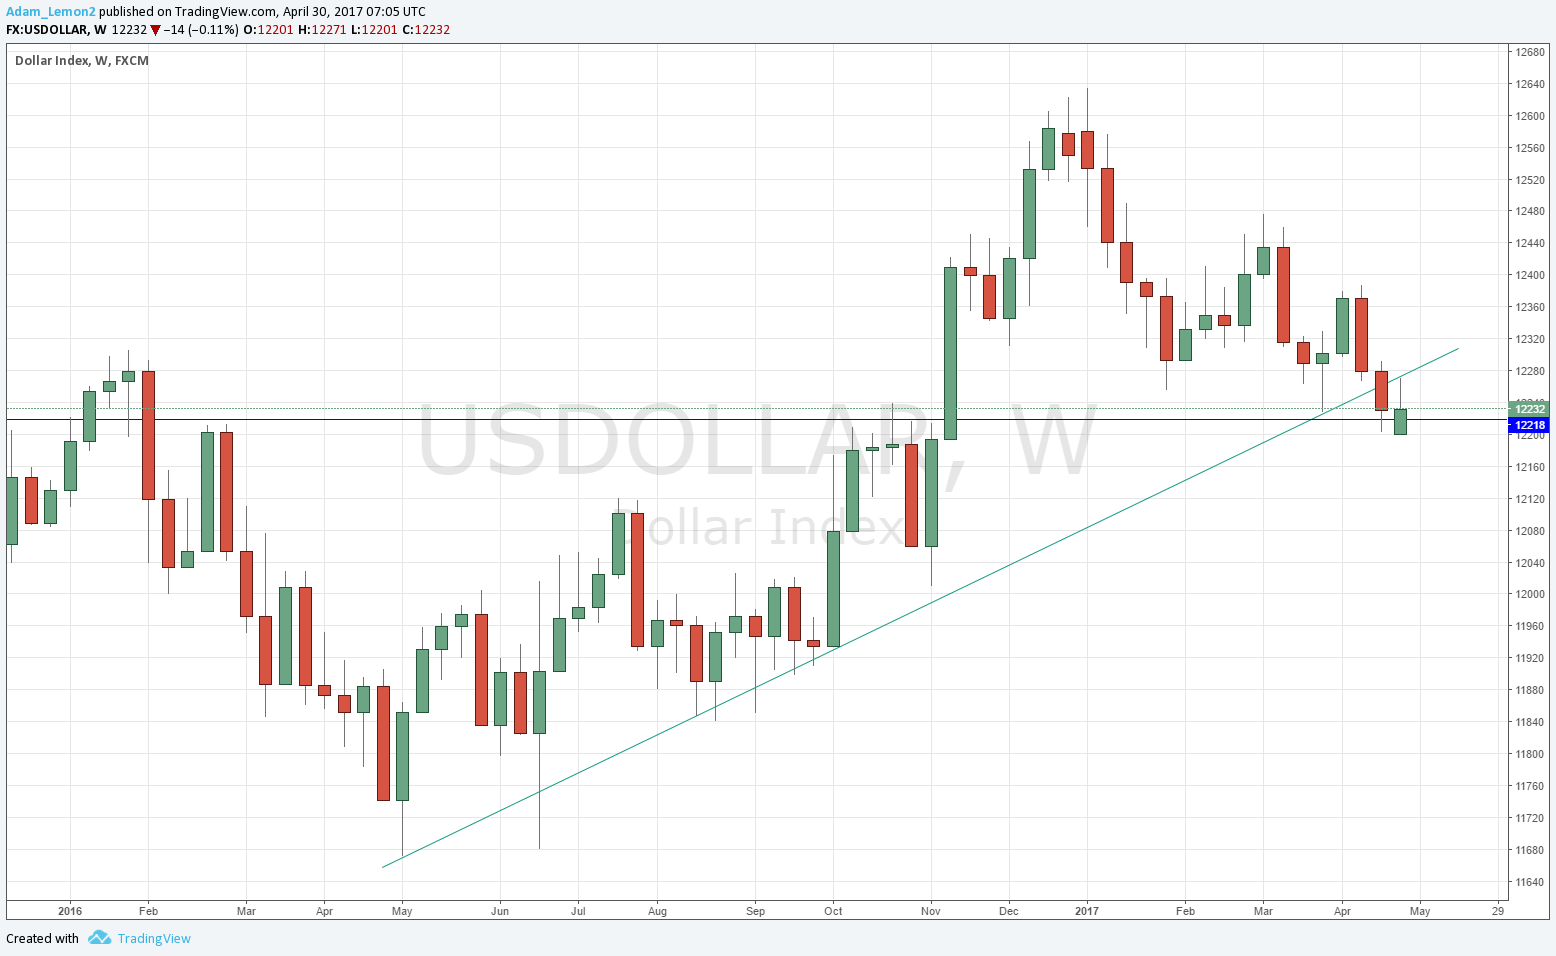
USDX
The U.S. Dollar printed a slightly bullish candle this week following an opening gap up after the weekend. It is a small and very inconclusive candle that tells little. The bullish trend line is broken. The price is lingering within an area I had identified as supportive, shown by the blue line in the chart below. The price is still below its level from 3 months back. The signs are bearish, but it would not be a surprise if the bearish movement fails here, at least for a short while. Alternatively, a break below 12218 could trigger a sharp fall in the greenback and a more decisively bearish outlook.
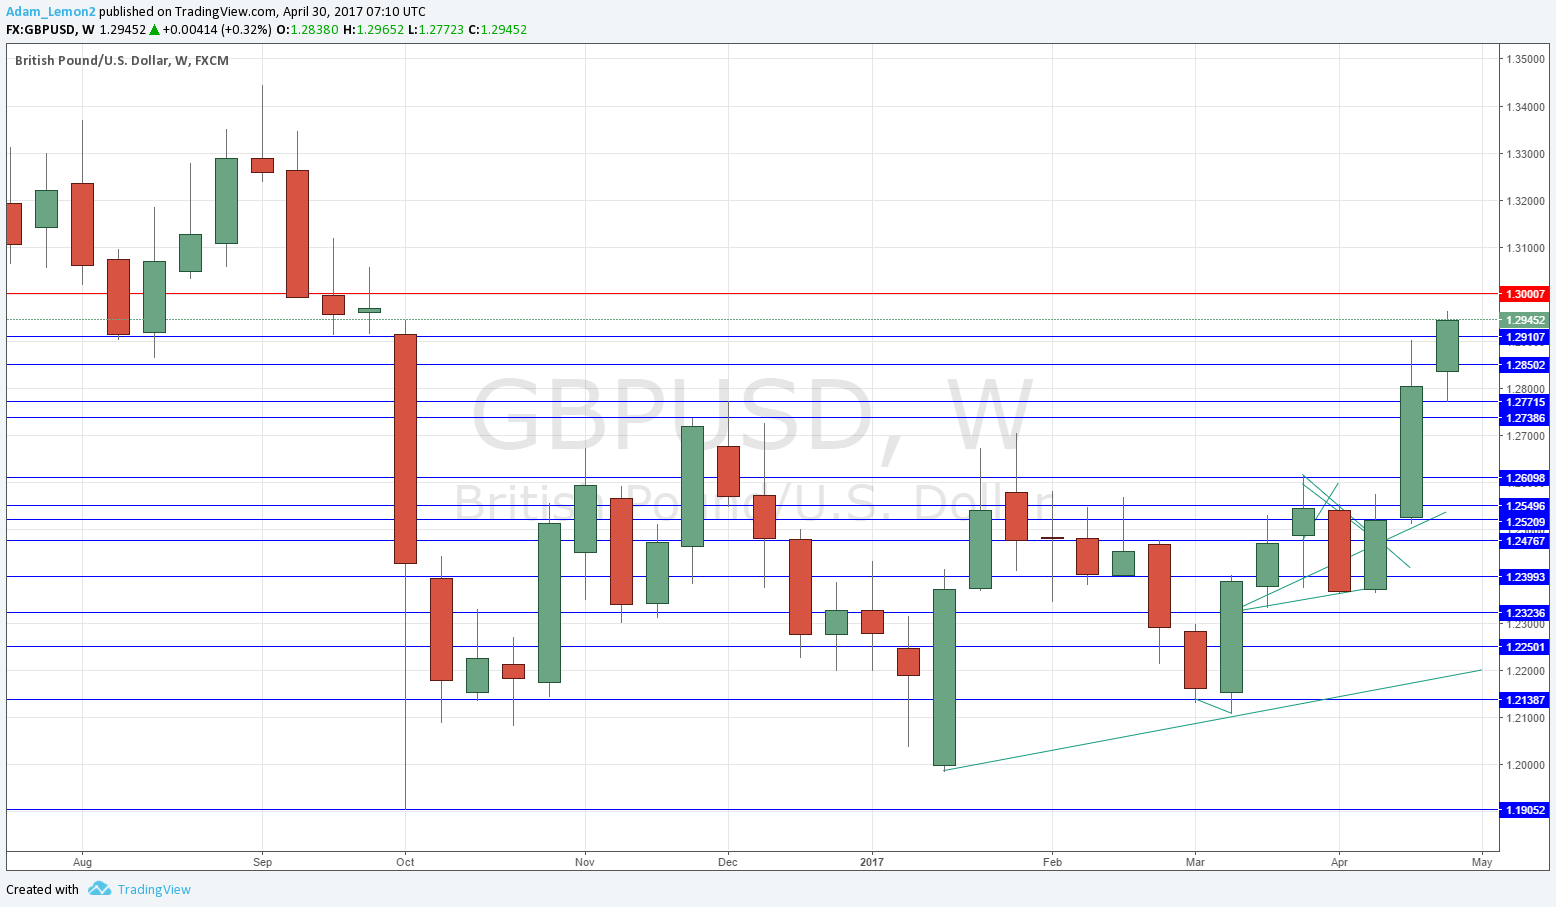
GBP/USD
The weekly chart below shows that this currency pair remains in a strengthening upwards trend, printing a strongly bullish candle which continued a breakout from a long-term consolidation area and made a new 6-month high. The price is also above its recent historical levels from both and 3 and 6 months. The candle closed very near its high, which is a bullish sign. However, the price is now very close to a confluence of a large round number as well as historical congestion around 1.3000, so this upwards thrust may not have a great deal further to run over the short term.
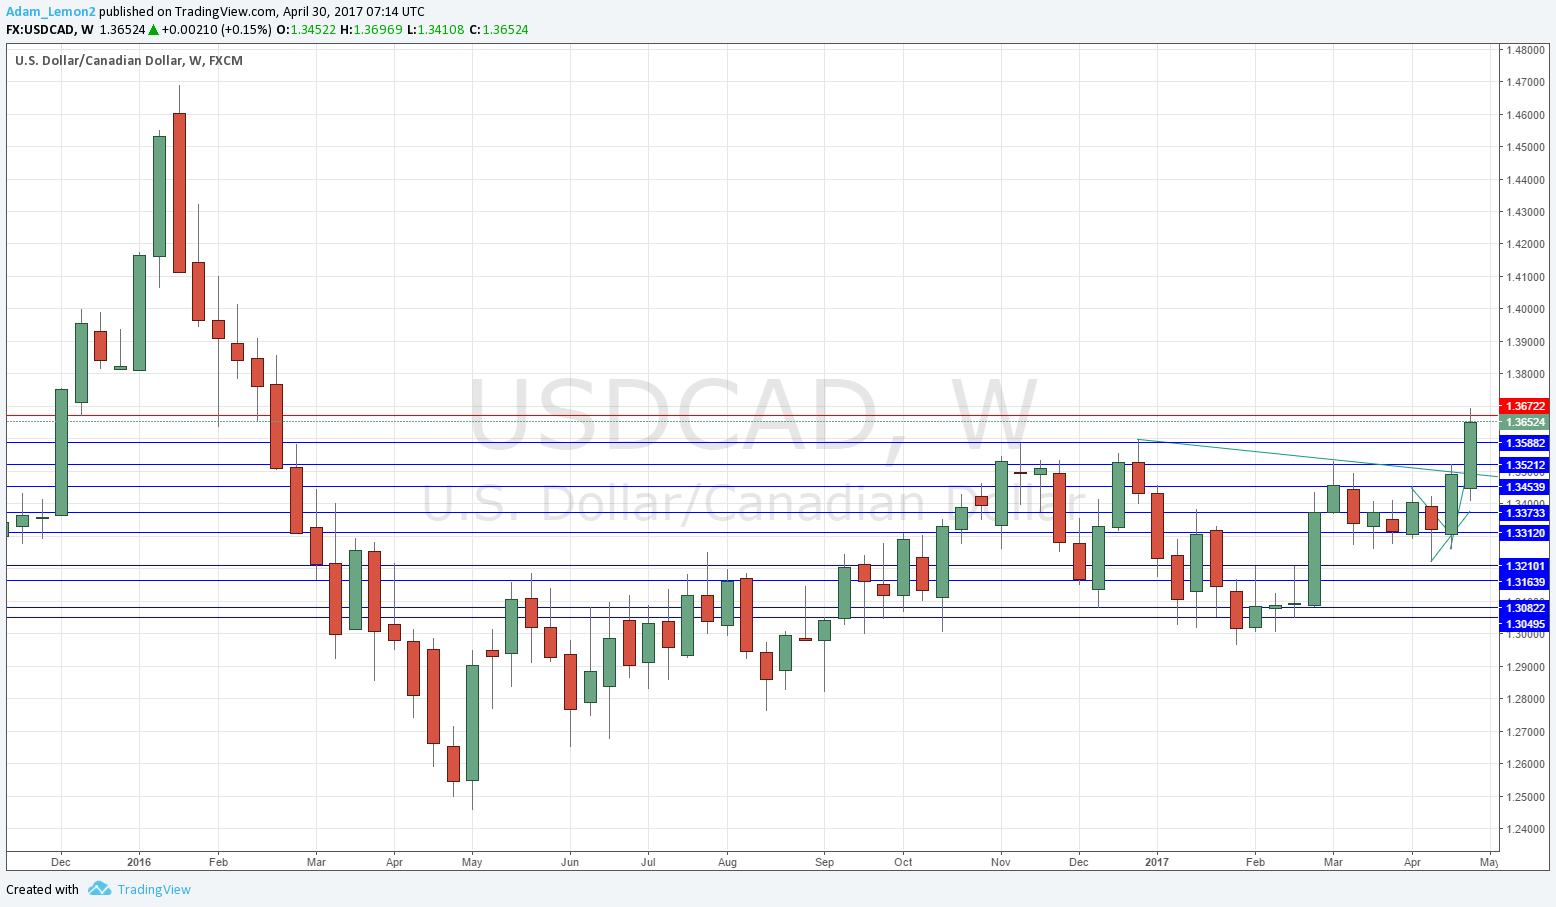
USD/CAD
The weekly chart below shows that this currency pair has regained a very long-term and strengthening upwards trend, printing a strongly bullish candle which continued a breakout from a long-term consolidation area and made a new 1-year high. The price is also above its recent historical levels from both and 3 and 6 months. The candle closed relatively near its high, which is a bullish sign. However, the price may have been held back by a key resistance level at 1.3672, so this upwards thrust may not have a great deal further to run over the short term.
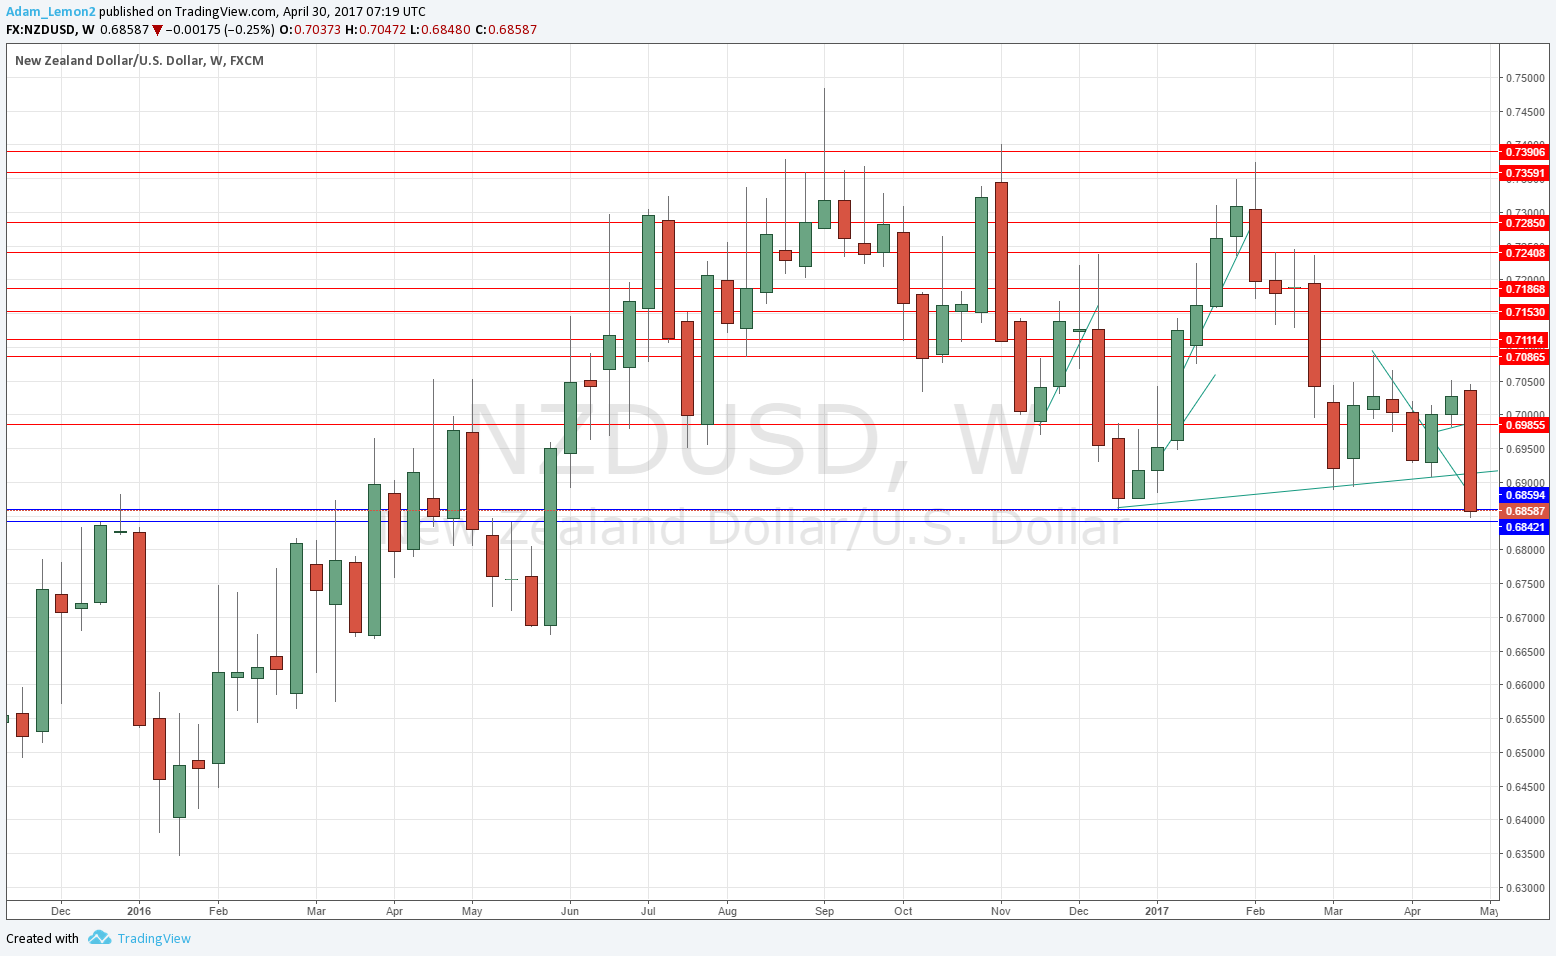
NZD/USD
The weekly chart below shows that this currency pair has gone back into a bearish trend trend, printing a strongly bearish candle which made a new 9-month low. The price is also below its recent historical levels from both and 3 and 6 months. The candle closed very near its low, which is a bearish sign. However, the price is now very close to a key supportive inflective area centered upon 0.6850, so this downwards thrust may not have a great deal further to run over the short term. I am less optimistic about this pair than the other two I have highlighted.
Conclusion
Bullish on the British Pound; bearish on the U.S., Canadian, and New Zealand Dollars.


