The difference between success and failure in Forex trading is very likely to depend upon which currency pairs you choose to trade each week, and not on the exact trading methods you might use to determine trade entries and exits. Each week I am going to analyze fundamentals, sentiment and technical positions in order to determine which currency pairs are most likely to produce the easiest and most profitable trading opportunities over the next week. In some cases it will be trading the trend. In other cases it will be trading support and resistance levels during more ranging markets.
Big Picture 30th September 2018
In my previous piece last week, I forecasted that the best trades would be short AUD/USD and long of the S&P 500 Index above the previous week’s high price. These trades finished positive: the AUD/USD currency pair fell by 0.51% over the past week, and the S&P 500 Index did not break its previous week’s high price, producing an average win of 0.25%.
Last week saw a rise in the relative values of the U.S. Dollar and the British Pound, and a fall in the relative value of the Swiss Franc and Japanese Yen.
Last week’s Forex market was dominated by strong U.S. economic data releases, which strengthened the U.S. Dollar and weakened “risk-off” assets such as the Swiss Franc, Japanese Yen, and the Euro.
Fundamental Analysis & Market Sentiment
Fundamental analysis tends to support the U.S. Dollar, as American economic fundamentals continue to look strong. Sentiment has turned back in favor of the Dollar, as the FOMC forecast was a little more hawkish than expected. Fundamentals are bearish on the Japanese Yen.
The week ahead is likely to be dominated by U.S. Non-Farm Payrolls and associated data.
Technical Analysis
U.S. Dollar Index
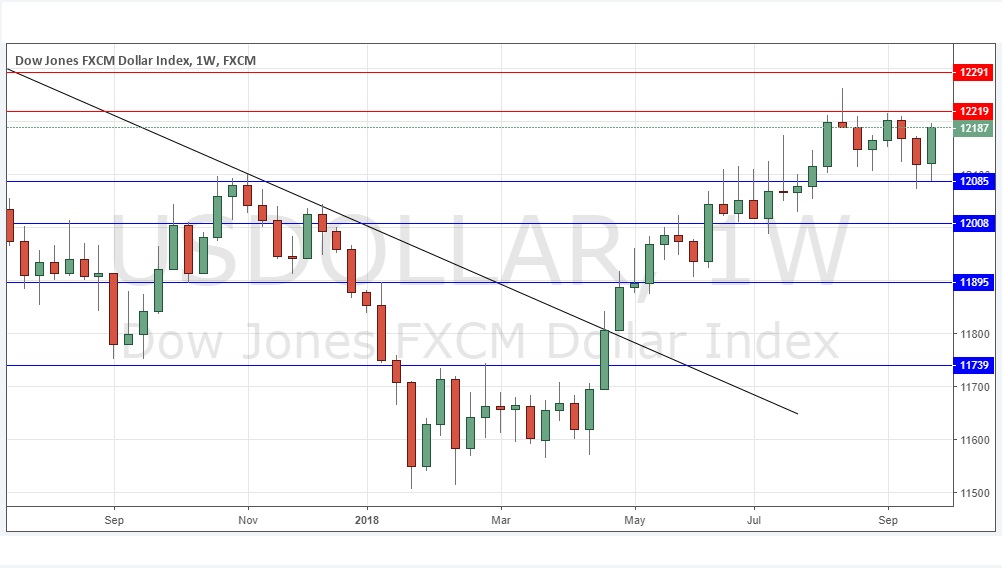
The weekly price chart below shows that after last week’s inability to break below the support level at 12085, the price rose over the week, printing a bullish candlestick, which closed near its high but still below the resistance level at 12219. The price has again remained within a relatively narrow band between support and resistance and has been within this zone over the past eight weeks. This suggests consolidation, but the action is bullish over both the short and long-term. This suggests that the U.S. Dollar is preparing for a bullish breakout above the first resistance level.
USD/JPY
This pair just printed a long and strongly bullish candle which closed very near its high price. These are all bullish signs. The price also closed at and reached its highest prices during the 2018 calendar year. Both fundamental analysis and market sentiment is supporting the long movement in this currency pair. It looks as if there will be an edge trading it long over the coming week.
WTI Crude Oil
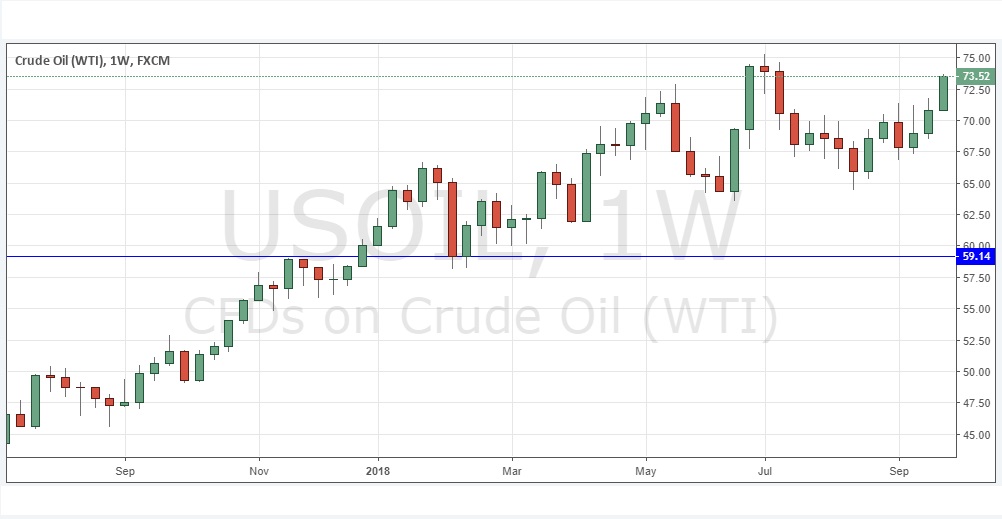
WTI Crude Oil has been in a long-term bullish trend. Recent months have seen deeper bearish retracements within that trend, but the trend is surviving. It looks as if the price is now going to make an attempt at the recent swing high price of $75.24. There will probably be strong resistance at that level and in fact a little below that at the key psychological level of $75.00. The levels may break, but it looks likely that a long trade here could be made until at least $75.00 is reached.
Conclusion
Bullish on the USD/JPY currency pair and on WTI Crude Oil to $75.00.


