The difference between success and failure in Forex trading is very likely to depend upon which currency pairs you choose to trade each week, and not on the exact trading methods you might use to determine trade entries and exits. Each week I am going to analyze fundamentals, sentiment and technical positions in order to determine which currency pairs are most likely to produce the easiest and most profitable trading opportunities over the next week. In some cases it will be trading the trend. In other cases it will be trading support and resistance levels during more ranging markets.
Big Picture 10th March 2018
In my previous piece last week, I was bullish on the GBP/JPY currency cross. Unfortunately, it closed the week down strongly, by 2.08%.
Last week’s Forex market saw the strongest rise in the relative value of the Japanese Yen, and the strongest fall in the relative value of the Canadian Dollar.
Last week’s market was more active and saw the start of something a new – a sell-off and weakening in stocks and most commodities and commodity currencies, which has benefitted safety assets such as the Japanese Yen. While the Australian and Canadian Dollars are weak, European currencies are also falling, with the Swedish Krona making new all-time low prices against the U.S. Dollar. So, markets are certainly more “risk-off” at present than they were during the previous week.
This week ahead is likely to be dominated by the British Parliamentary vote on whether to accept the draft Brexit deal. If somehow the deal is passed then we can expect the British Pound to rise sharply, although it seems to be an unlikely outcome. If Parliament votes against then either a last-minute deal will be cobbled together before 29th March or the departure date will be postponed. A “no deal” Brexit remains highly unlikely despite the headlines.
In addition to the Brexit vote, this week will probably be dominated by the monthly central bank input from the Bank of Japan, U.S. inflation and retail sales data, and British GDP and Budgetary releases.
Fundamental Analysis & Market Sentiment
Fundamental analysis remains quite bullish on the U.S. Dollar. However, the stock market has continued to sell off despite being in a technical bull market again. Friday’s Non-Farm Payrolls data was far below the consensus expectation, and this hit the Dollar somewhat, but analysts have tended to shrug this off as a one-off. Nevertheless, there are fears that the recent boost to the U.S. economy has run out of steam will little left to sustain it, as well as the seeming high sensitivity of the economy to any further rate hikes, as evidenced by the fact that the FOMC appears to have largely given up on its originally planned further rate hikes for 2019. The ongoing trade dispute with China appears to be moving towards a positive resolution, which is a good sign.
Legally, only three weeks remain until the U.K. leaves the European Union, and the default position is that there will be no deal unless one is agreed before that date. The E.U. are still refusing to offer any substantial concessions on their offered terms of a deal, so we can expect continuing political uncertainty and machinations over the next few weeks in the U.K. If Brexit is postponed, which seems increasingly likely, there will be a greater chance of a deal being reached or of Brexit not happening at all, and that will boost the value of the British Pound.
The ECB has recently taken a more dovish line on the Euro and the Euro still looks weak. The Swedish Krona is even weaker, reaching new all-time lows in the shadow of a Swedish Banking scandal.
Technical Analysis
U.S. Dollar Index
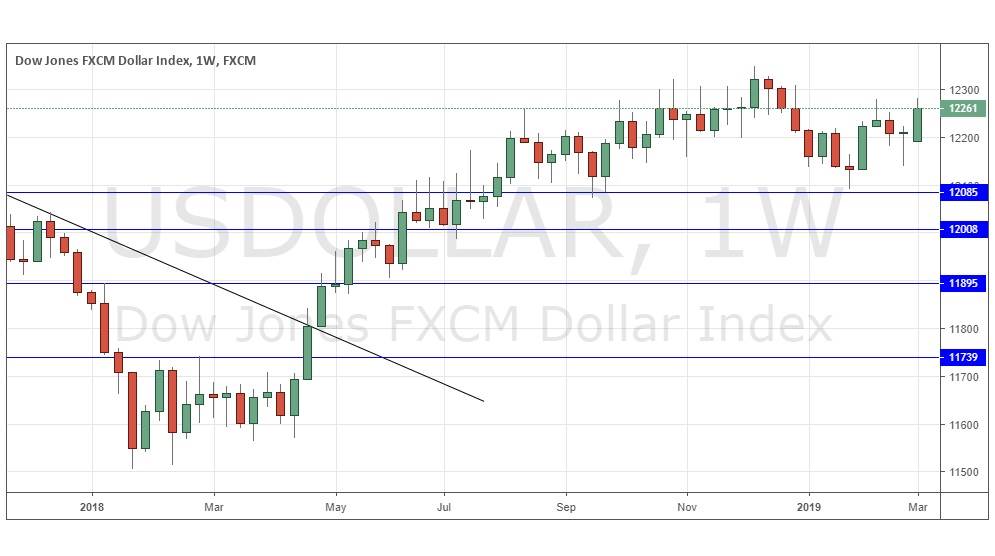
The weekly price chart below shows that last week the USD Index rose quite firmly, printing an average-sized bullish candlestick with a meaningful but not overly-large upper wick, which suggests a further rise next week. However, as the price is slightly down over 3 months, but up over 6 months, so we have a more mixed wider price action context picture on the Dollar. Overall, next week’s direction again looks relatively uncertain.
USD/SEK
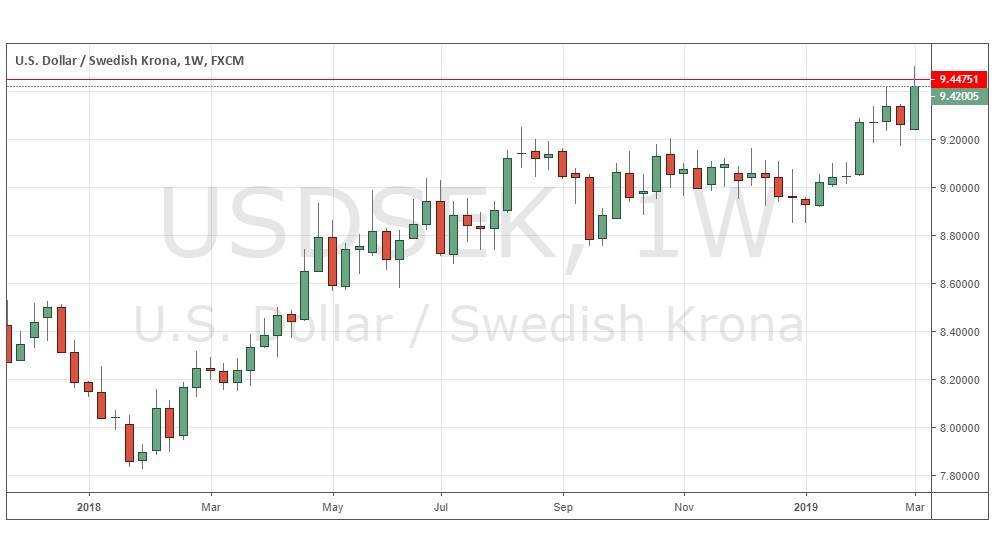
The weekly chart below shows last week produced a relatively large, strongly bullish candlestick, which reached an all-time high, which is a bullish sign. All-time highs are always bullish indicators, but we should be a little cautious as the red line in the chart shows the previous all-time high, and the week closed below it. I would be strongly bullish if the price can recover and break the high of last week.
EUR/USD
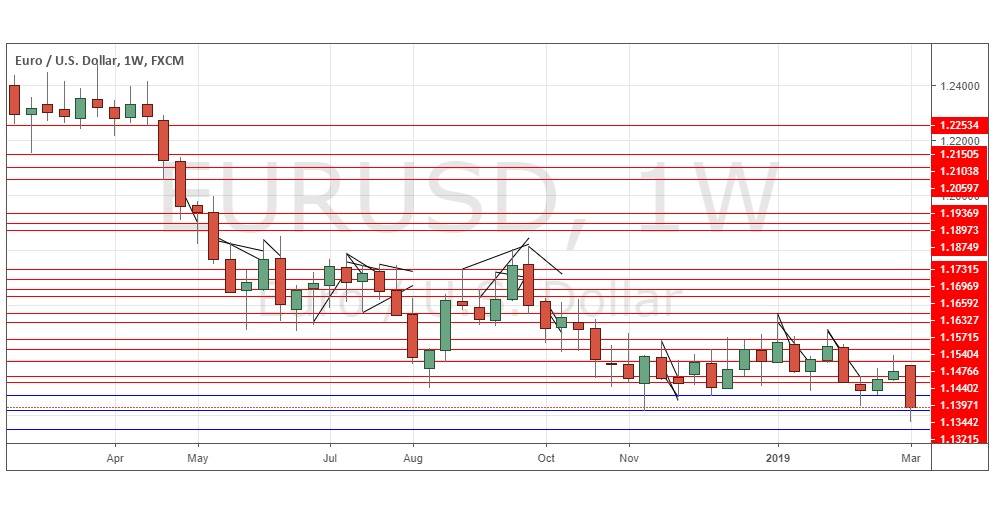
The weekly chart below shows last week produced a relatively large, strongly bearish candlestick, which reached a new 18-month long-term low price, which is a bearish sign. Long-term lows are always bearish indicators, but this pair does tend to move slowly with deep retracements, so it may take a while to fall further. There is no doubt that we have a significant long-term bearish trend here with a breakout from a recent multi-week price range.
Conclusion
This week I will be bullish on the U.S. Dollar and bearish on the Euro and the Swedish Krona, if last week’s high (USD/SEK) and low (EUR/USD) prices are breached.


