The difference between success and failure in Forex trading is very likely to depend upon which currency pairs you choose to trade each week, and not on the exact trading methods you might use to determine trade entries and exits. Each week I am going to analyze fundamentals, sentiment and technical positions in order to determine which currency pairs are most likely to produce the easiest and most profitable trading opportunities over the next week. In some cases, it will be trading the trend. In other cases, it will be trading support and resistance levels during more ranging markets.
Big Picture 10th November 2019
In my previous piece last week, I forecasted that the best trade would be long of the S&P 500 Index, buying dips with tight stop losses. This was a good call and would have led to profitable trades overall, with the Index ending the week up from its open on Monday by 0.45%.
Last week’s Forex market saw the strongest rise in the relative value of the U.S. Dollar, and the strongest fall in the relative value of the New Zealand Dollar.
Fundamental Analysis & Market Sentiment
Fundamental analysts are split evenly over whether last month’s quarter-point cut in the U.S. interest rate will be the last cut for a while, with markets implying a 50% chance of a further quarter-point cut in December or January.
The U.S. economy is still growing, but there are increasing fears of a pending recession, with the FOMC recently opining that the probability of a recession has grown. However, the benchmark U.S. stock index, the S&P 500, ended the week at an all-time high price, boosted by signals from the U.S. administration that a resolution of its trade dispute with China is moving closer towards a positive resolution. The U.S. Dollar strengthened firmly this week.
Last week saw the Forex market focus on the U.S. Dollar, and the Australian and New Zealand Dollars were affected by the RBA Rate Statement which suggested a more dovish outlook on the AUD, dragging down both the latter currencies.
Technical Analysis
U.S. Dollar Index
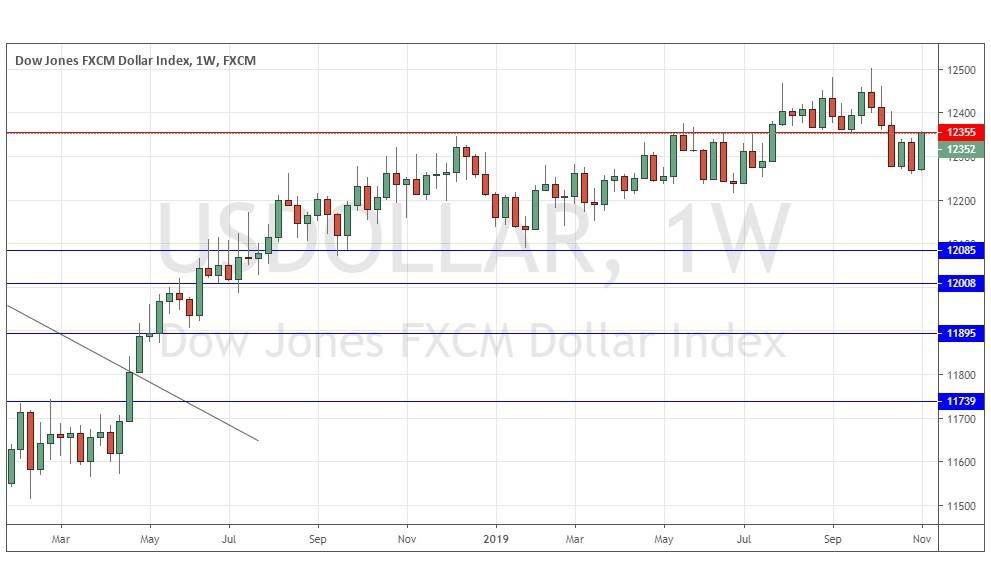
The weekly price chart below shows last week printed a slightly larger than usual bullish engulfing candlestick, closing just below the resistance level at 12355, and closing very close to the top of its price range. These are mixed signs, as although there is short-term bullish momentum, the price is below its level from 3 months ago, but above its level from 6 months ago, and has yet to clear the pivotal resistance level. This suggests that next week’s action is less predictable but would be more bullish if the price can get established above 12355.
USD/JPY
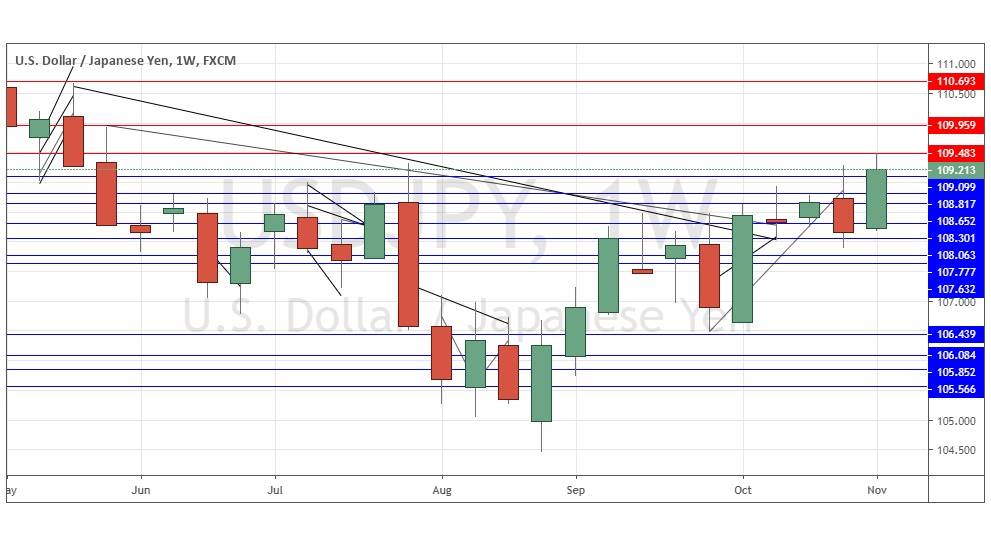
The weekly price chart below shows last week printed a bullish engulfing candlestick, which closed within the top quartile of its range. It was the highest weekly close in 23 weeks. These are bullish signs, suggesting that the price is likely to rise further over the course of the coming week. Buying dips at the support at 109.10 or 108.65 may be the most fruitful strategy using tight stop losses or waiting for a daily close above the resistance at 109.48 for a breakout-style trade.
S&P 500 Index
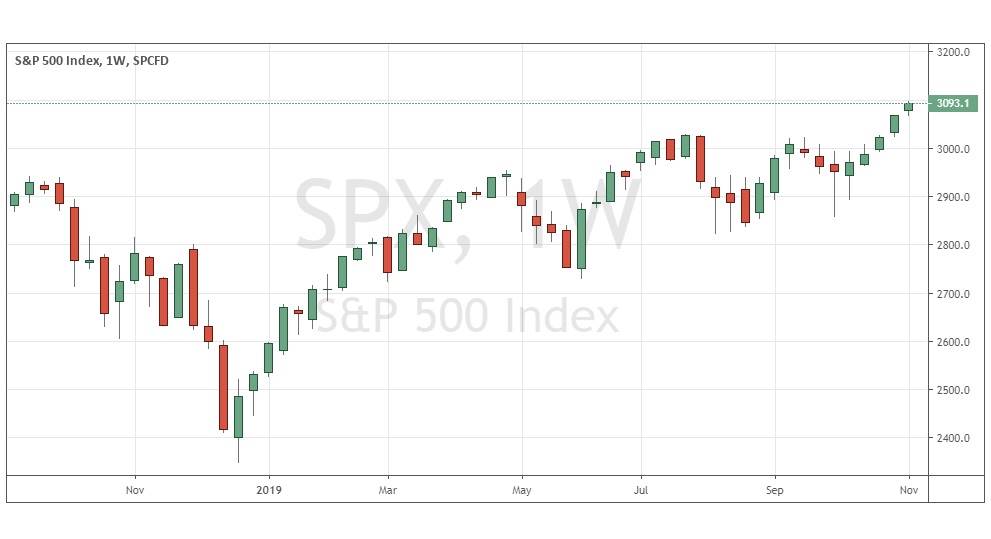
The weekly price chart below shows last week printed a bullish candlestick, which closed very near its high at an all-time high price. These are bullish signs, suggesting that the price is likely to rise further over the course of the coming week. Research shows that over the last 50 years, similar closes have indicated a further weekly rise on just under 53% of occasions. However, all-time highs can be prone to sharp selloffs, so it is best to trade long using relatively tight stop losses, and to be guided by shorter-term time frames.
Conclusion
This week I forecast the best trades are likely to be buying any relatively shallow dips in the S&P 500 Index, using tight stop losses, and doing the same on dips in the USD/JPY currency pair.


