While the Eurozone is facing multiple threats to its economy and union alike, it is trumped by increasingly weak US data. Over 30 million jobs have been lost in less than two months resulting in depressed consumer income, spending, and confidence. GDP data is worse than hoped, PMI and regional manufacturing reports dismal, while inflation is on the rise. With the US and four Eurozone members comprising the top five countries with Covid-19 infections, the EUR/USD is caught in the cross-hairs of bullish and bearish pressures. The Eurozone does have a monthly trade surplus where the US is piling up twin deficits, which in combination it preferred debt-heavy policy, grants bullish developments a minor lead. This currency pair is favored to extend its breakout sequence.
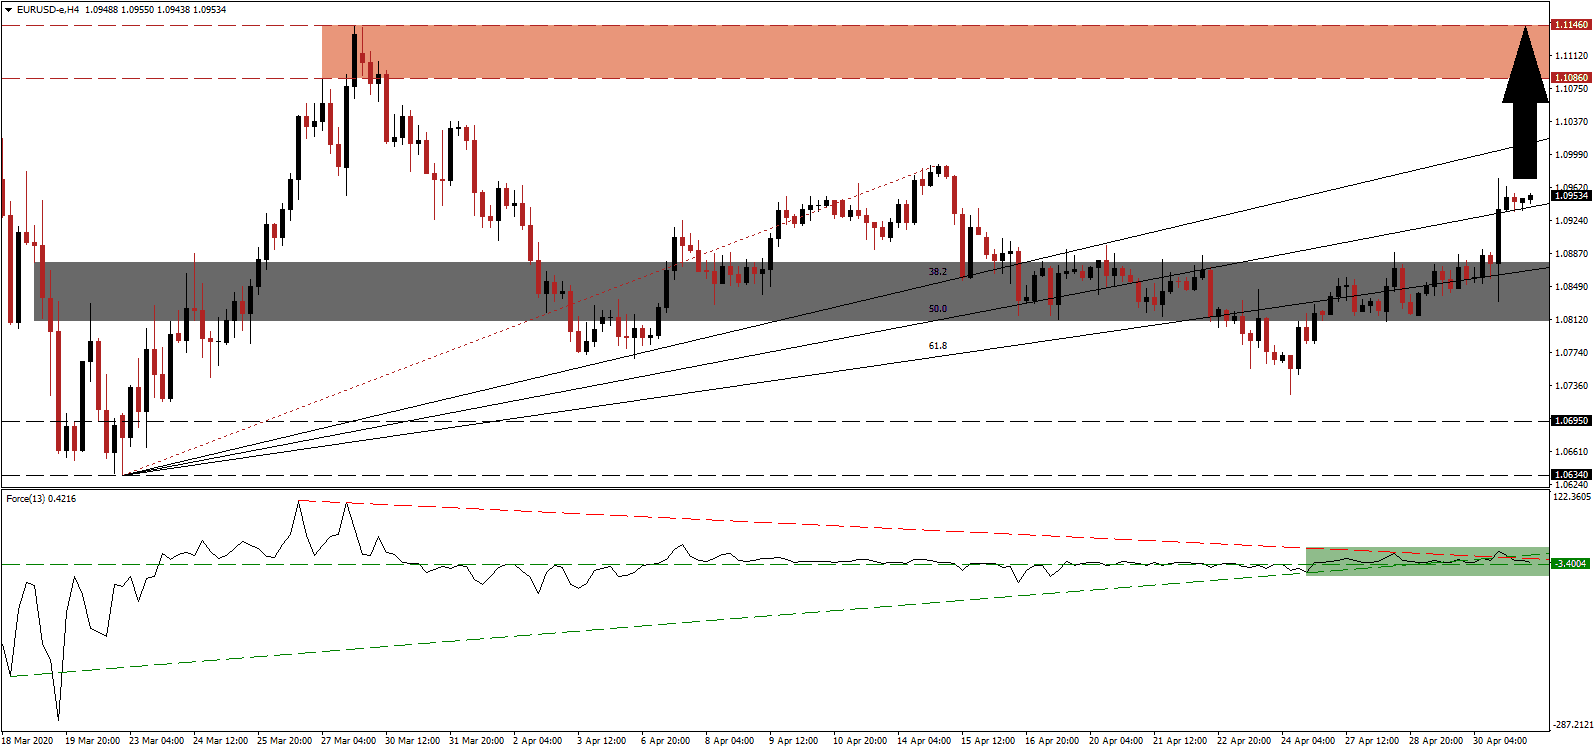
The Force Index, a next-generation technical indicator, maintains a mildly bullish stance and its position above the horizontal support level. It slid below its ascending support level with the descending resistance level adding to bearish momentum, as marked by the green rectangle. Volatility is likely to increase, but the Force Index is anticipated to inch higher from current levels. Bulls are in control of the EUR/USD as this technical indicator remains in positive territory. You can learn more about the Force Index here.
Bullish momentum expanded following the double breakout in this currency pair above its short-term support zone located between 1.0809 and 1.0877, as identified by the grey rectangle, and its ascending 61.8 Fibonacci Retracement Fan Resistance Level. Yesterday’s economic data disappointment out of the US elevated the EUR/USD above its 50.0 Fibonacci Retracement Fan Resistance Level, converting it into support. The European Central Bank, with its ill-advised monetary policy, poses a threat to the advance but is presently kept at bay by the US Federal Reserve, and its destructive decision making.
One essential level to monitor is the intra-day high of 1.0989, the end-point of the redrawn Fibonacci Retracement Fan sequence, and initiator of the previous corrective phase. A sustained pushed above this level is expected to initiate the next wave of net buy orders in the EUR/USD, adding the required volume to extend price action into its resistance zone. It is located between 1.1086 and 1.1146, as marked by the red rectangle. More upside cannot be excluded, enforced by weak US data in combination with the failure to acknowledge required changes in existing policies.
EUR/USD Technical Trading Set-Up - Breakout Extension Scenario
Long Entry @ 1.0945
Take Profit @ 1.1145
Stop Loss @ 1.0895
Upside Potential: 200 pips
Downside Risk: 50 pips
Risk/Reward Ratio: 4.00
Should the descending resistance level pressure the Force Index into negative territory, the EUR/USD will be faced with the likelihood of a reversal. US initial jobless claims continue to clock in above expectations, posing a significant threat to consumer behavior. A scarring effect from the pandemic could impact a meaningful recovery. The downside potential is limited to its support zone located between 1.0634 and 1.0659, which represents an outstanding buying opportunity for Forex traders to evaluate.
EUR/USD Technical Trading Set-Up - Limited Breakdown Scenario
Short Entry @ 1.0795
Take Profit @ 1.0695
Stop Loss @ 1.0835
Downside Potential: 100 pips
Upside Risk: 40 pips
Risk/Reward Ratio: 2.50

