Bullish View
Buy the BTC/USD and set a take-profit at 60,000.
Add a stop-loss at 50,000.
Timeline: 3 days.
Bearish View
Set a sell-stop at 53,000 and a take-profit at 50,000.
Add a stop-loss at 56,000.
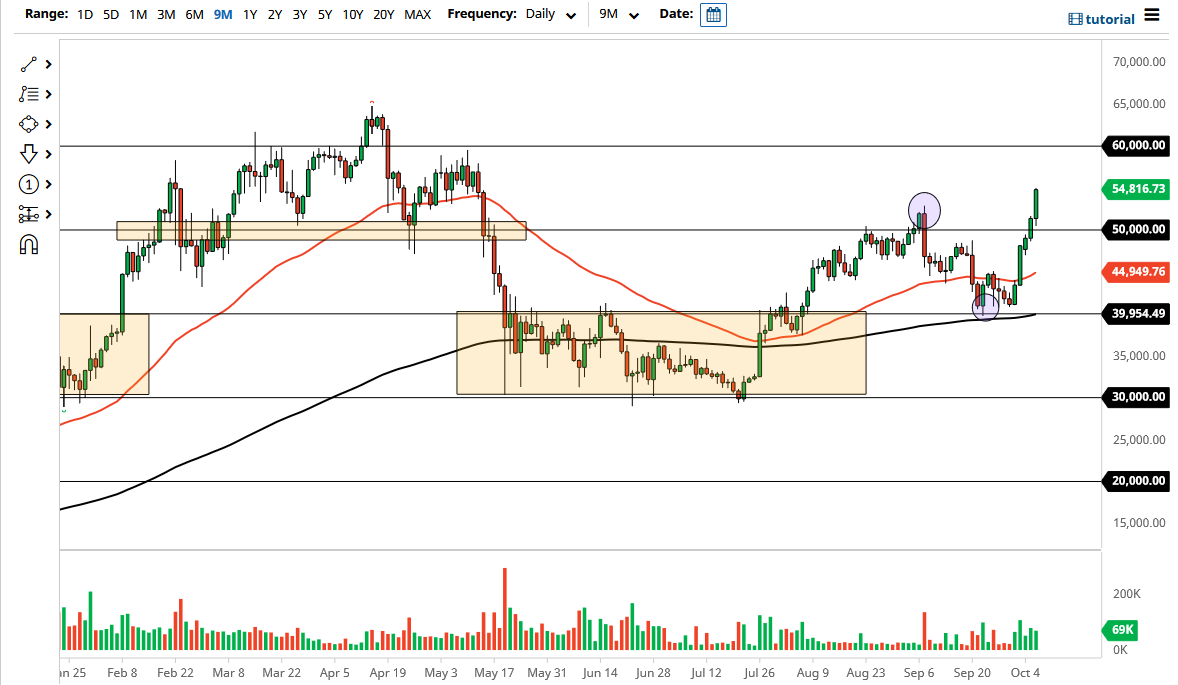
The BTC/USD price rocketed higher as investors remained optimistic about digital currencies. Bitcoin surged to more than $55,000 for the first time since May this year. This rally pushed its total market capitalization to more than $1 trillion. Other cryptocurrencies like Ether, Binance, and Ripple also jumped, pushing the total market cap of all cryptocurrencies to more than $2.3 trillion.
Bitcoin and Stocks Diverge
The BTC/USD rallied at a time when the US dollar has jumped to the highest level in months. Similarly, the pair diverged with the performance of stocks. The Dow Jones fell by more than 100 points while the NASDAQ 100 erased more than 20 points. Historically, the price of Bitcoin tends to move in sync with that of equities.
Bitcoin has struggled substantially in the past few months. After rising to an all-time high of almost $65,000 in May, the price dropped sharply after Elon Musk announced that Tesla will not accept the currency. Shortly afterwards, China launched a major crackdown on key cryptocurrency activities like mining and trading.
Most recently, the country’s central bank announced that all cryptocurrency transactions were illegal. It also banned offshore companies from providing these solutions to Chinese citizens. This was seen as being bearish for Bitcoin because of the important role that China plays in the global economy. The American government is also investigating stablecoins.
Looking ahead, the BTC/USD will react to the American jobs numbers that will come out on Friday. With the country’s inflation at elevated levels, there is a likelihood that the Fed will start being hawkish if the labour market stabilizes. A hawkish Fed is often seen as being bearish for Bitcoin.
The pair is also reacting to the rising inflows by large and smaller investors. Recent data show that inflows have been more than outflows.
BTC/USD Forecast
The four-hour chart shows that the BTC/USD pair managed to move above the key resistance level at 50,000 this week. This move led to more buyers who pushed the price to more than $55,000. The pair has moved above the 25-day and 50-day moving averages. It also crossed the important resistance at 52,713, which was the highest level this week.
Therefore, this performance will likely lead to more demand for Bitcoin, which will likely push the price to above 60,000.

