Bullish View
Buy the BTC/USD pair and set a take-profit at 60,000.
Add a stop-loss at 55,000.
Timeline: 1-2 days.
Bearish View
Set a sell-stop at 55,000 and a take-profit at 53,000.
Add a stop-loss at 57,000.
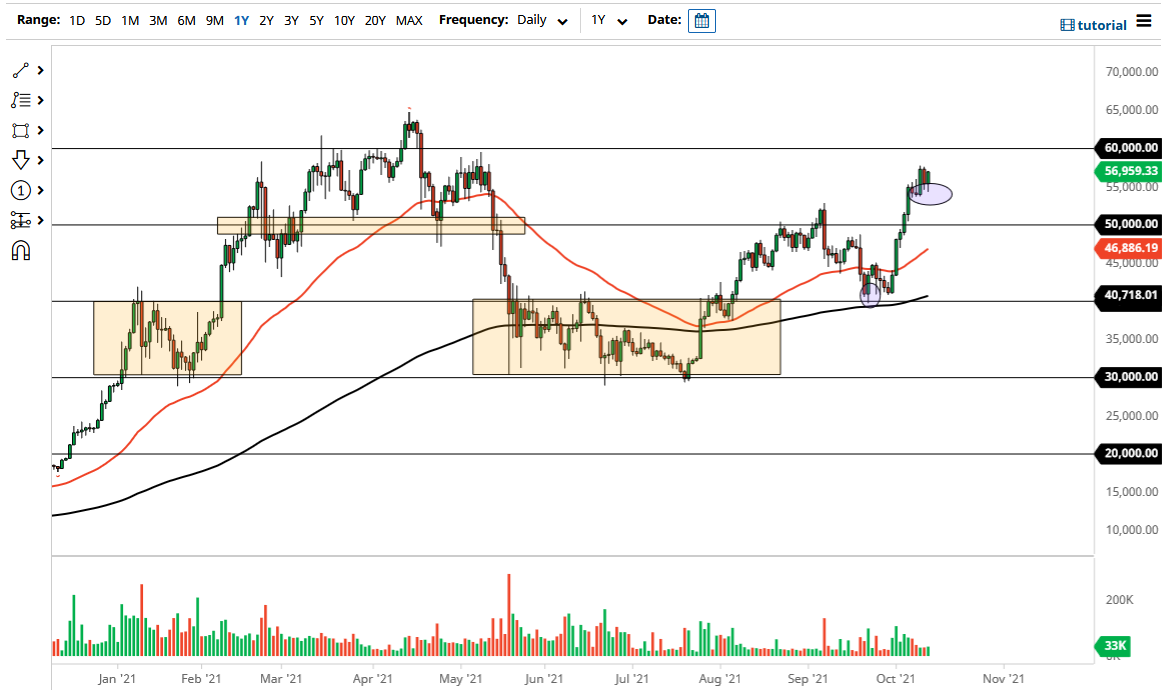
The BTC/USD pair resumed its bullish trend in the evening session even after JP Morgan’s Jamie Dimon criticized Bitcoin. The pair rose to a high of 57,000, which was about 5.4% above the lowest level on Monday.
Bitcoin Rebounds
Bitcoin rebounded sharply even after the US published the relatively strong inflation numbers. According to the statistics office, consumer prices jumped by 5.4% in September as the price of energy rose and supply constraints remained. Excluding food and energy prices, inflation rose by 4.0% in September.
US inflation numbers are important for Bitcoin because it is often seen as a risky asset. As such, its price tends to remain under pressure when the Federal Reserve is implementing a hiking cycle. Therefore, with inflation above its target of 2.0% and with the unemployment rate falling, there is a possibility that the bank will start tightening.
Meanwhile, the BTC/USD rose even after Jamie Dimon criticised the currency when speaking at an event hosted by the Institute of International Finance. In the interview, the CEO of the biggest bank in the US said that he believed that Bitcoin was worthless.
There are other reasons why the Bitcoin price is rising. First, there are signs that stability has emerged in the Bitcoin mining industry. The hash rate of Bitcoin has bounced back while the US is now the biggest miner of the currency. As such, the fears that emerged when China started a crackdown on mining have faded.
Second, some investors believe that the Securities and Exchange Commission (SEC) is inching closer to a Bitcoin futures ETF. Tens of firms have already applied for such a product. Launching the ETF will help boost demand for the coin.
BTC/USD Forecast
Looking at the four-hour chart, we see several things. First, the BTC/USD pair managed to rise above the key resistance level at $52.713, which was the highest level in September. Second, the pair has formed a bullish flag pattern, which is shown in green.
Finally, the price has moved above the 25-day and 50-day moving averages while the MACD has formed a bearish divergence pattern. Therefore, because of the bullish flag pattern, the pair will likely break out higher as bulls target the key resistance at 60,000.

