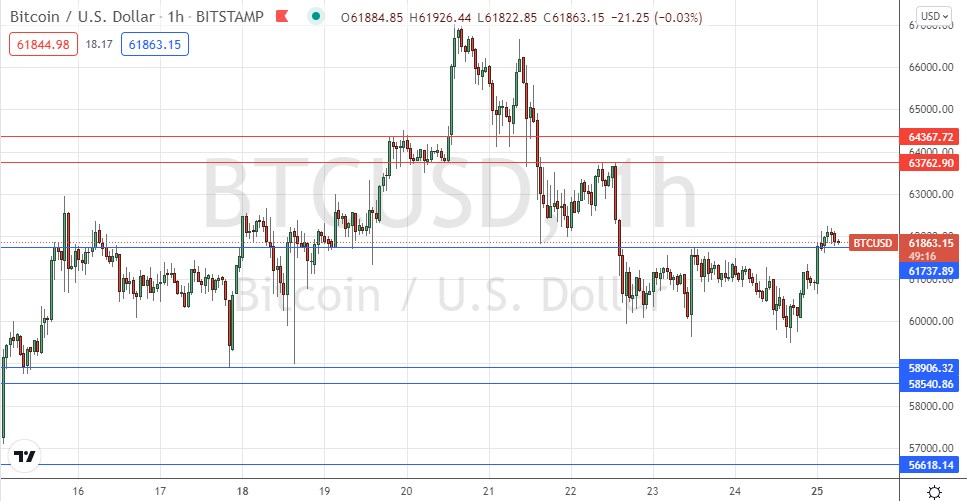
Last Monday’s BTC/USD signal produced a losing long trade from the bullish bounce off the identified support level at $61,218.
Today’s BTC/USD Signals
Risk 0.50% per trade.
Trades must be taken before 5pm Tokyo time Tuesday.
Long Trade Ideas
Go long after a bullish price action reversal on the H1 time frame following the next touch of $61,738 or $58,906.
Place the stop loss $100 below the local swing low.
Move the stop loss to break even once the trade is $100 in profit by price.
Take off 50% of the position as profit when the trade is $100 in profit by price and leave the remainder of the position to run.
Short Trade Ideas
Go short after a bearish price action reversal on the H1 time frame following the next touch of $63,763 or $64,368.
Place the stop loss $100 above the local swing high.
Move the stop loss to break even once the trade is $100 in profit by price.
Take off 50% of the position as profit when the trade is $100 in profit by price and leave the remainder of the position to run.
The best method to identify a classic “price action reversal” is for an hourly candle to close, such as a pin bar, a doji, an outside or even just an engulfing candle with a higher close. You can exploit these levels or zones by watching the price action that occurs at the given levels.
BTC/USD Analysis
I wrote last Monday that odds seemed to be in favour of a break above $62,558 and an advance to test the all-time high price just below $65k so I was looking to buy from any bullish bounce which might happen at either of the two closest support levels.
This was a good call as the price rose quite strongly from Monday’s low over the next two or three days to eventually reach a new all-time high price, although unfortunately the first entry from the higher support level did not work, and the low of the day was just a few dollars above the lower support level at which I was looking to buy from - $58,906.
Although the price did make a record high, it was not able to stay up in that one for more than a few hours before it fell quite hard, making a bearish retracement of about 10%. A few hours ago, the short-term price action turned more bullish as the price managed to pop up above the former resistance level at $61,738. If the price can hold up above this level, which may now have become support, it will be a bullish sign suggesting that the price is ready to make a significant rise again. Therefore, I would take a long trade from another bullish bounce off this level. If the price breaks down below $61,738 instead, that will be a bearish sign.
My overall analysis on Bitcoin suggests that bulls may have a slight upper hand right now, and that longer-term traders and investors have taken opportunities to buy below $60k and the buying in this zone may persist. However, we also see consistent selling pressure above $63k, so it may be that any bullish movement we get today above $63k does not last for long.
Regarding the USD, there is nothing of high importance scheduled today.

