The difference between success and failure in Forex / CFD trading is very likely to depend mostly upon which assets you choose to trade each week and in which direction, and not on the exact methods you might use to determine trade entries and exits.
So, when starting the week, it is a good idea to look at the big picture of what is developing in the market as a whole, and how such developments and affected by macro fundamentals, technical factors, and market sentiment. Read on to get my weekly analysis below.
Fundamental Analysis & Market Sentiment
I wrote in my previous piece on 7th July that the best trades for the week were likely to be:
- Looking for short-term short trades in the EUR/USD currency pair, which probably would not have worked well if attempted.
- Trying to exploit the pivotal point in the S&P 500 Index at 4172 if it was reached. This could have worked well by going long on Wednesday’s open above that level, which would have netted a profit of 2.10% over the rest of the week.
The news is currently dominated by the lower-than-expected annualized US inflation rate, which was released last Wednesday, showing there was no month-on-month inflation and that the headline rate has fallen from 9.1% to 8.5%. These data suggest that US inflation may have peaked, which would reduce hawkish pressures on the Fed. While a rate hike of 0.75% is still widely expected to be executed at the Fed’s next meeting, the lower CPI had the effect of weakening the Dollar and boosting riskier assets such as stocks and other currencies such as the commodity currencies.
The risk-on rally that had already been showing signs of emerging came into full bloom after the release of the US CPI data, and the week ended with the S&P 500 Index having recovered more than half its losses incurred during the calendar year of 2022.
The outlook regarding risk appetite is obviously more bullish now. The US stock market is still in a bear market, but rose again last week, although the US yield curve remains inverted. The US has seen two successive quarters of GDP contraction but is not officially in a recession. If the US is in a recession, the slowdown is very patchy so far.
To recap there were a few other important economic data releases last week. The results were as follows:
US Purchasing Power Index data – a month-on-month decrease of 0.5% was recorded compared to an expected increase of 0.2%. This boosted the claim that US inflation has already peaked.
UK GDP data: a month-on-month contraction of only 0.6% was recorded when a much heavier contraction of 1.2% had been widely expected. The leaves the quarterly contraction at only 0.1% against the expected 0.2%. However, it is widely expected that the British economic climate will continue to deteriorate over the coming months, reinforced by the Bank of England’s recent pessimistic forecast.
US UoM Consumer Sentiment data: consumers were more bullish than expected.
The Forex market saw a decline by the US Dollar last week. The decline was broad but especially strong against the commodity currencies, especially the Australian and New Zealand Dollars.
Rates of coronavirus infection globally dropped last week for the fourth consecutive week. The most significant growths in new confirmed coronavirus cases overall right now are happening in Barbados, Chile, Mongolia, Serbia, Tonga, and Trinidad.
The Week Ahead: 15th August – 19th August 2022
The coming week in the markets is likely to show a similar or lower level of volatility to last week, as the data releases due this week are light and unlikely to contain enough to news to strongly move the entire market. Releases due are, in order of likely importance:
UK CPI data
Canadian CPI data
Reserve Bank of New Zealand Official Cash Rate, Rate Statement, and Monetary Policy Statement
Australian Monetary Policy Meeting Minutes
US Retail Sales data
Australian Unemployment data
It is a public holiday in France and Italy on Monday 15th August.
Technical Analysis
U.S. Dollar Index
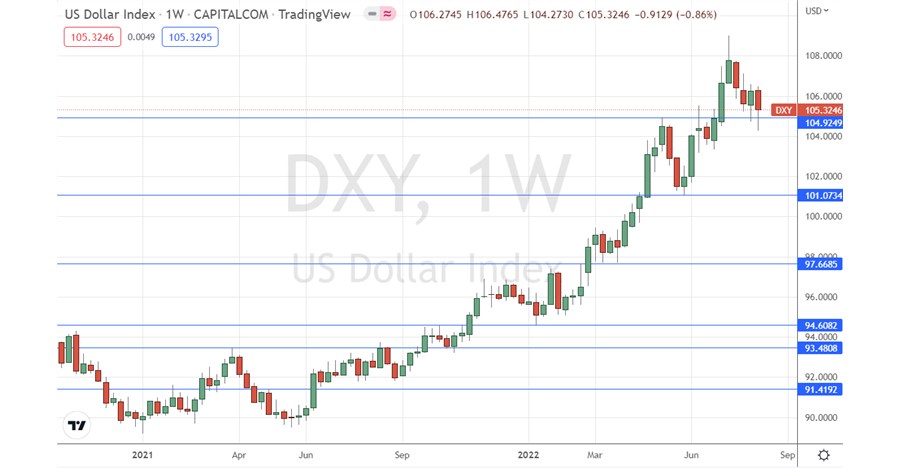
The weekly price chart below shows the U.S. Dollar Index printed a bearish candlestick which closed lower, against the long-term trend, which is bullish. The overall picture technically still looks quite bullish however, as the key support level just below the 105.00 handle is clearly holding, with the recent weekly candlestick showing a long lower wick.
It will probably be a good idea to not trade the US Dollar short over the coming week until we get a daily close below 104.92 here. This is a very powerful, long-term bullish trend in the most important currency in the Forex market, and it remains likely to reassert itself despite an increasing feeling among some analysts that US inflation may have peaked.
 US Dollar Index Weekly Chart
AUD/USD
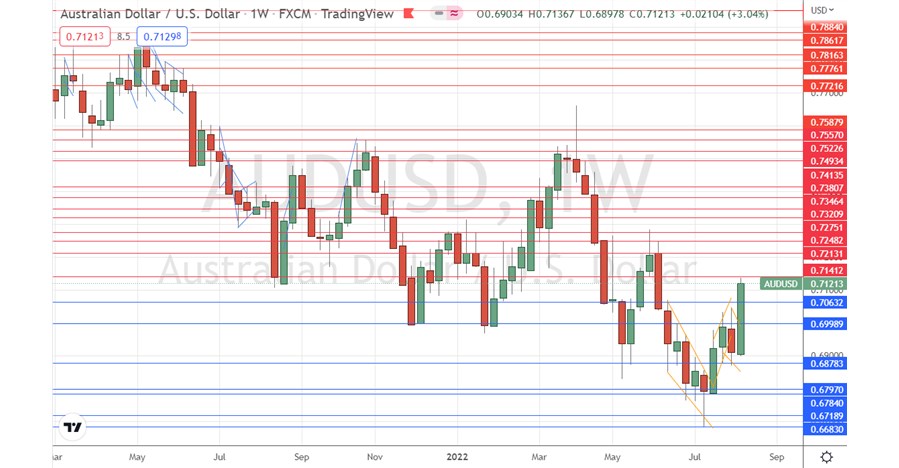
Last week saw this currency pair print a large, bullish engulfing candlestick. The Australian Dollar was one of last week’s big winners as we saw risk appetite really bounce back after that lower US CPI print. The Aussie for several years now has acted as a key risk-on barometer.
Despite the strength of last week’s bullish price movement, it is far from clear what will happen next here, as the price is in area which has been quite congested recently. We also see a weak but long-term bearish trend in this currency pair which is still technically valid.
If the US Dollar Index gets established below key support this week, we might well see a further rise in price here.

AUD/USD Weekly Chart
S&P 500 Index
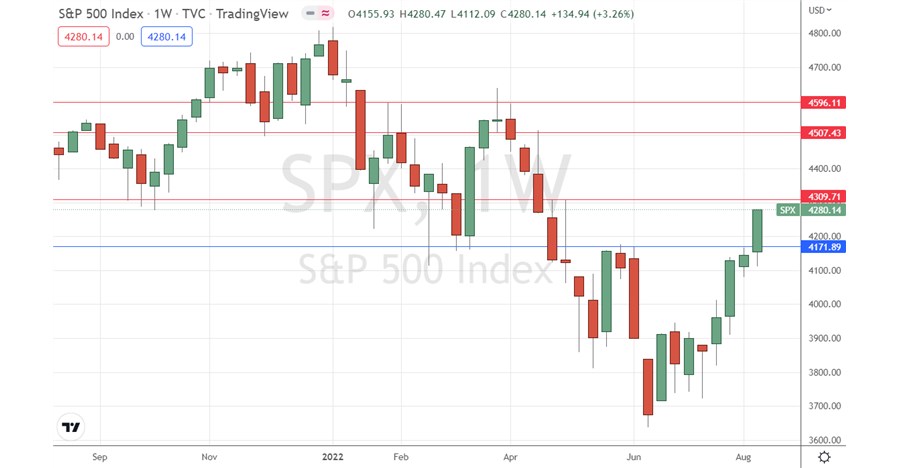
The S&P 500 Index is technically in a bear market, but rose last week for the fourth consecutive week, by quite a healthy amount. The price closed the week right on the top of its range at a new 3-month high. The S&P 500 Index has now recovered more than half of the total loss it suffered during the calendar year of 2022 so far, breaking up above the 50% Fibonacci retracement level.
Another bullish sign is that the resistance level which had been printed at 4172, was easily broken to the upside.
It is also useful to note that while the NASDAQ 100 Index has also been rising firmly, the bullish momentum is greater in the wider market than in the tech market, making the S&P 500 Index a superior vehicle to trade this advance.
Further upside is likely over the coming week in the absence of any unexpectedly bad inflation news from the FOMC Meeting Minutes or UK or Canada CPI data.

S&P 500 Index Weekly Chart
Bottom Line
I see the best opportunities in the financial markets this week as likely to be in looking for short-term long trades in the S&P 500 Index whenever short-term momentum turns strongly bullish during normal market hours.
Ready to trade our weekly Forex analysis? We’ve made a list of the best brokers to trade Forex worth using.
