Bearish view
- Sell the BTC/USD pair and set a take-profit at 25,163.
- Add as stop-loss at 28,680.
- Timeline: 1-3 days.
Bullish view
- Set a buy-stop at 28,100 and a take-profit at 30,000.
- Add a stop-loss at 25,163.
Bitcoin and other cryptocurrencies have moved sideways in the past few days in a low-volume environment. Bitcoin (BTC/USD) price was trading at 26,805 on Tuesday morning, where it has been stuck since last week. The same consolidation happened in other large cryptocurrencies like Ethereum, Cardano, and Solana. Several altcoins like Tron, Render Network, and Alchemy Pay, on the other hand, are sitting at their multi-month highs.
Debt ceiling concerns
The biggest game in the room in the financial market is the debt ceiling issue. The prospects of the American government defaulting on its obligations has led to shivers across asset classes. In stocks, most indices have barely moved recently while the US dollar index is still on edge.
Joe Biden met with the house speaker on Monday and both expressed hopes that the US government will not default. But they did not come up with a substantial plan to end the stalemate. Historically, such negotiations go down to the wire.
Therefore, if a deal will be made, it will happen next week or later this week. In theory, a default or a rate downgrade would be a positive thing for BTC, which is seen as a hedge against risk. However, past risks such as the Covid-19 shock in 2020 showed that Bitcoin tends to move in sync with stocks when there is substantial risks.
The next big catalyst for the BTC/USD pair will be the upcoming Fed minutes scheduled for Wednesday. These minutes will provide more information about the state of the Federal Reserve as it hiked rates by 0.25% in May.
Several Fed officials who talked on Monday sent a mixed picture about what to expect this year. James Bullard of St Louis backs two more hikes this year while Tom Barkin refrained from predicting what to expect. Raphael Bostic said he was comfortable with a rate pause.
BTC/USD technical analysis
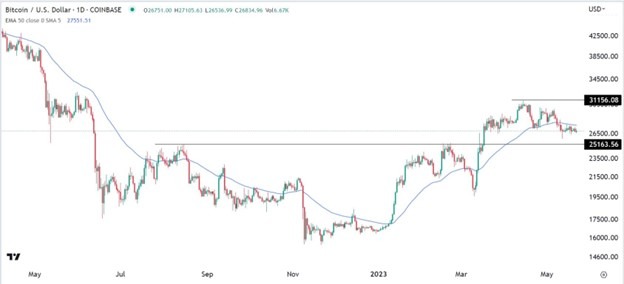
On the daily chart, we see that Bitcoin has been in a bearish trend in the past few weeks. It has moved from this month’s high of 31,156 to a low of 26,817. The pair has moved below the 50-day moving average. It is also approaching the important support level at 25,163, the highest point in February and August last year.
Bitcoin has also formed a head and shoulders pattern. Therefore, Bitcoin will likely continue consolidating before making a bearish breakout to 25,160.
Ready to trade Bitcoin USD? Here are the best crypto brokers to choose from.

