Top Forex Brokers
The difference between success and failure in Forex / CFD trading is highly likely to depend on which assets you choose to trade each week and in which direction, and not on the methods you might use to determine trade entries and exits.
When starting the week, it is a good idea to look at the big picture of what is developing in the market as a whole and how such developments are affected by macro fundamentals, technical factors, and market sentiment.
Read on to get my weekly analysis below.
Fundamental Analysis & Market Sentiment
I wrote in my previous piece on 25th December that the best trade opportunities for the week were likely to be:
- Long of the NASDAQ 100 Index. The Index rose by 0.30% over the week.
- Long of Cocoa futures. This rose by 0.21% over the week.
- Long of the EUR/USD currency pair. This fell by 2.87% over the week.
This produced an overall loss of 2.36% which averages to a loss of 0.79% per asset.
Last week was a quiet week in most markets due to the end-of-year holidays and the absence of any major economic data releases, but stock markets were fairly active and ended the week mostly higher. We saw a continuation of risk-off sentiment marred by some strong profit-taking at the end of the week as the calendar year closed, with the US Dollar and other safe-haven assets regaining some ground after selling off earlier in the week.
These factors lifted major US stock market indices to a ninth consecutive week of gains and in the case of the tech-based NASDAQ 100 Index, another all-time high price just shy of 17000.
The Week Ahead: 2nd January – 5th January
The coming week in the markets is likely to see a considerably higher level of volatility, as markets come back online after the Christmas and New Year holidays. The start of a new calendar year typically sees volatile, choppy markets, and surprising changes in direction, making price direction difficult to predict at this time of year.
The most important data releases over the coming week will be the FOMC Meeting Minutes and JOLTS Job Openings in the US on Tuesday, followed by US non-farm payrolls and average earnings data on Friday. Thursday will see the release of preliminary German CPI (inflation) data.
Other major economic data releases this week will be:
- US ISM Services PMI
- US ISM Manufacturing PMI data
- US Unemployment Claims
- Canadian Unemployment Rate
Technical Analysis
US Dollar Index
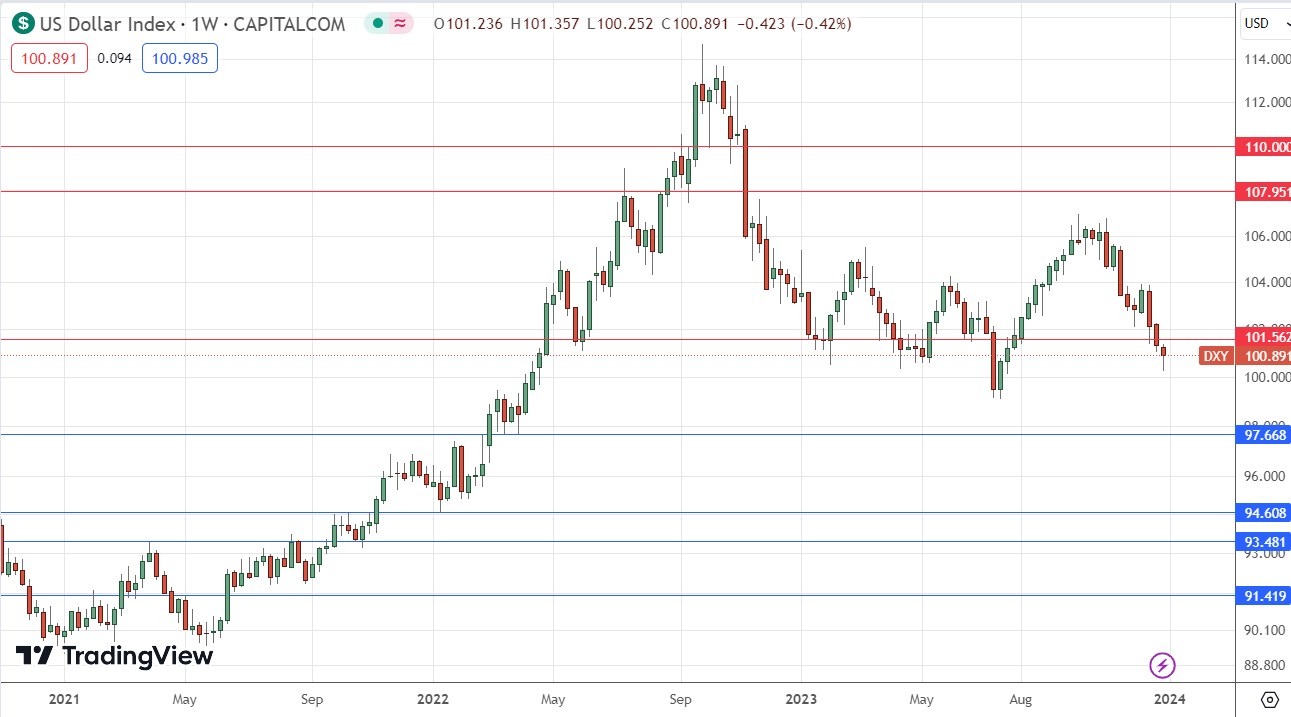
The US Dollar Index printed a candlestick last week, which closed lower but looked near to being a bullish pin bar, so it is hard to call this a truly bearish candlestick. The weekly close was the lowest in almost 5 months and was down on the prices of 3 months and 6 months ago, presenting a long-term bearish trend.
Another bearish factor is that the price has remained below the long-term key support level at 101.56. Therefore, the price has a long way it may fall before reaching significant support that might hold it up, and this could give a technical tailwind to Dollar bears.
I will not take any trades long of the US Dollar now, and I am bearish on this currency. However, I recognize we saw some Dollar strength in the final days of 2023, and that we might see a lot of directional volatility as 2024 gets underway, as it typical in January Forex markets.
NASDAQ 100 Index
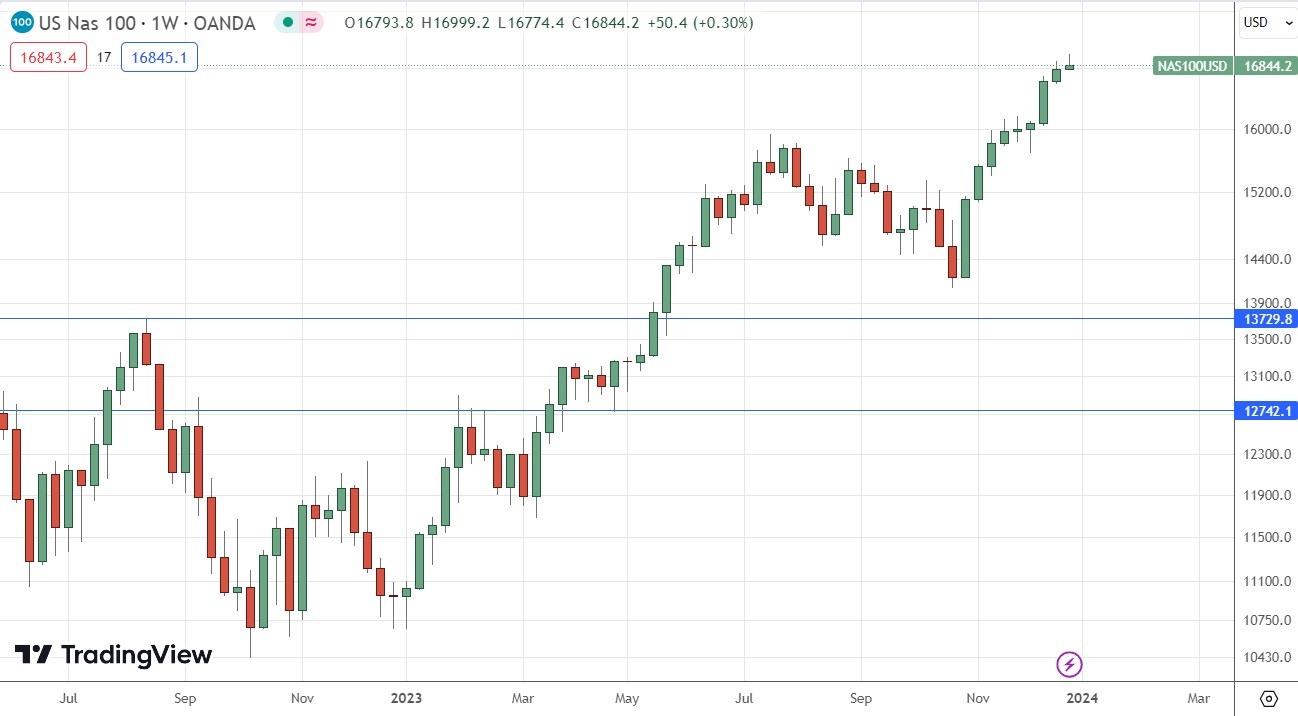
The NASDAQ 100 Index printed a ninth successive bullish candlestick, rising very slightly but again making its highest-ever weekly close, and breaking to a new long-term high. We have a bull market in US stocks, and the NASDAQ 100 Index has historically been a great investment during bull markets.
Despite these bullish factors and all-time high prices, there was some profit-taking at the end of the week, leading to the weekly candlestick looking like a small bearish pin bar, which might suggest a deeper bearish retracement is about to happen. Technical indicators also show the Index as overbought.
Another factor to consider is that we are now at the start of a new calendar year, a time when there is often a lot of directional volatility.
I am very happy to be long of the NASDAQ 100 Index as a long-term investment.
USD/CHF
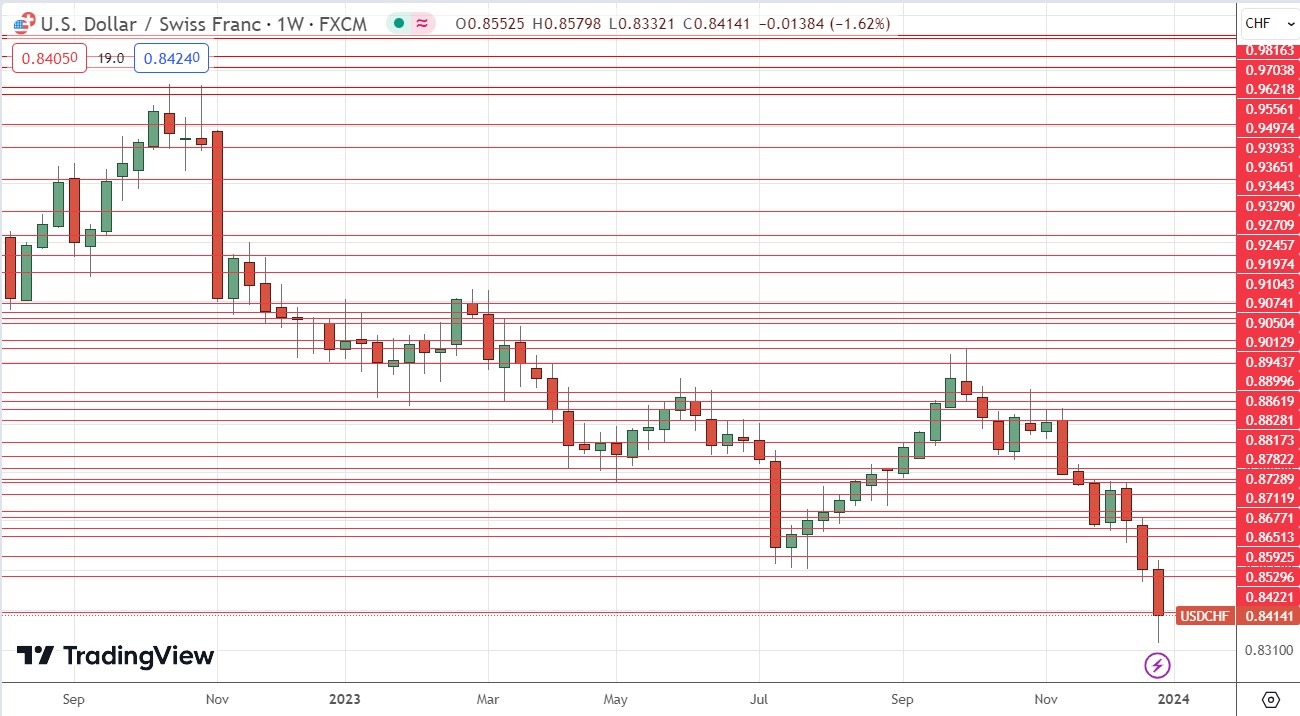
The USD/CHF currency pair made another strong downward move last week, although the Swiss Franc gave up some of its gains against the greenback towards the end of the week.
Technically, this downwards move is very significant, as it reached low prices not seen here since the Swiss Franc flash crash in 2015. In fact, the price came very close (only about 30 pips away) from its 2015 low, which was the lowest price seen here in 12 years.
This currency pair does not like to trend, and Switzerland does not want its currency to be overly strong, and as the price is in a zone which has not been reached for years, and which produced a strong bullish rebound the last time it was reached, it may be wise for brave long-term traders to looks for signs of a significant bullish reversal in this price area, all the way down to the multi-year low near $0.8300.
Despite these factors pointing to a potential bullish reversal, it should be noted that Switzerland has seen relatively low inflation very consistently over recent years, including during the past couple of years when inflation has been notably higher in other developed economies. This has naturally led to a stronger Franc, and the SNB may be unable to do much about that as it puts so much emphasis on price stability, which it can achieve much more easily than other major central banks, due to the peculiar status of the Swiss Franc as a special haven currency.
EUR/USD
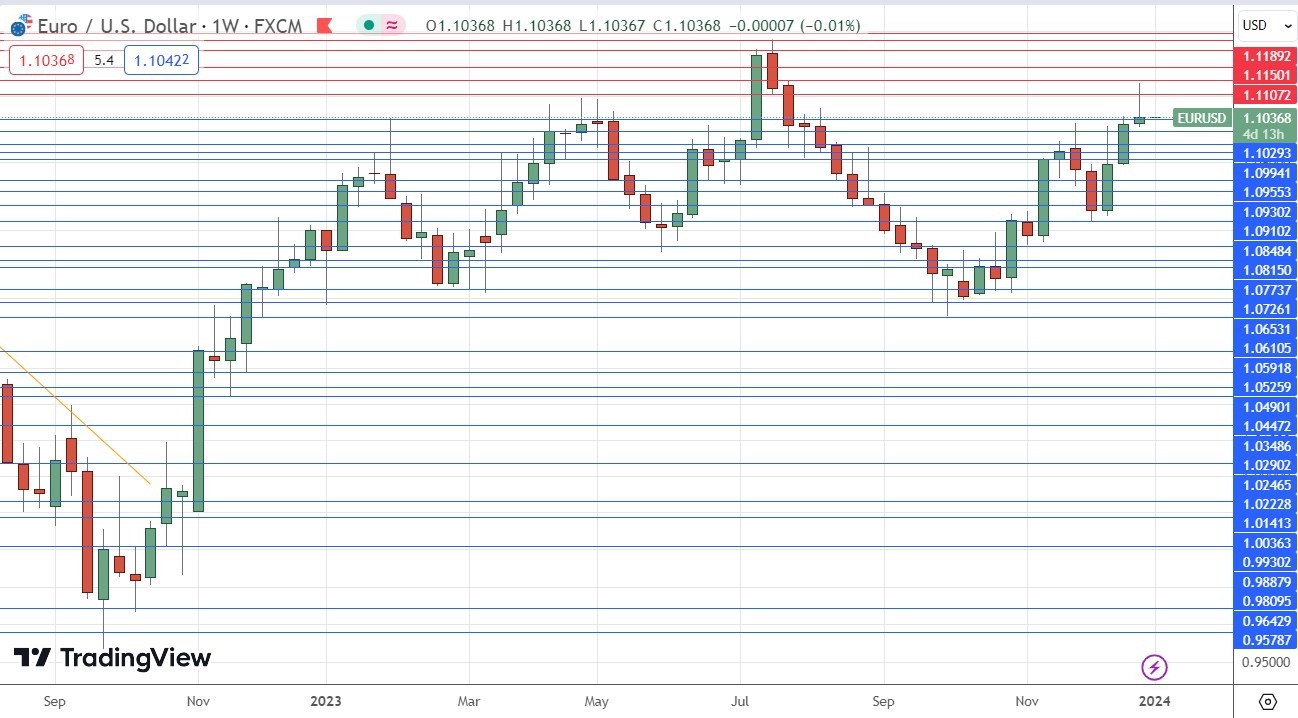
The EUR/USD currency pair printed a weekly candlestick which made a 4-month high and produced a weekly close which was also a 4-month high, but closed very near the bottom of its range, ending up as what could be called a bearish pin bar.
This currency pair likes to trend, and with the bullish long-term trend well established, the price having made a breakout, and short-term moving averages moving above long-term ones, the signs are bullish.
This is helped by relative strength in the Euro, which may be getting some traction as the ECB is seen as some way behind the rate cutting curve of the US Federal Reserve, with the ECB not talking about cutting until Q3 2024, while a rate cut by the Fed in March 2024 is widely expected.
Despite these bullish factors, the price chart below shows that this currency pair is rising very slowly, with lots of deep retracements, and it still spends time consolidating. Therefore, bulls may wish to be cautious, or at least to enter after deep pullbacks after the bullish trend resumes.
USD/JPY
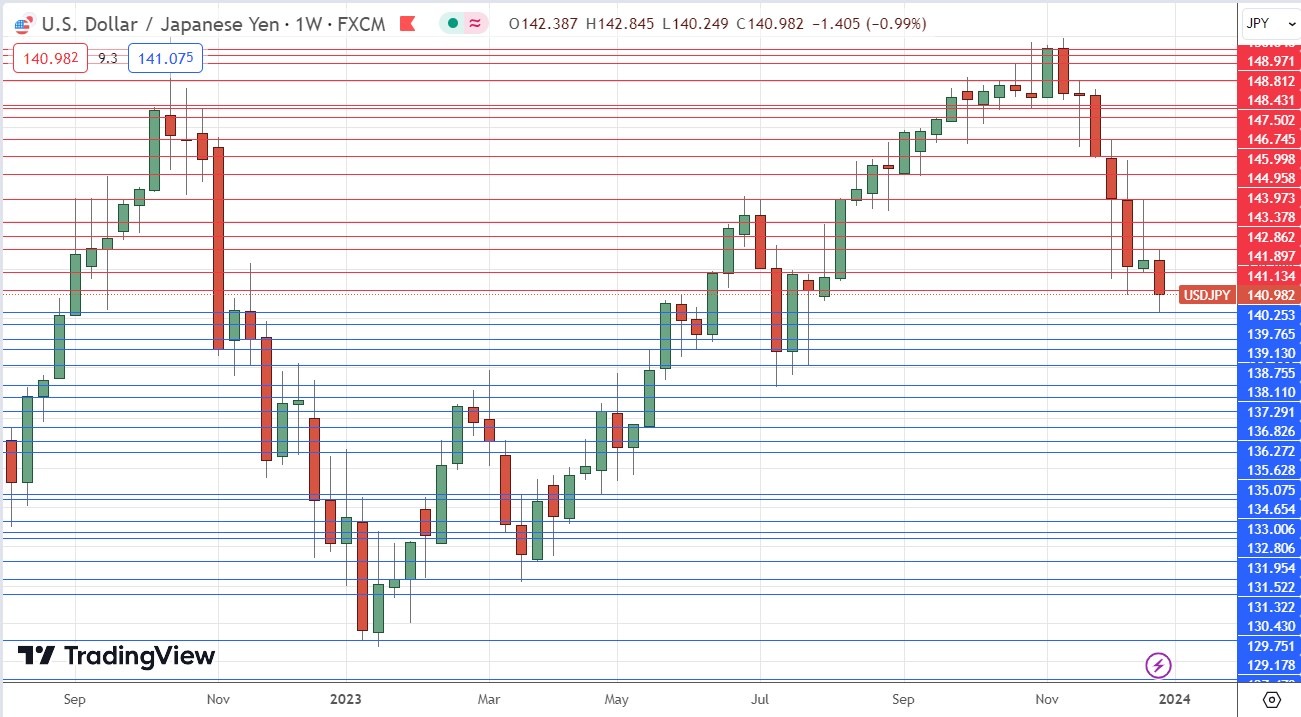
The USD/JPY currency pair made a firm downwards movement last week, ending with its lowest weekly close in five months. This bearish move got some tailwind from earlier weakness in the US Dollar but seems driven to a large extent by increased speculation that the Bank of Japan will finally abandon its negative interest rate and ultra-loose monetary policy as Japanese wage inflation begins to rise.
I think there are both good fundamental and technical reasons to go short of this currency pair, although bears might beware of the area around the round number at ¥140 which might provide some support.
Bottom Line
I see the best trading opportunities this week as:
Short of the USD/JPY currency pair.
- Long of the EUR/USD currency pair.
Ready to trade our Forex weekly analysis? We’ve shortlisted the best Forex trading brokers in the industry for you.
