WTI Crude Oil
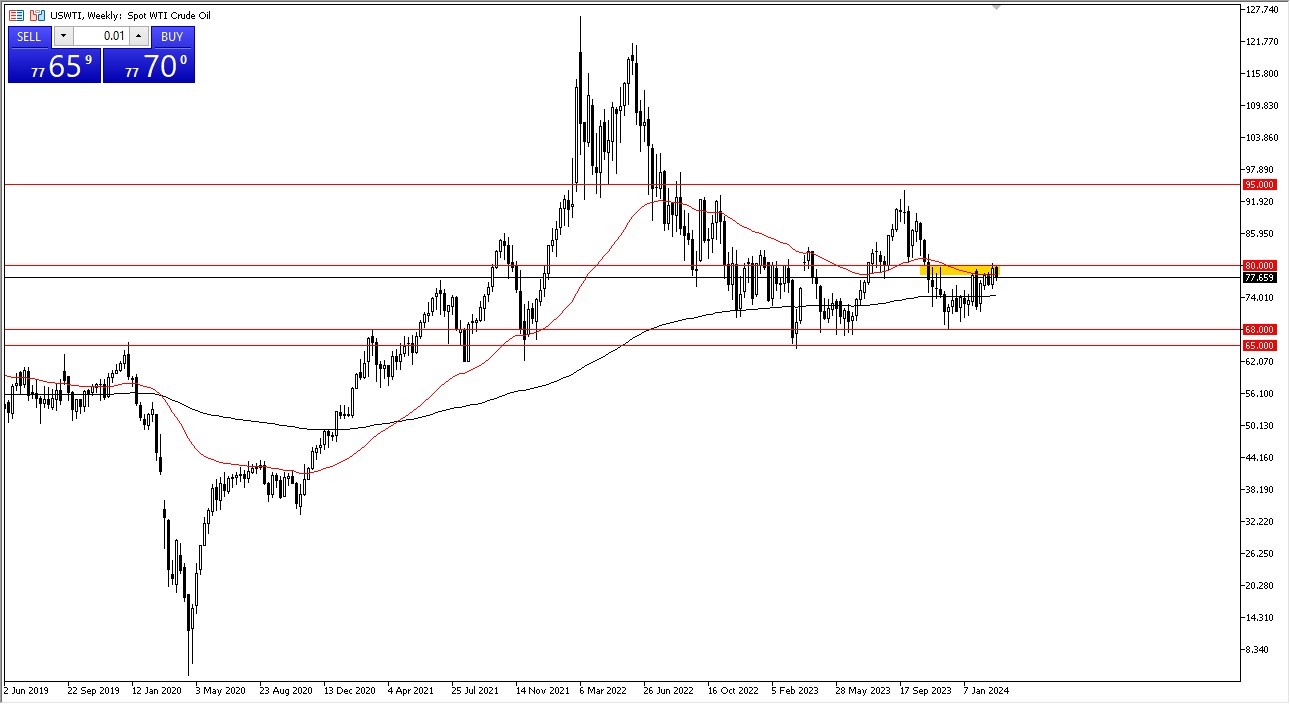
The crude oil market fell during the course of the week, but it still looks very positive. At this point in time, the $80 level course is a major resistance barrier, and if we can turn around and break above there it’s likely that the WTI Crude Oil market is likely to continue to go much higher. The cyclicality of this season will continue to favor the crude oil market as well. Short-term pullbacks continue to be buying opportunities and I do think that it is probably only a matter of time before demand continues to pick up.
AUD/USD
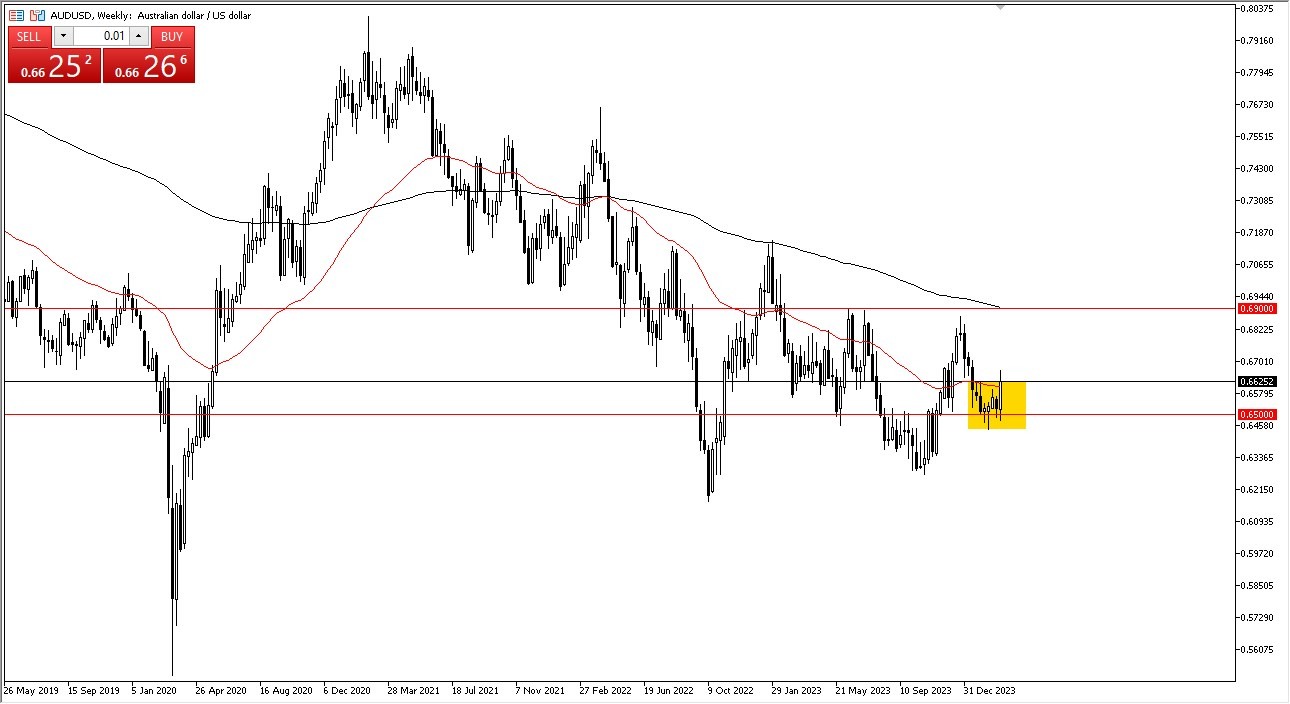
The Australian dollar had a very strong amount of upward pressure during the course of the week, breaking above the 0.6650 level, an area that I thought would be a significant resistance level. Now that we have broken above there, the market looks as if it is going to try to pull back, and I do think that this is an area that we have seen a lot of noise in the past. The 0.66 level underneath will continue to be a major support level, and therefore we need to pay close attention if we get down to the barrier. All things being equal, if we break above the candlestick on Friday, the market could go looking to the 0.69 level.
NASDAQ 100
The NASDAQ 100 has pulled back during the early part of the week, only to turn around and show signs of life. The market has ended up forming a massive hammer, which suggests that we are going to continue to go much higher. Ultimately, this remains a “buy on the dips” type of market, and I think you need to look at it through that prism. With this being the case, I think that the market participants continue to chase momentum, and as the Federal Reserve is likely to cut rates, is very likely that this will continue.
Top Forex Brokers
USD/JPY
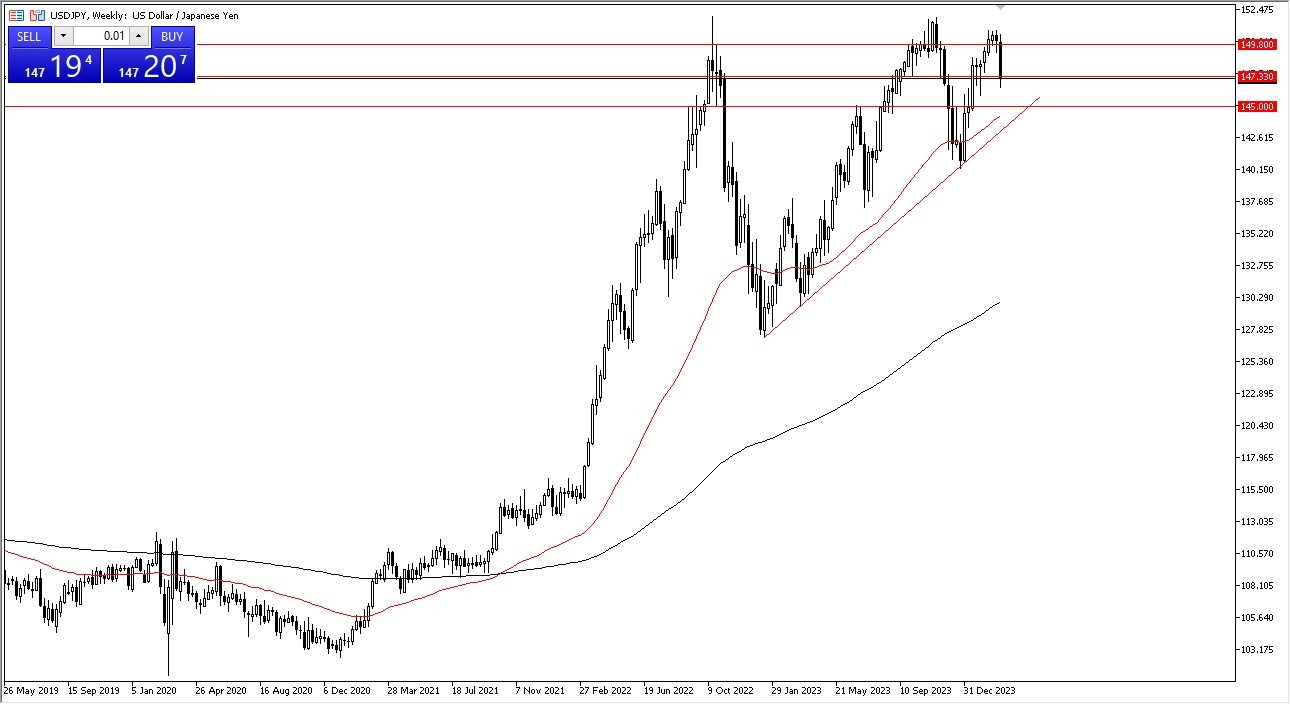
The US dollar has fallen significantly during the course of the trading week, as we have seen quite a bit of negativity with the US dollar. This was mainly driven by Jerome Powell stating in front of Congress that the Federal Reserve is likely to cut rates later this year, so that a course has put downward pressure on the greenback. At the same time, people are looking at the Bank of Japan as potentially tightening later this year, but they are still negative with interest rates, and therefore it’s likely that we continue to see upward pressure of the longer term. At this point, I’m just waiting for signs of stability.
Gold
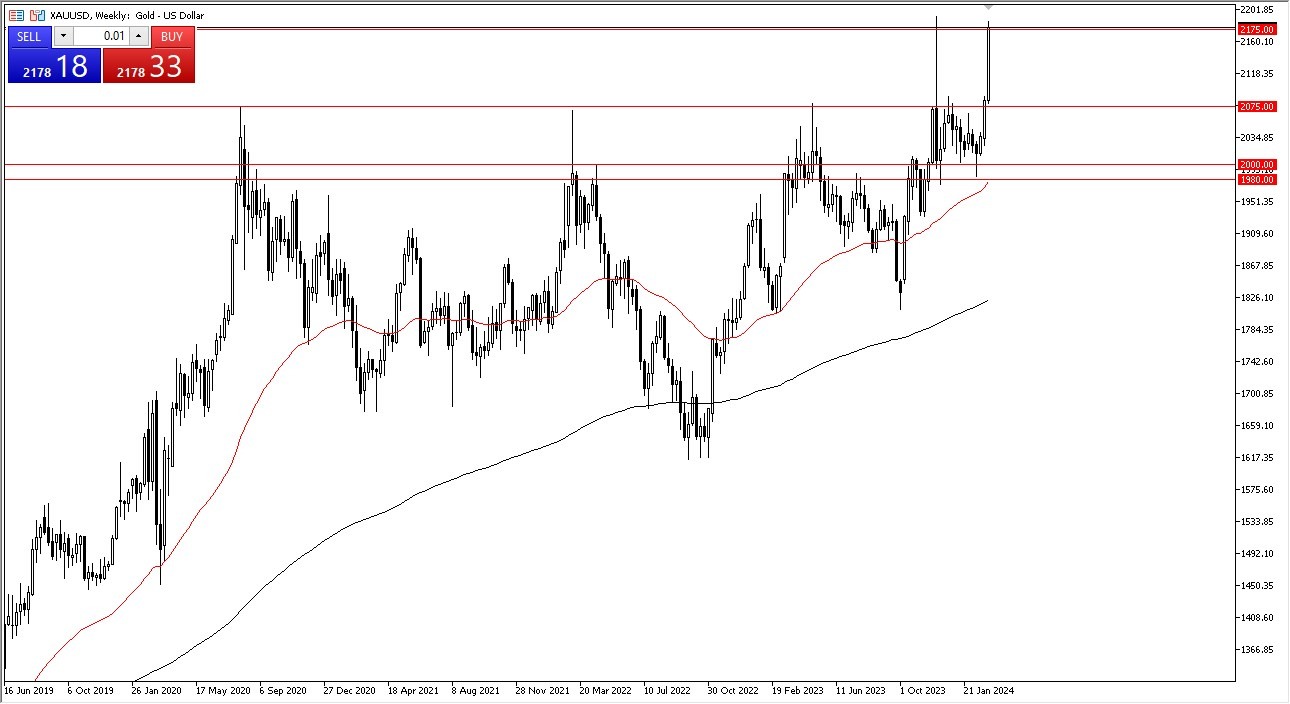
Gold markets have shot straight up in the air during the course of the week, and of course with Jerome Powell suggesting that interest rates will be cut later suggest that we are going to continue to see US dollar weakness. Gold of course does very well when central banks around the world are cutting rates, and it’s not only the Federal Reserve that’s likely to do that. Because of this, gold should continue to do fairly well against multiple currencies, not just the greenback. Furthermore, we have plenty of geopolitical concerns out there that could come into the picture and cause more upward pressure.
Bitcoin
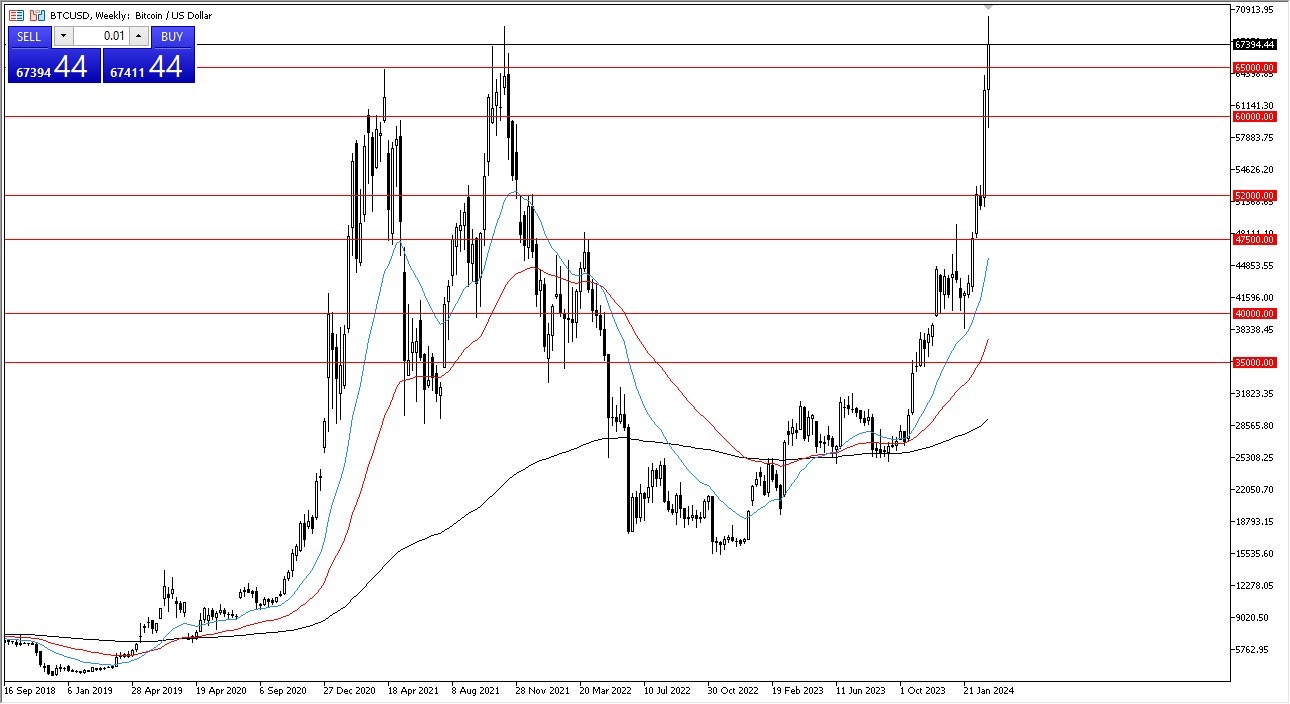
Bitcoin has had yet another bullish week as we are probing the all-time highs. At this point, I think it’s fairly obvious that Bitcoin will continue to go higher, but you also have to be cautious of getting overly aggressive here as a significant pullback is not only likely, it’s something that’s desperately needed. With that, I would love to be able to buy Bitcoin at $52,000, but only time will tell if we get that opportunity. Quite frankly, this is a market that has gotten way ahead of itself, as Wall Street is now pumping it up.
GBP/CHF
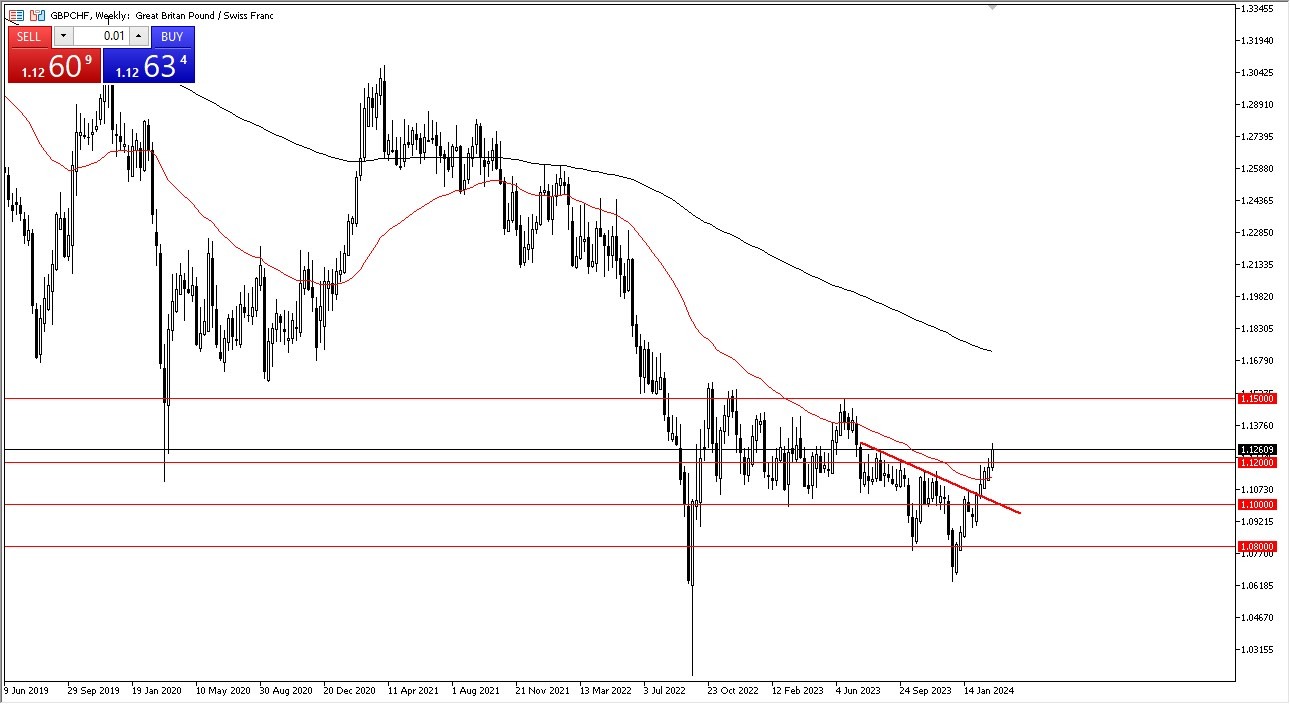
The British pound has recorded another positive week against the Swiss franc, and we are presently testing the 1.1250 region. If we can break above the top of the candlestick for this week, I believe that the British pound is looking to the 1.15 level over the longer term. Having said that, a little bit of a pullback would not be the worst thing and therefore I’d be very interested in buying this pair on a dip. Pay attention to the Swiss franc overall because we are seeing very similar patterns in all CHF-related pairs at the moment.
USD/CAD
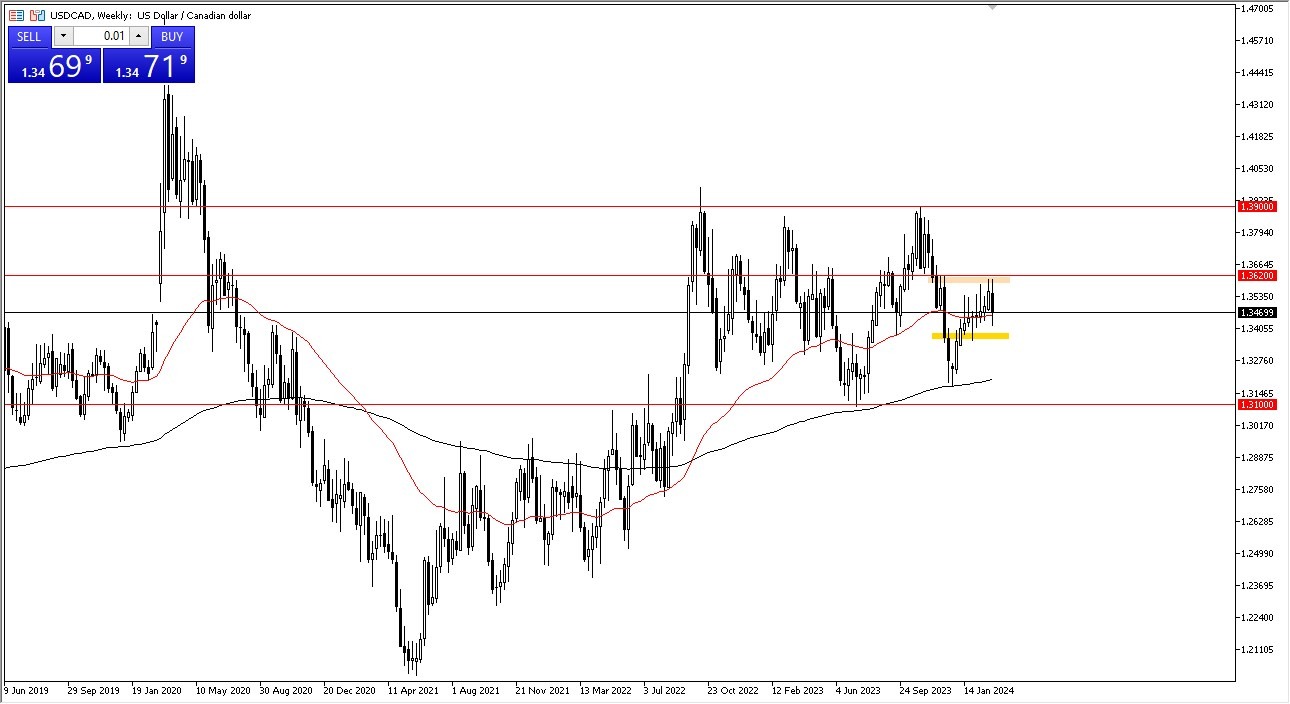
The US dollar initially tried to rally against its northern neighbor this week but found enough trouble near the 1.36 region to turn things around and fall pretty significantly. However, we have seen the market bounce back as it looks like we are going to stay in the same overall consolidation area marked by the 1.3620 level on the top, and the 1.3350 level on the bottom. As I write this, we are dead smack in the center suggesting that we are essentially near “fair value.
Ready to trade our Forex weekly forecast? Here’s a list of some of the best Forex trading platforms to check out.

