Fundamental Analysis & Market Sentiment
I wrote on 11th August that the best trade opportunities for the week were likely to be:
- Long of the EUR/USD currency pair. This produced a win of 1.03%.
- Long of Gold in USD terms following a New York close at or above $2,471. This set up on Monday and produced a win of 1.46%.
These trades gave a total win of 2.49%, averaging a win of 1.25% per asset.
Last week’s key takeaways were:
- US CPI (inflation) data released last week showed an unexpected slowing of the annualized rate from 3.0% to 2.9%, which produced a minor weakness in the US Dollar and a rally in stock markets.
- US PPI data, often seen as a key inflation metric, also came in lower than expected, suggesting weakening inflationary pressure.
- Goldman Sachs cut its forecast of a recession in the USA from 25% to 20% after stronger-than-expected retail sales and unemployment claims data were released last week.
- UK CPI data came in a fraction lower than expected, rising to an annualized rate of 2.2% when a rate of 2.3% was expected, suggesting weakening inflationary pressure in the UK.
- The RBNZ made a surprise rate cut by 0.25% to 5.25%, sending the Kiwi lower for a while.
- UK GDP data showed no growth, as expected.
- UK Retail Sales data was a fraction weaker than expected.
- Australian Wage Price Index was a fraction lower than expected at 0.8% on a quarterly basis, a fraction lower than expected, suggesting a weakening of inflationary pressure.
Top Forex Brokers
The Week Ahead: 19th – 23rd August
It will be a relatively light week ahead in terms of data, with the most important items this coming week expected to be:
- US FOMC Meeting Minutes.
- Jackson Hole Symposium
- Canadian CPI.
- Flash Services & Manufacturing PMI – USA, UK, Germany, France
- Canadian Retail Sales.
Monthly Forecast July 2024
I forecast that the EUR/USD currency pair will rise in value for August. The performance of my forecast so far is as follows:
Weekly Forecast 18th August 2024
Last week, I made no weekly forecast, as there was no large group of currency crosses with unusually large directional movement, which is the basis of my weekly trading strategy.
This week, I again gave no weekly forecast, as only two major currency pairs/crosses fluctuated in value by more than 2%. The odds of profitable reversals are better when several crosses have abnormally large price movements.
Directional volatility in the Forex market rose last week—41% of the most important currency pairs and crosses fluctuated by more than 1%.
Last week, the Australian Dollar was the strongest major currency, while the Japanese Yen was the weakest.
You can trade these forecasts in a real or demo Forex brokerage account.
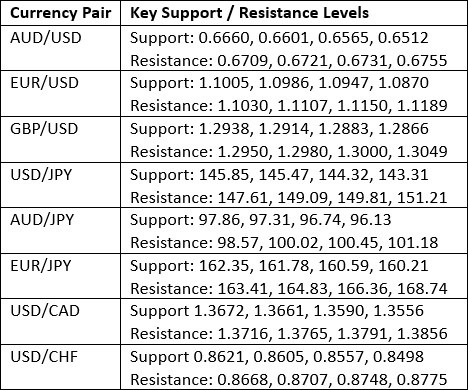
Key Support/Resistance Levels for Popular Pairs
Technical Analysis
US Dollar Index
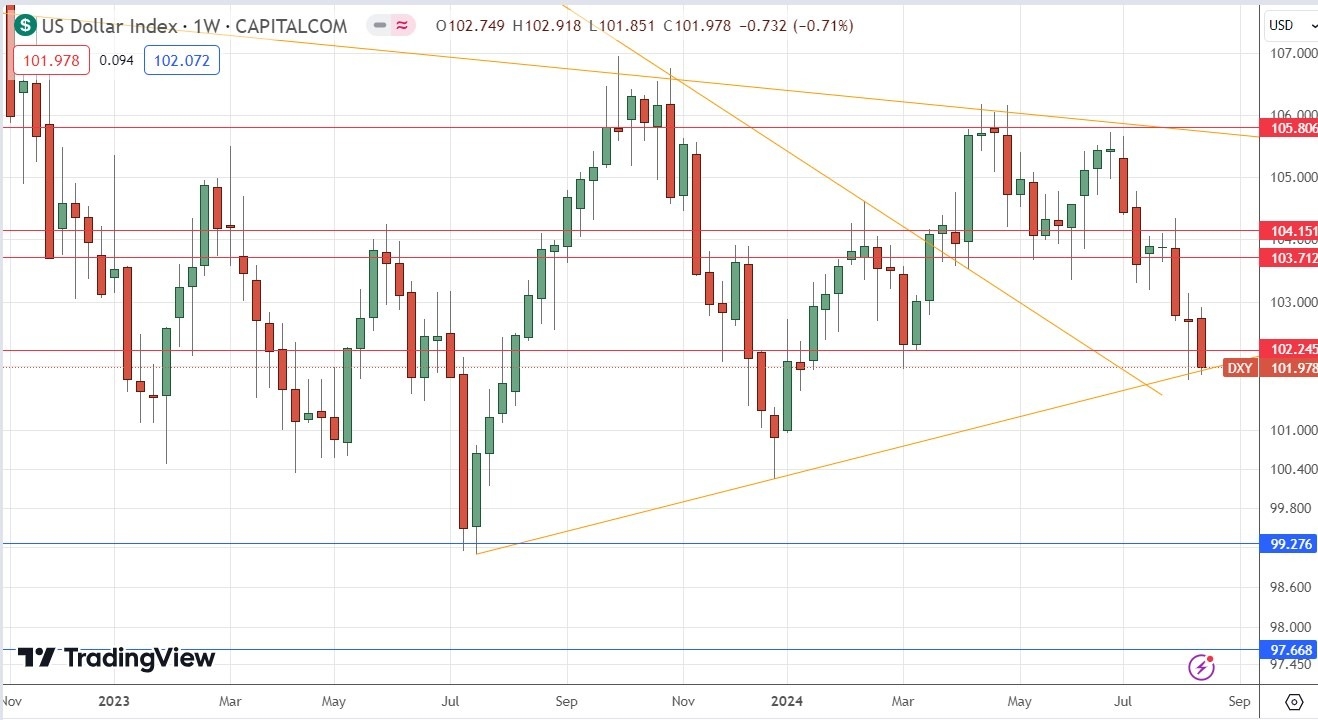
The US Dollar Index printed a bearish inside bar last week, with the close sitting heavily on the lower ascending trend line of the consolidating triangle chart pattern, which has been holding the Dollar for almost two years. The close was near the low of the week’s range. The price was below its levels three and six months ago, indicating a long-term bearish trend in the greenback.
These are all bearish signs, pointing to lower prices for the US Dollar Index over the coming week. However, bulls have some hope insofar as the ascending trend line has not yet broken down and may provide crucial support.
The bearishness is backed up by last week's lower-than-expected US CPI data.
This week, I am cautiously bearish on the US Dollar due to the bearish trend. However, to confirm that bias, I would ideally like to see a daily close below the ascending trend line first.
EUR/USD
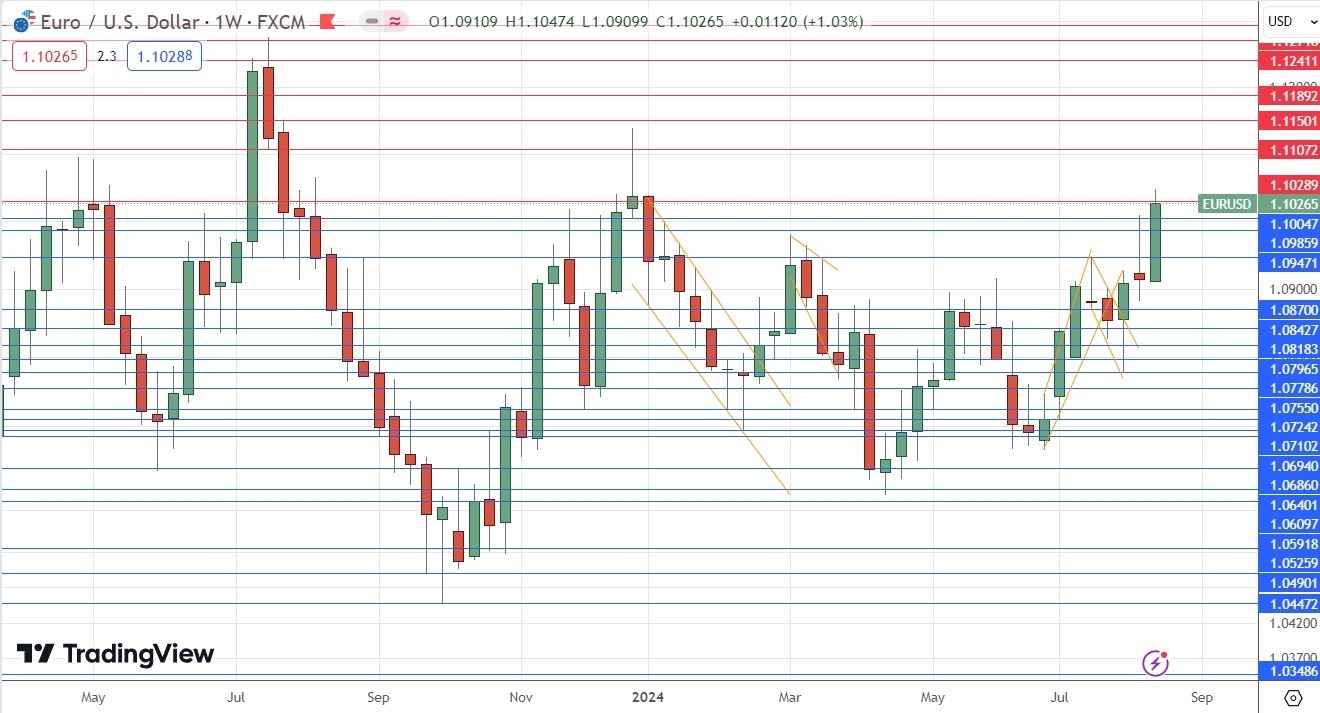
The EUR/USD currency pair finally made a bullish breakout out of its 2024 range and above the big round number at $1.1000, although it could not end the week above the resistance level just below $1.1030.
The move was triggered by weaker-than-expected US CPI (inflation) data, although the price has been threatening to make this breakout for some time now.
The Euro is a relatively strong currency, and this pair has historically tended to trend reliably, albeit with deep retracements, making this an attractive long trade for trend traders.
USD/CHF
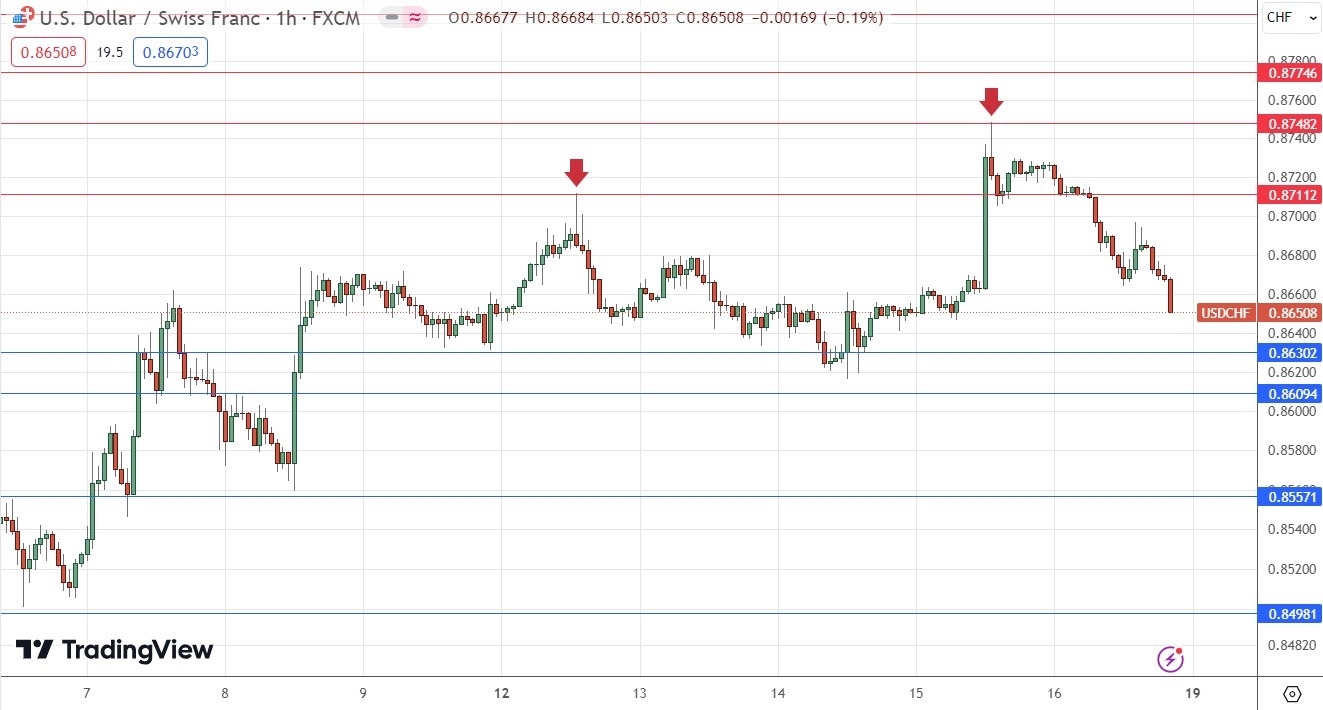
I expected the USD/CHF currency pair to have potential resistance at $0.8711 and $0.8748.
The H1 price chart below shows how the price action rejected both these resistance levels with bearish pin bars when they were first reached, marked by the down arrow within the price chart below. Both rejections took place just after the start of the London / New York session overlaps, which can often be a great time for reversals such as these in the US Dollar.
The first trade made a profit of approximately 2 to 1, and the second had a maximum reward-to-risk ratio of 2 to 1.
XAU/USD
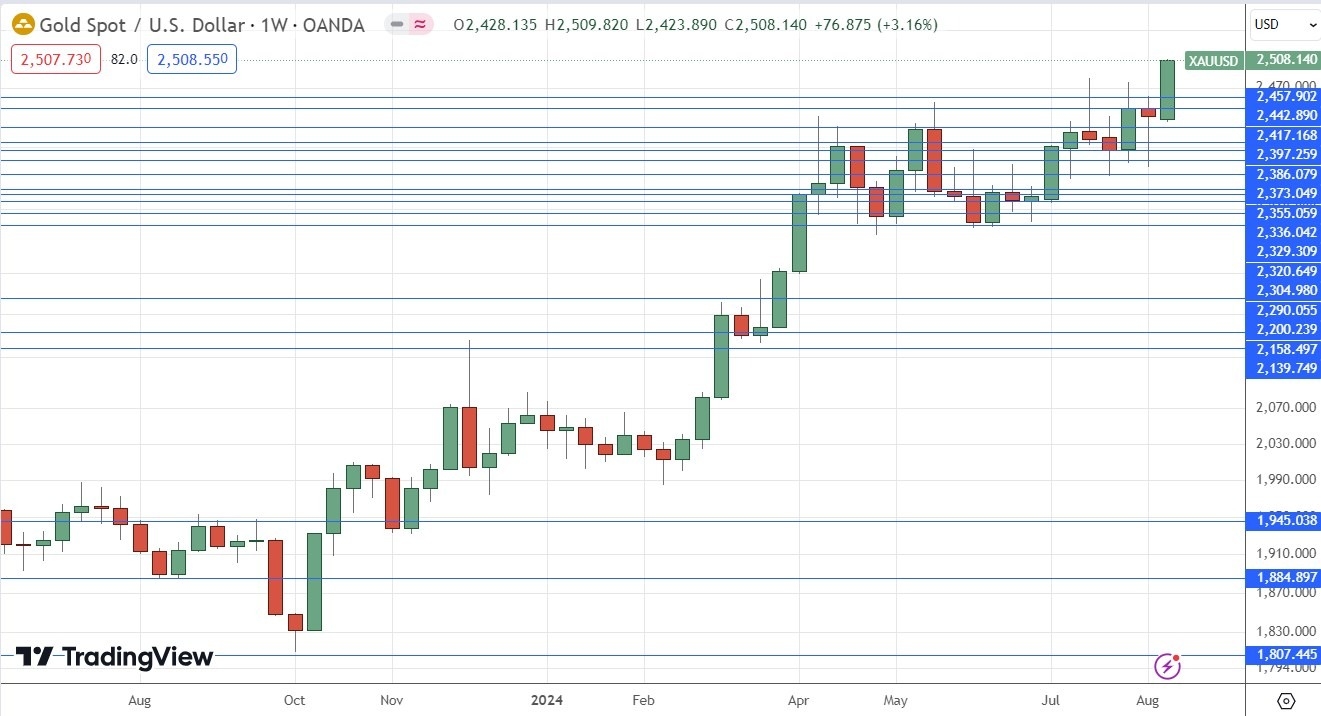
Gold has been grinding higher for weeks in a choppy, long-term bullish trend. Last week, it finally made a powerful directional move, breaking strongly to a new record high and breaking the big round number at $2,500.
The price closed extremely near the high of the week, with the move really coming after the lower-than-expected US CPI (inflation) data release on Wednesday. This makes sense, with the weak Dollar helping the rise here, but the story was essentially about Gold, which acts more as a risky asset than a haven. As stock markets rose firmly last week, we also saw Gold rise.
There are no obvious obstacles to a further price advance, and the price has cleared $2,500 to trade in blue sky. As we have good bullish momentum, I expect Gold to see higher prices over the coming week, so I see the precious metal as a buy.
S&P 500 Index
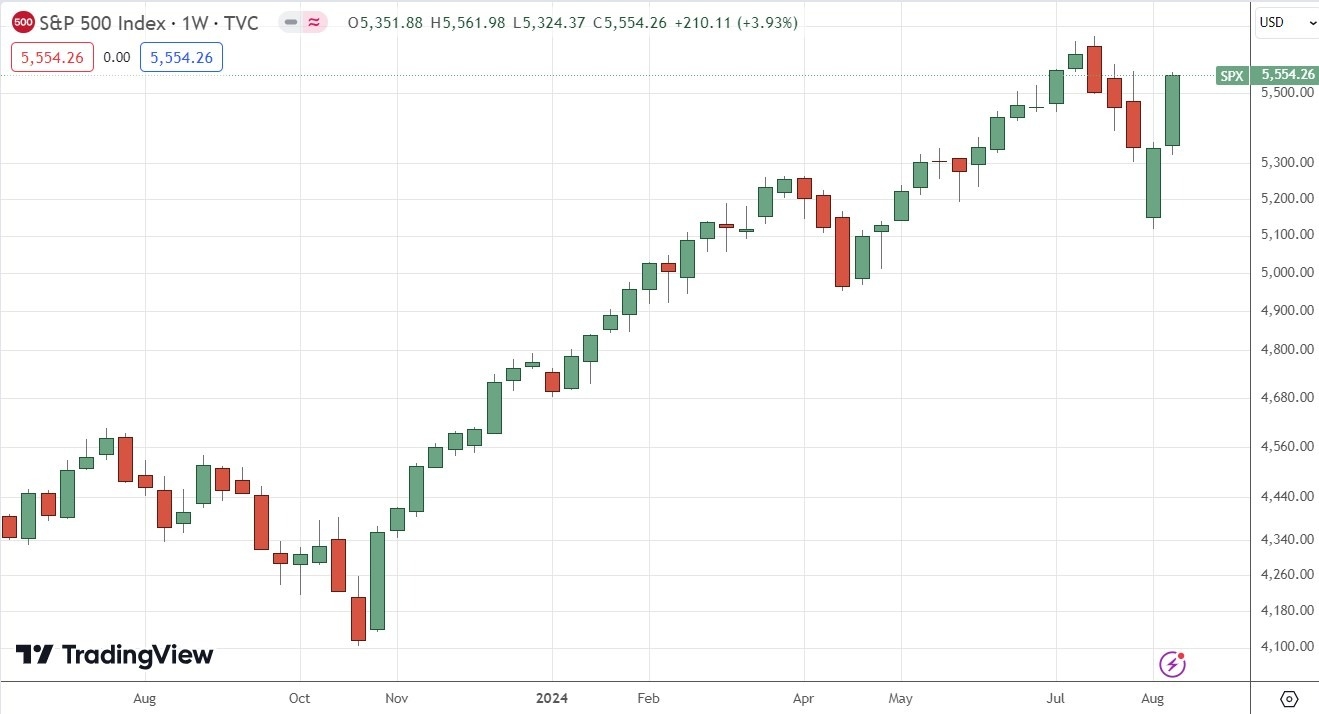
The S&P 500 Index rose very strongly last week and closed extremely near the high of its range, showing strong bullish momentum for the second consecutive week.
Last week saw a firm recovery in risky assets, including stock markets, following the unexpectedly low US CPI (inflation) data. This makes sense, with the weak Dollar helping the rise here—but the story here was about risk and the stock market.
Bulls shouldn't get overly excited yet, as the price is approaching the recent record high. There has been a lot of selling, and we expect more profit-taking as the price gets closer and closer to an all-time high.
The index will start the week rising but may fall back before it gets much higher. It will be wise to wait for a new record high in New York to close at or above 5,668 before entering any new long trade here.
Bottom Line
I see the best trading opportunities this week as:
- Long of the EUR/USD currency pair.
- Long of Gold in USD terms.
- Long of the S&P 500 Index following a daily close above 5,668.
Ready to trade our weekly Forex analysis? We’ve made a list of the top Forex brokers worth checking out.


