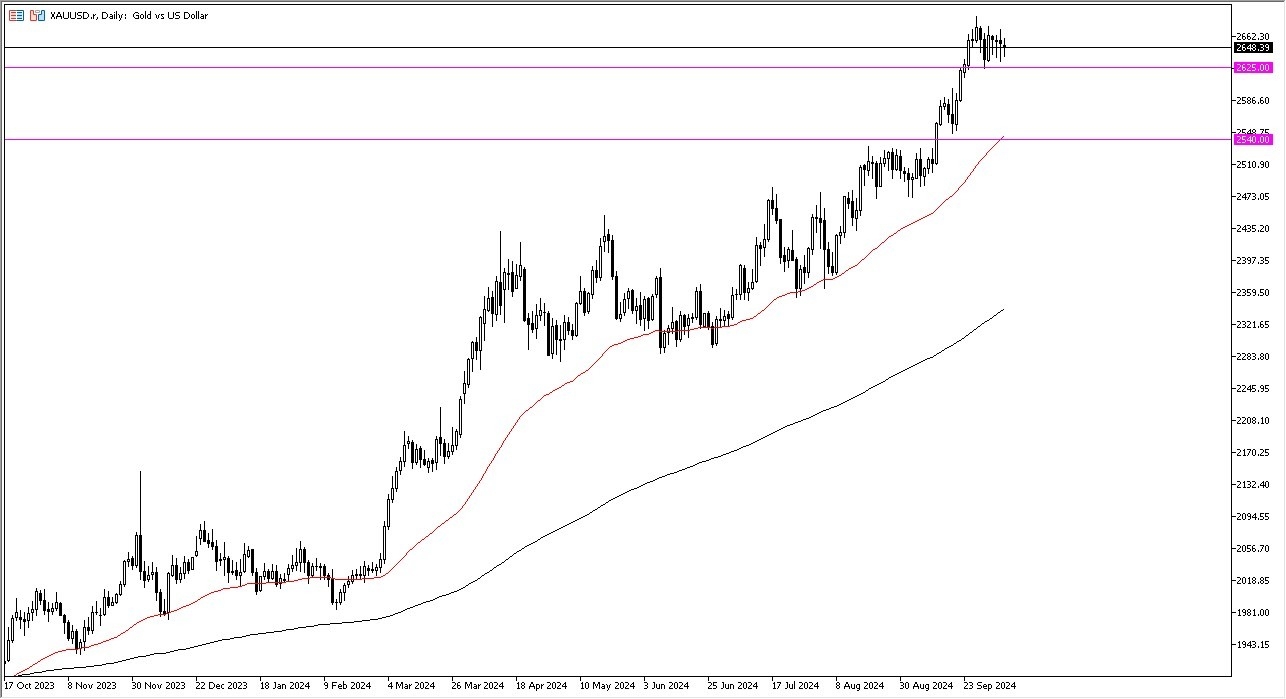
- The market is likely to continue to see a lot of volatility from what I see, and at this point in time I think we’ve got a situation where traders will have to look at this through the possibility of trying to find value wherever we can.
- I think there are several areas that we can look at, but for me, the most obvious one is the same area that was so supportive last week.
Technical Analysis
Looking at the technical analysis for the gold market, the most obvious point of interest that I have is at the $2625 level, an area that has been supportive in the past, and should continue to be as we have seen multiple times in the last several sessions. If we continue to see a lot of support in this area, I suspect that we will continue to go sideways and try to work off a lot of the excess froth from the shot higher that has been overdone, and therefore I think we get a situation where the reality is that the market could not go in one direction forever, so I think everything that we are seeing over the last week or so makes a certain amount of sense.
Top Forex Brokers
Underneath that level, then the next major area is closer to the $2540 level, which is near the previous resistance barrier, and also features the 50 Day EMA indicator. The 50 Day EMA indicator of course is an indicator that a lot of people used to sort out what the overall trend is, and therefore I think it will offer a lot of interest.
At this point in time, we have plenty of other reasons to think that this market goes higher, not the least of which of course would be geopolitics, risk appetite, and of course interest rates dropping around the world. In other words, the idea of paying to store massive amounts of gold becomes a little more palatable as interest rates on bonds continue to wilt over the longer term
Ready to trade our Forex daily forecast? We’ve shortlisted the most trusted Gold brokers in the industry for you.

