I was thinking this morning that it is easy enough to trade with the trend, but what about the times when there are no trends, or when everything is moving against the prevailing trend? Easy enough in the sense, by the way, that you can have some measurement to define a trend that is fairly simple to define and follow and that works over time.
One approach is to sit on the sidelines and not trade when there is nothing happening that meets your definition of a trend. Why not? Well, the obvious answer is that you might be missing some opportunities to make money against the trend. Though there are two obvious reasons why it might actually be a good idea to sit on the sidelines. First of all, it is strange but true that when you switch off and get away from the market for a while, your trading can improve as you get some distance to consider trading problems you have, that are probably mostly psychological. Secondly, it is just nice to take some time off anyway, and it helps build discipline, and a realization that you can make plenty of money by only getting involved in the market when its really cooking.
Having said all that, there are prolonged periods of time where trend following strategies cannot make any money, and quite prolonged, deep and obvious counter-trends do happen. So maybe it can be a good idea to try to get some profit from these times? Not to be a pig and be grabbing for every pip long or short – that is a fast road to disaster. Just to try and identify strong-counter trend moves when they happen, switch off the trend following, and try to be flexible. The question is, how to identify this kind of period when it happens?
I think there are two pretty straightforward methods you can use, and we have had pretty good examples of them lately.
Sometimes you can see a strong trend that reaches a level it cannot break. It pulls back, and then tries to break the level again. It might even succeed for a while, but the momentum on the daily charts is suddenly stronger with the movement against the trend then it has been over recent days that moved in the direction of the trend.
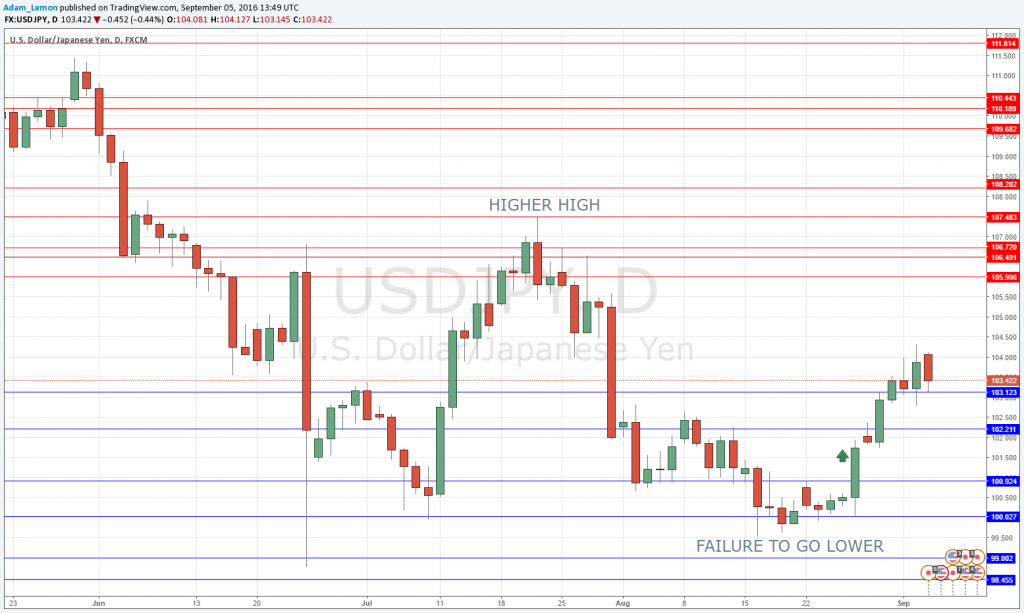
The USD/JPY chart shown below is a good example of this. It has been the best, strongest and most profitable Forex trend trade of 2016: short USD/JPY. The large red candle with a huge lower wick towards the left of the screen was printed the day of the Brexit vote. Note that the low printed there, at about 99.00, was never reached again. Two or three weeks later, after a fairly strong counter-trend move up, the price made a higher high. Here, we start to get a sign that the trend MIGHT be coming to an end. However, the price moves down again and the trend seems to have resumed.
A few days ago, the situation became very interesting, as the price just could not really stay below the key lows around 100.00 for very long. Then, just over a week ago, we had a very strong up day (marked by the green arrow). This up candle really dwarfed all the recent candles and closed up above about two weeks of price action. This was a sign that there was quite likely to be some kind of meaningful movement against the bearish trend. Sure enough, the past few days have mostly seen this upwards movement continue. It might not go any further, but there was a sign here that last week was a good time to forget about the trend and try counter-trend instead.

One final word of warning: counter-trend trading is more difficult and challenging than trading with longer-term trends. Do not feel you have to do it. It is something you can think about trying on demo, perhaps, if you are only trading with the trend on your real account, until you can make good calls on demo. You don’t have to be trading all the time. Just because the price isn’t moving with the trend doesn’t necessarily mean there is a good counter-trend trade on the table.
