If you want to be a successful trader, it is important and probably inevitable that you will learn Japanese candlestick patterns. These can be composed from anything to a single candle to a compound of dozens of candles. After all, 24 consecutive hourly candles taken together are a full daily candle, and so on.
Japanese candlesticks are based upon the relation of a unit of time’s open, high, low and close prices, and then usually how that related to at least one and sometimes several preceding candlesticks.
An understanding of Japanese candlestick patterns can be extremely helpful in developing success at trading, but sometimes we get too hung up on precise patterns. Is that candle a pin bar? Did it open and close within the top quarter of its range? Did its real body effectively engulf the previous candle’s real body if it was just a pip lower than it needed to be? A lot of the time we just don’t need to do this.
Before Japanese candlestick patterns became popular in the west, technical analysts used to draw price bars, not candles. Analysis of the bars tended to focus more on WHERE the bars were in relation to the other bars, rather than the exact shape of the bars. This looks like an old-fashioned and naive approach now, but it can be surprisingly refreshing and effective. It is worth a look.
The place to start is with J. Welles Wilder’s HIP and LOP. HIP stands for high inflection point. LOP stands for low inflection point.
They are both three candle patterns and are simply the mirror image of each other. HIPs are bearish, suggesting that the price is about to fall. LOPs are bullish, suggesting that the price is about to rise.
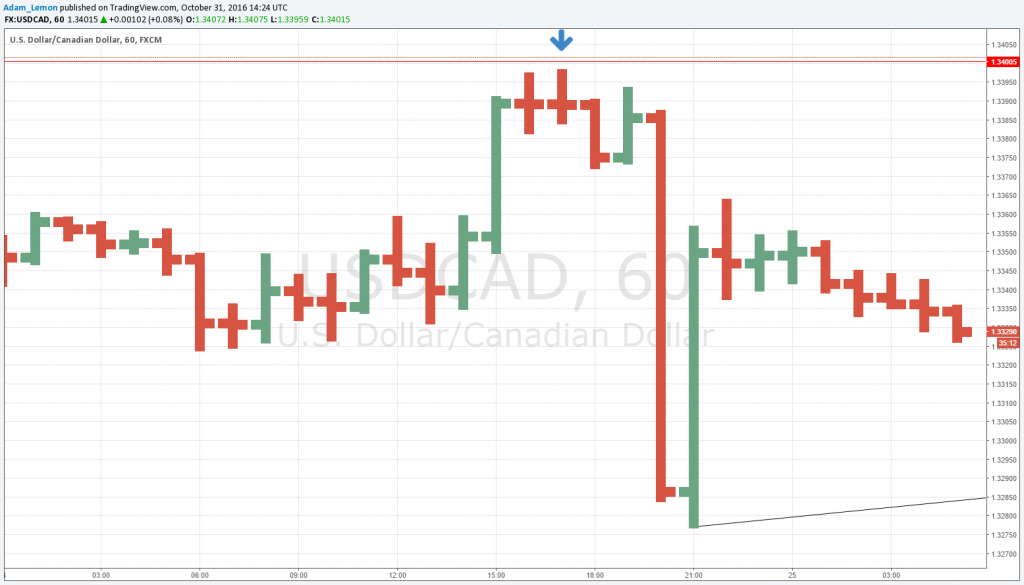
A HIP is any three-bar pattern where the high of the middle bar is higher than the high of both the immediately preceding and succeeding bars. For example:

A LOP is any three-bar pattern where the low of the middle bar is lower than the low of both the immediately preceding and succeeding bars. For example:
Now if you look over a range of candles and see whether you are getting more HIPs than LOPs or vice versa, you can determine the short-term trend, as well as using them for higher-probability entry points in line with the longer-term trend.

