Market structure is my foundation for analyzing markets. All other techniques, for example, candlestick setups and indicators, I only use after I understand the market structure. Without it, I am trading blind. I see market structure as the territory upon which the price moves. If I were to teach someone how to trade from scratch, market structure is where I would start.
This article will show you how to begin using market structure as an effective analysis tool in your Forex trading.
Top Forex Brokers
Definitions of Market Structure
The term “Market Structure” can have two unrelated meanings depending on its context:
- Forex Market Structure. This term refers to how the Forex market is logistically organized, for example, how orders are filled, which institutions provide liquidity, etc.
- Market Structure. This more general term refers to market conditions. For example, is the price in a stable trend? Is there a reversal pattern forming? etc. I sometimes refer to this as “market personality.” I use my definition in the introduction above as the foundation of my trading.
What is Forex Market Structure?
Let’s look at the key attributes of Forex’s market structure.
Spot FX (or Forex) is decentralized (an “over the counter” (OTC) market).
“Centralized” markets, e.g., equities and futures, have centralized exchanges, such as the New York Stock Exchange (NYSE) or the Chicago Mercantile Exchange (CME). Those exchanges gather and execute orders. Forex is different because it has no central exchange to perform that function.
What’s the difference between a centralized market and a decentralized market?
In a centralized market, the price and volume data I see on a broker’s platform are directly from the exchange and will therefore be identical across different brokers. In other words, there is just one price for whatever I am trading, regardless of which broker I use. My broker transmits my order to a central exchange, e.g., the New York Stock Exchange (NYSE) for a US stock trade. The exchange is responsible for filling the order—it’s not the broker that decides which orders get filled first and at what price.
In Forex, without a central exchange, financial institutions trade directly with each other. A decentralized market is also known as “over the counter” or OTC.
The prices for Forex pairs will vary from broker to broker. The broker sets the terms for how they fill orders. For example, some brokers execute the trade internally in a “dealing desk.” Other brokers pass on the trades directly to their liquidity providers and charge a commission for that service.
In a decentralized market, the choice of broker has a greater effect on the quality of execution—some brokers will be faster than others, have different spreads, and give different prices on trade fills.
Choosing the type of broker in a decentralized OTC market is a big topic. There are dealing desk and non-dealing desk brokers which are typically classified as ECN brokers or STP brokers. Some brokers offer both types of accounts. Every kind of account has different costs and advantages.
Even though Forex is decentralized, it is not a completely chaotic market—there is a structure for the market’s operation. This is sometimes known as the “Forex market hierarchy.”
Forex Market Hierarchy
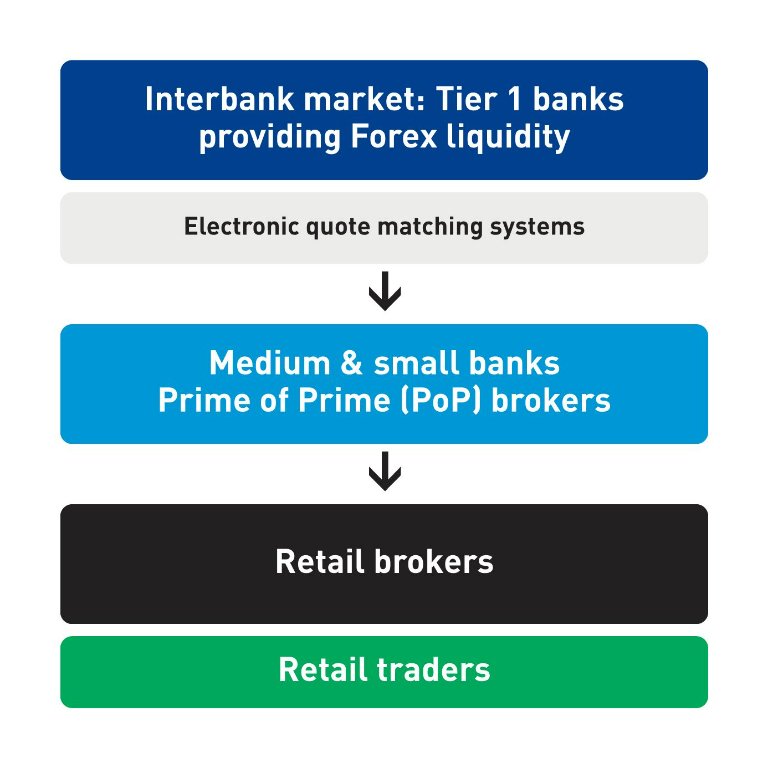
Forex Interbank Market.
At the top of the hierarchy sits the interbank market. These consist of a handful of “Tier 1” banks that provide most of the liquidity we see in the Forex market. Today, the largest Forex liquidity providers are Deutsche Bank, UBS, and Barclays Capital.
Electronic quote matching systems.
The Tier 1 banks can trade directly with each other but also through electronic quote matching systems. Today, two major firms provide this service: Electronic Brokering Services (EBS) and Reuters.
Mid-size & Small Banks, and Prime of Prime (PoP) brokers.
Most retail brokers cannot directly access the interbank market. Instead, they must get their liquidity from smaller banks and prime of prime (PoP) brokers that bridge the gap to the major banks.
Is the Forex Market Hierarchy the same as the Forex Ladder?
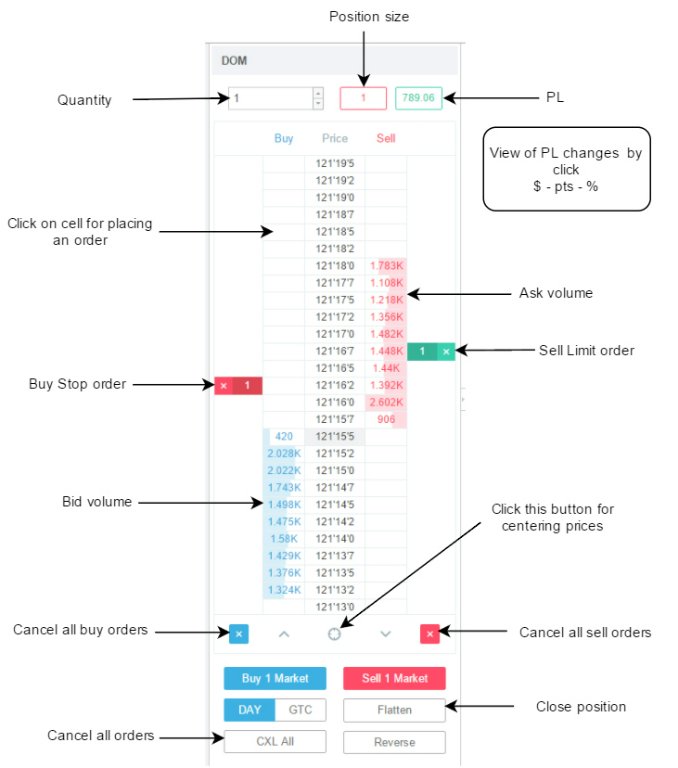
Some writers refer to the Forex market hierarchy as the “Forex ladder.” However, this is not what a “ladder” means in trading. A ladder in trading shows how many open buy and sell orders there are at different prices for a security. It’s also known as ‘depth of market,” or DOM, or the order book.
Here’s an example of a ladder or DOM from TradingView.
Market Structure
Moving on from Forex market structure, this second definition of market structure is the definition I mean in my introduction as the foundation of my trading. Traders often call this “market context” or “market personality.”
Why is Market Structure Important in Trading?
Let’s say I want to trade a candlestick pattern like a hammer or an engulfing bar, both of which are reversal patterns. The problem with looking at the candlestick pattern in isolation is that it does not tell me how the price got there. I would not want to trade the pattern blind—I want to know what the market has done before the pattern appeared. Is the price in the middle of a range? Or against the prevailing trend? Those types of questions refer to the market structure.
Types of Market Structure
There are several main types of market structure:
- Key support and resistance levels
- Trends
- Ranges
- Reversals
Let’s go through each one.
Support & Resistance
When the price bounces and changes direction, it creates a support or resistance.
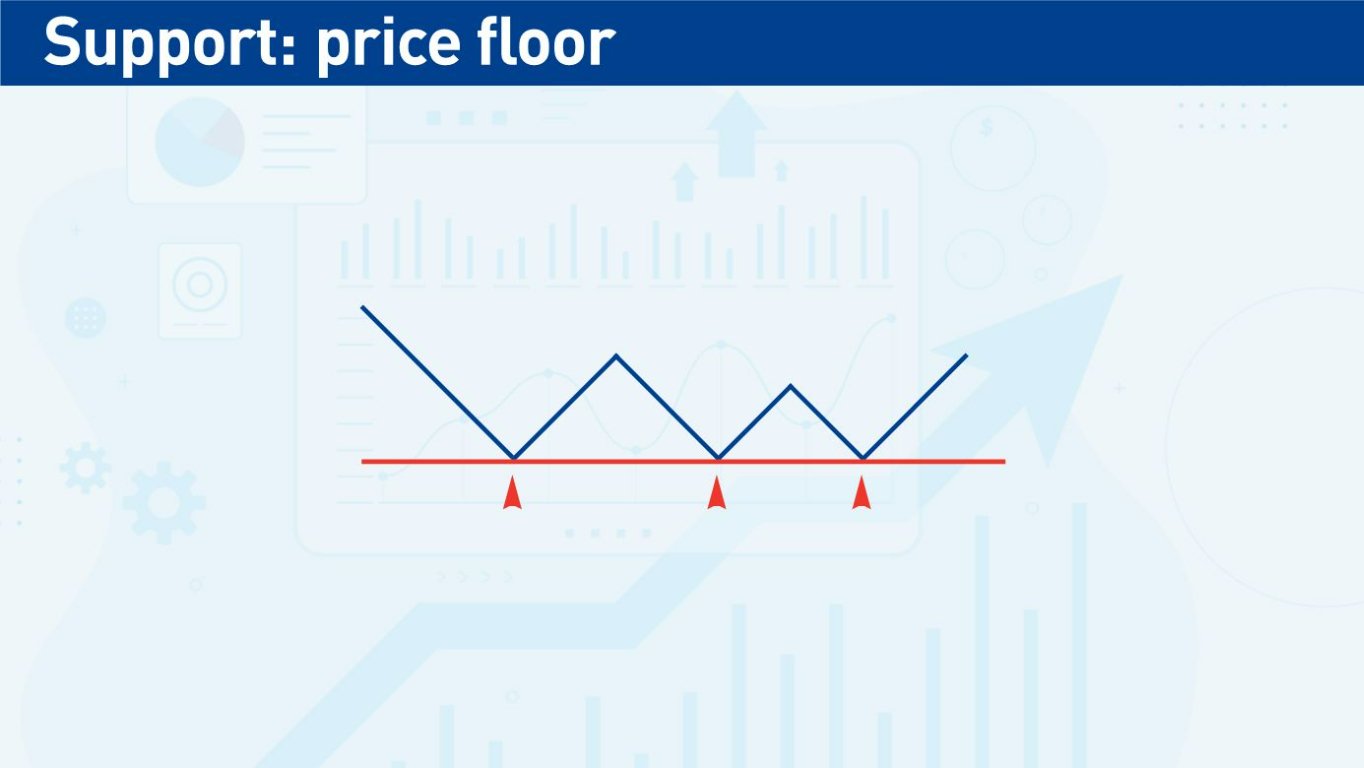
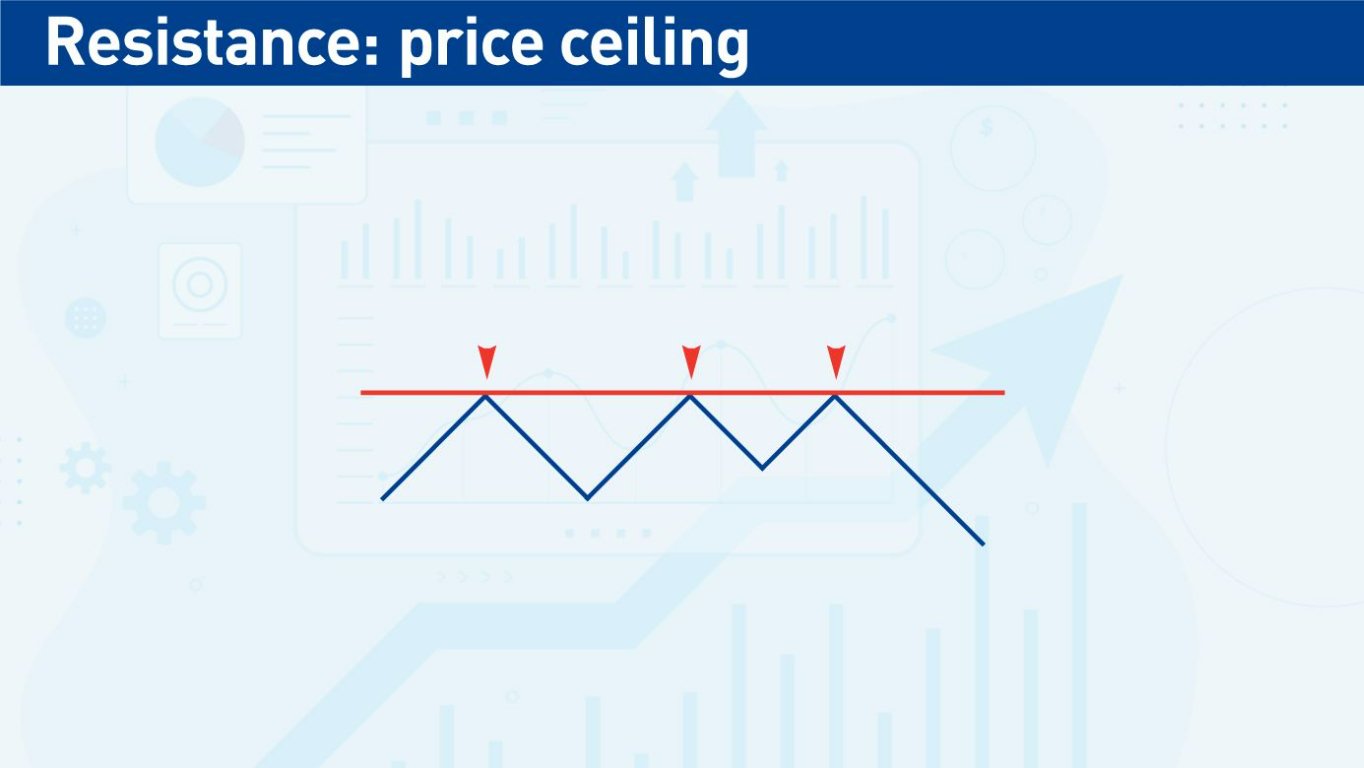
The price can create support and resistance (S/R) levels from one bounce or multiple bounces off a level. The further the price travels after bouncing means that it is a stronger level and harder to break in the future.
The price does not have to bounce against the support or resistance level precisely each time—an approximate bounce can create a support or resistance “zone.”
A great way to enter trades is when a previous resistance level is broken and then becomes a support level. Sellers at the previous resistance level will now want to exit their trades at breakeven, creating a support level where the resistance used to be. In this case, I would enter a long trade after seeing the support level form.
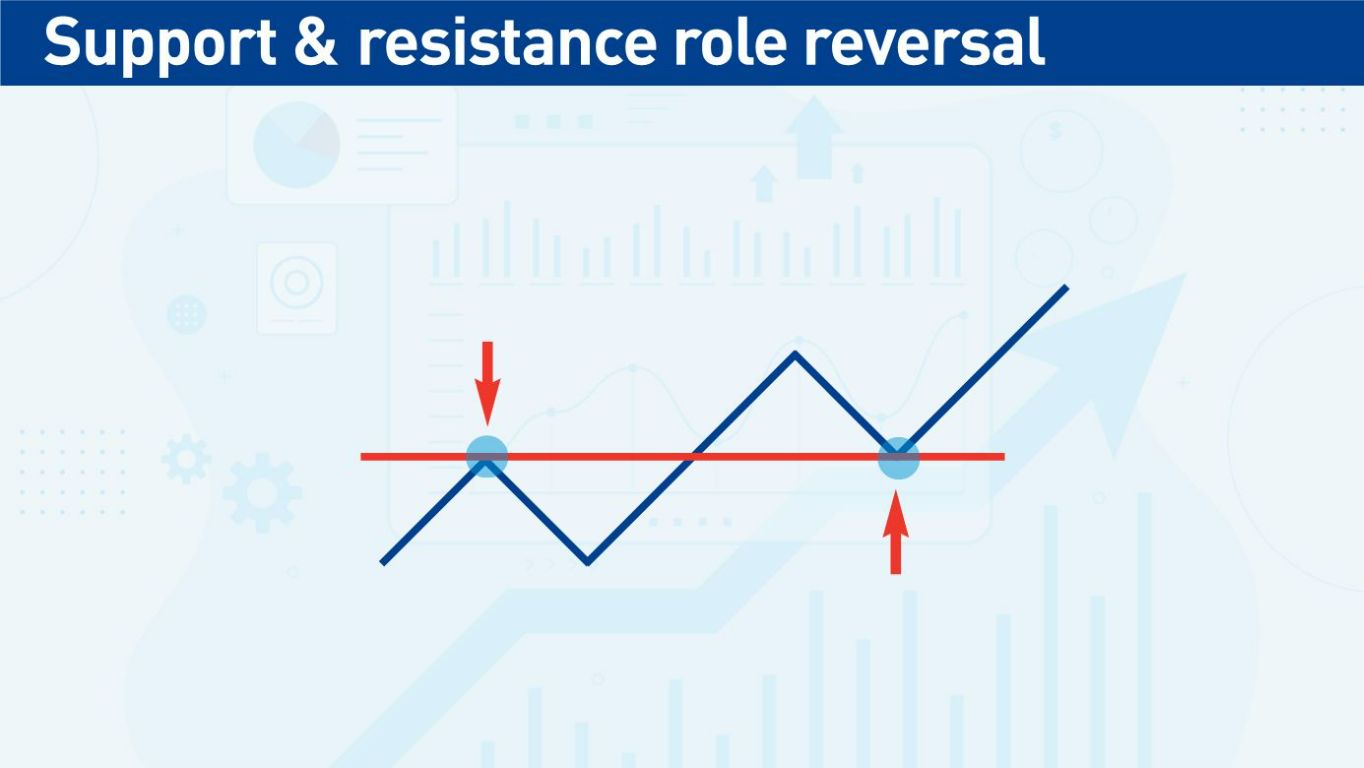
Of course, the opposite can happen - support can become a resistance level.
Trends
“The trend is your friend” is one of the first principles taught in trading because trading in the direction of the trend puts the probability of success in your favour. Why? Because you are trading in the direction the market has already established.
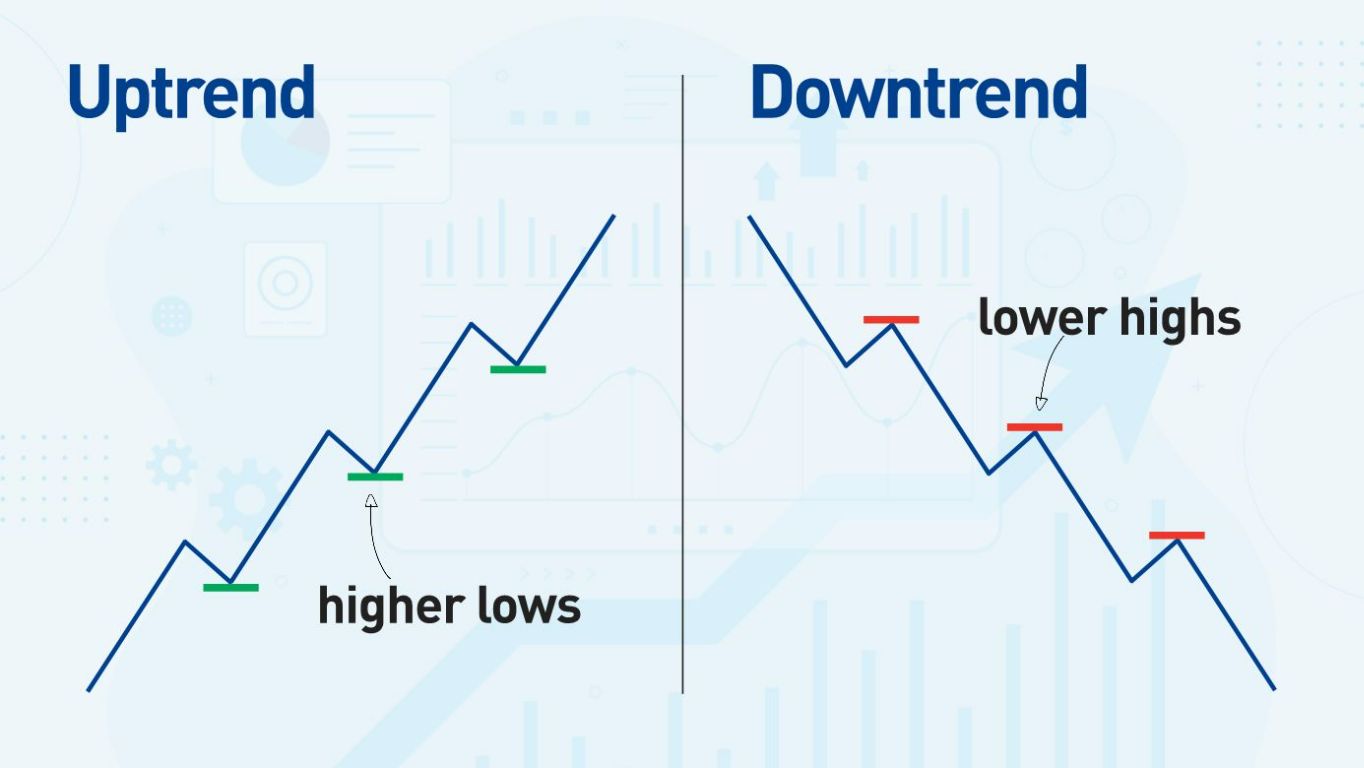
A trend is when the market moves in a sustained direction:
- An uptrend is when the market makes a series of higher lows.
- A downtrend is a series of lower highs.
How do I know when a trend has ended?
- When the price breaks the most recent significant low in an uptrend or the most significant high in a downtrend.
- When the price breaks a trendline.
- When the price makes a reversal pattern and changes direction.
When the price breaks a trend, it does not mean the price will automatically reverse and start a new trend in the opposite direction—the price may go sideways, and a new trend may start in the same direction as the old one. What’s important is that I recognize that the first trend is over and examine the market in a fresh context.
Ranges
A range is when the market moves sideways, and there are horizontal support and resistance levels or zones.
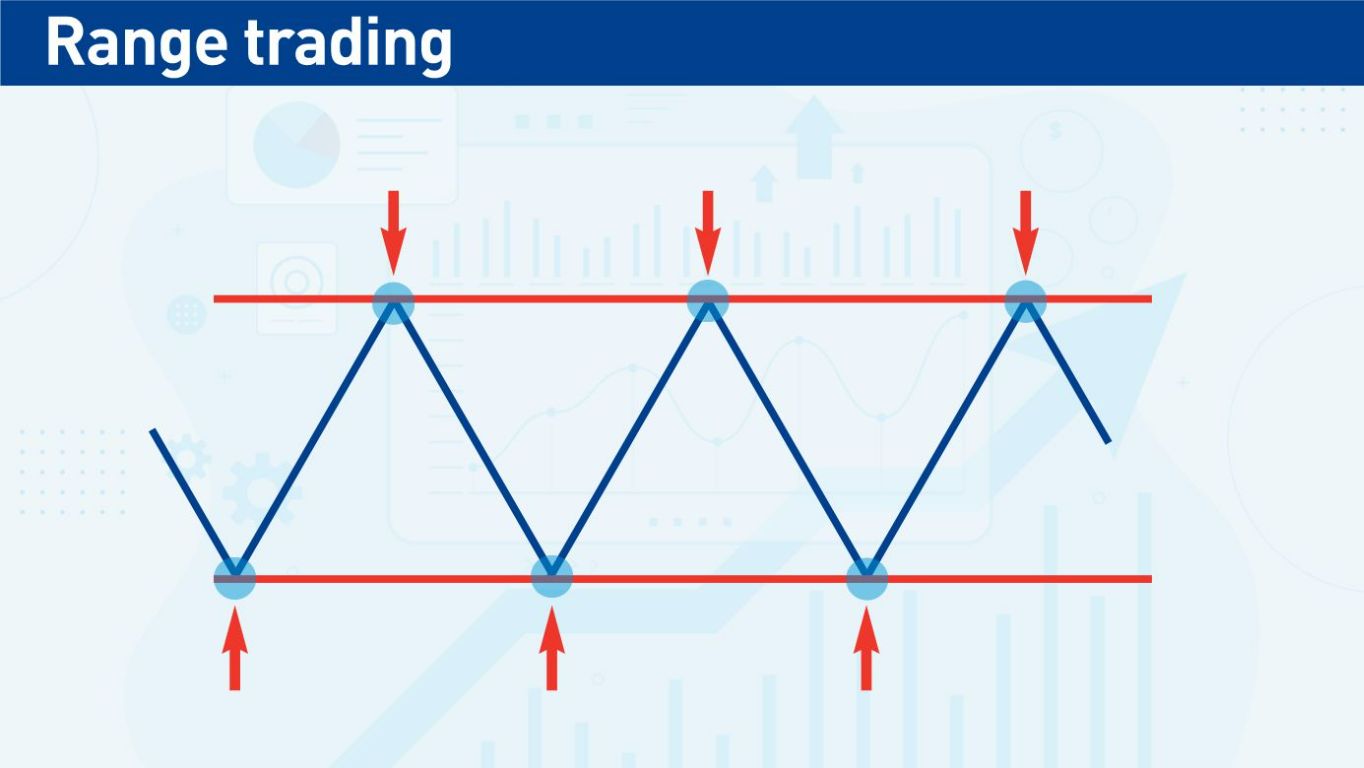
The idea here is to buy near the bottom of the range and sell near the top of the range. If the range is part of a larger trend, it may be best to only take trades in the direction of that trend. For example, if a range appears during an uptrend, I might only enter at the bottom of the market and not go short near the top of the range as I would be trading against the larger trend.
Reversals
Reversal patterns happen when a trend ends and begins to reverse in the opposite direction. Examples of reversal patterns include double and triple bottoms and tops, head and shoulders, and rounded (or saucer) bottoms. Remember that you want to see these patterns at the end of a trend and not in the middle of a range where there’s nothing to reverse.
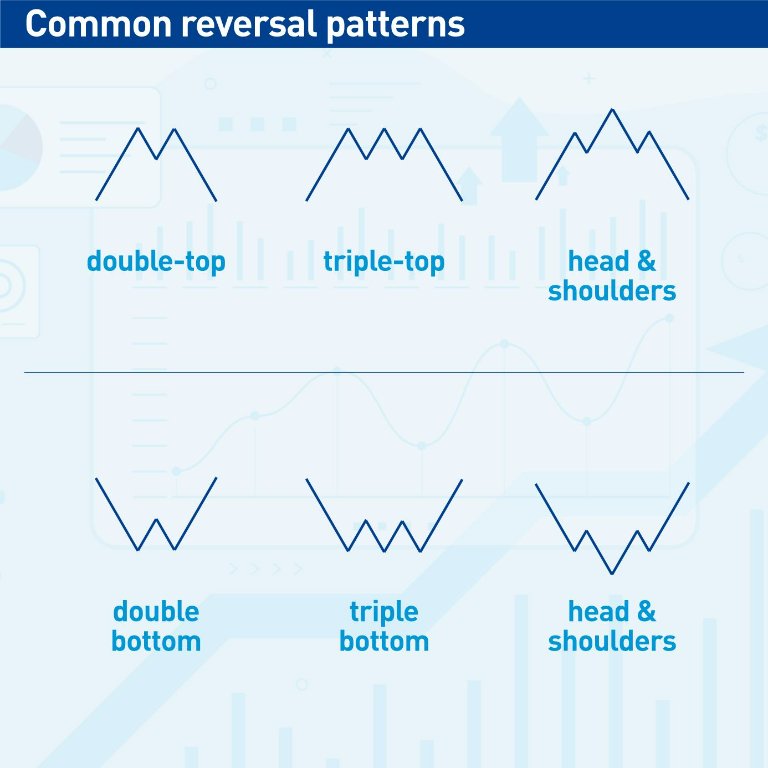
Reversal patterns represent a change in sentiment.
A reversal pattern represents the period when the market sentiment changes, for example, from a bullish trend to a bearish trend. The price will rarely change direction instantly without making a reversal pattern, although it occasionally happens, for example, around unexpected news events. A reversal pattern helps me know that a current trend is ending or helps me enter near the beginning of a new trend.
How to Use Market Structure
Step 1: Choose the timeframe.
Most traders will have a key timeframe to analyze the markets, which may not be the same timeframe they use for execution. For example, my key timeframe is daily charts, but I will drill down to 15-minute charts for more detail and to execute trades.
Step 1: Remove all indicators and look at the raw price.
This removes distractions and biases from indicator settings.
Step 2: Mark key support & resistance levels
Focus more on key levels that are near the current price level.
Step 3: Look for trends and chart patterns.
Again, focus on what the price is currently doing. Is there a trend? Or a range? Has the price recently formed a chart pattern? Or does it seem to be in the middle of forming a pattern?
Market Structure Charts and Examples
Let’s look at two examples: S&P 500 and Bitcoin.
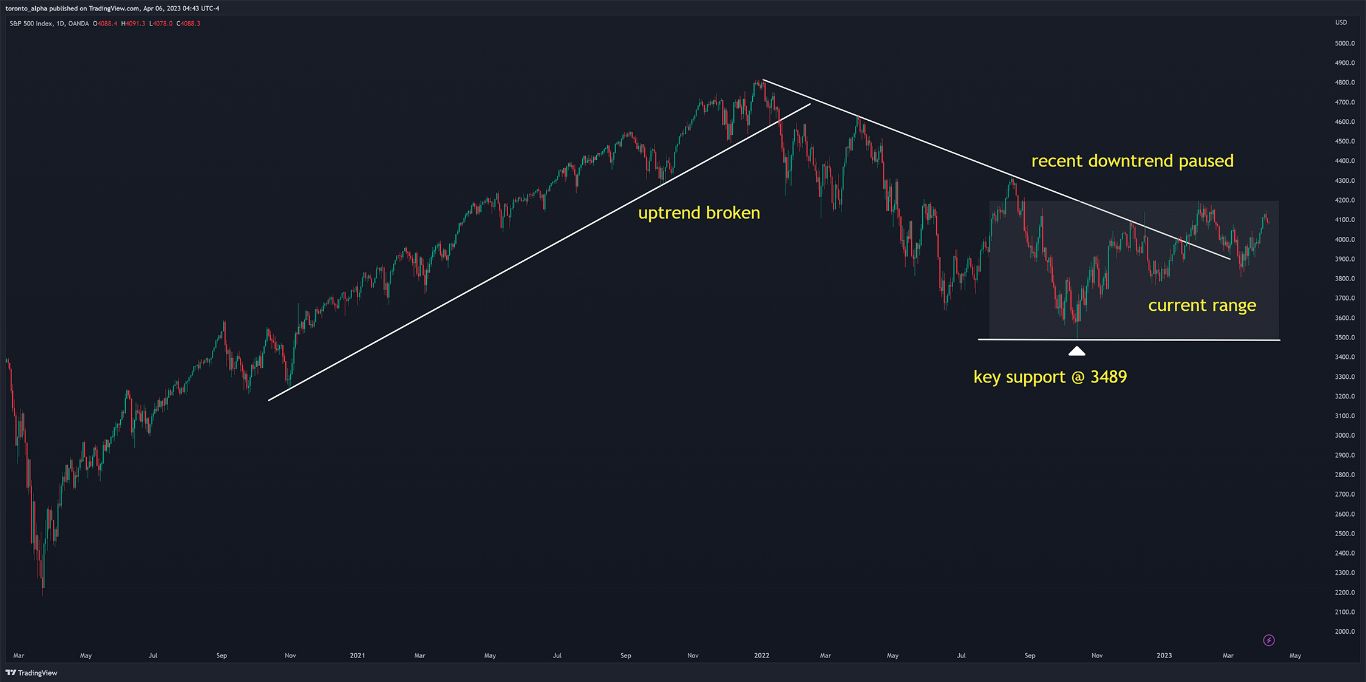
The S&P 500 Index here has settled into a reasonably stable range with a key support level of 3489.
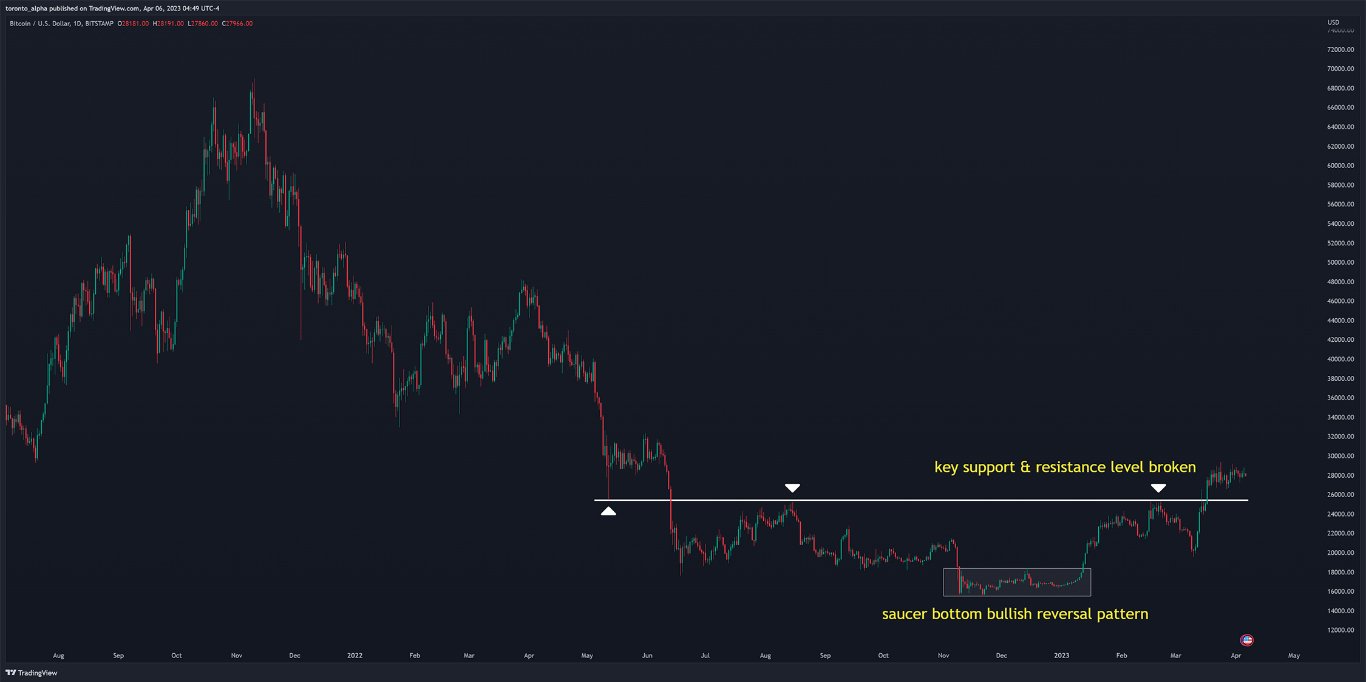 After collapsing in value during 2022, Bitcoin went sideways, made a saucer bottom reversal pattern, and broke through a recent resistance level. In this price chart, it is showing bullish potential.
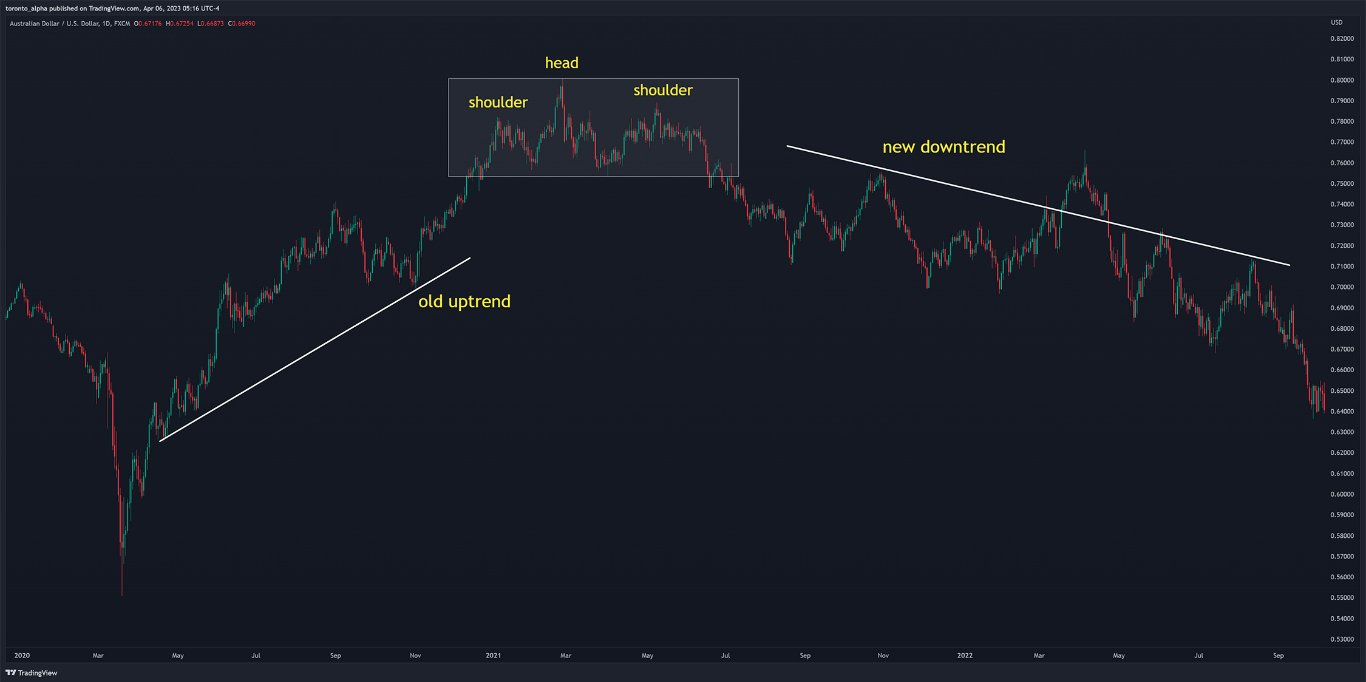
The AUD/USD currency pair in the price chart above reversed an uptrend with a head and shoulders reversal pattern.
Breakout Of Structure
The breakout of structure simply means waiting for the price to breakout of the identified structure and show a clear direction in line with the structure. For example, if I am looking at a head and shoulders pattern, I will wait for the neckline to break. The “neckline” is the support level between the three highs of the head and shoulders pattern.
Pros
- Once the price has broken out of the structure, I know the previous chart pattern is complete. Otherwise, it’s sometimes very easy to guess that I’m seeing a certain type of pattern only for it not to materialize.
- I am now riding confirmed momentum in the direction of my trade.
- I will have a clear support or resistance line from the structure or chart pattern to help place my stop loss.
Cons
- Waiting for a breakout means getting a later entry and missing some of the initial price move.
- The stop will often be wider after the breakout happens.
- If the breakout is a gap, there can be volatility against my direction if the price tries to fill the gap.
Which Assets Work Best with Market Structure?
Market structure is a technical analysis technique. For this type of analysis to be effective, the underlying market must be high volume and liquid. This includes:
- All the Forex major pairs
- Many Forex crosses, especially those involving the Euro.
- Equity indexes
- All the stocks in the Dow Jones 30
- The larger stocks in the S&P 500, e.g., the top 100 stocks by market capitalization.
- Bitcoin and Ethereum
What Is the Best Time Frame to Identify Market Structure?
- Higher timeframes, daily charts and above are best to identify the market structure.
- Market structure below hourly charts is less reliable. Those smaller timeframes are best for executing trades, i.e., timing entries and exits.
- There’s no need to go too high on timeframes. For example, if I execute on 15-min charts, I do not need to go beyond 4-hour or daily charts to examine the market structure.
Pros & Cons of Using Market Structures in Trading
Pros
Market structure provides the context for how the price got from point A to point B and tells me the market conditions. Without this knowledge, I am trading candlestick setups or indicators blind. For example:
- The market structure tells me if I should focus on bullish or bearish setups or both if the market is in a range.
- Knowing the market structure prevents me from trading against trends.
- Knowing key support and resistance levels prevents me from taking trades which would run into the levels and cut my profits short.
This broader knowledge of the market structure makes me more profitable: I get higher win rates and higher reward to risk ratios.
Cons
There are just a very few minor cons of using the market structure when trading:
- Unexpected news announcements can alter the current market structure without notice.
- Once I have examined the market structure, it’s important to realize that conditions can change and not to get married to my previous view. Otherwise, I can continuously trade in the wrong direction and lose money before realizing that my previous analysis was outdated or incorrect.
Combine Order Flow with Market Structure to Increase Your Edge
Order flow trading analyzes the orders placed by other traders on a specific market, i.e., the amount of buy and sell orders at different price points. Traders do this by watching the “order book.” Traders can use order flow analysis to see the subsequent impact on the price of the market by these orders and therefore make predictions on the future price and direction of the market. Order flow trading is sometimes referred to as a form of volume trading.
Bottom Line
The Forex market structure is how the Forex market is organized for trading. It’s a decentralized “over the counter” market without a central exchange. Prices and execution can vary between brokers, so the choice of broker has a larger effect than for markets with centralized exchanges, such as equities and futures.
Market structure is the roadmap to identifying market conditions. Is the market trending, in a range, or making a reversal pattern? Knowing the answers to these questions gives me a bias for trading long or short or may even tell me that I am unclear about how a market could move and that it’s best to look at a different market. If the trading conditions are not clear, I can always wait to trade.
Market structure is important because I am trading blindly without it. Ultimately, using market structure makes me more profitable, and that’s all that matters.
