What is the Fibonacci Series?
Top Forex Brokers
The story begins in 13th century Italy with an Italian mathematician called Leonardo Fibonacci. He is widely considered to be the star mathematician of the Middle Ages in Europe and was probably most famous during his lifetime for popularizing the Hindu/Arabic numerical system in widespread use today: our decimal digits from 0 to 9, “base ten” number system. This is intuitively easy for humans to understand, as we are naturally born with ten fingers which we use to count with as children. Prior to his work, Europeans used the Roman system of numerical letters, which seems cumbersome and mathematically inelegant by comparison.
Signore Fibonacci also produced another notable mathematical innovation: the Fibonacci Number sequence. He noticed that if you begin with 1 and 1, you can then derive a sequence of numbers where each number is the sum of its preceding two numbers. Therefore, the first few numbers in the standard Fibonacci sequence runs like this:
0, 1, 1, 2, 3, 5, 8, 13, 21, 34, 55, 89, 144, 233, 377, 610, 987...
Why did Fibonacci derive the sequence? He was considering the solution to a puzzle where it is asked, if we start with a single pair of breeding rabbits, which never die, and every mating pair produces another breeding pair, how many rabbits will there be at the end of one year? The Fibonacci sequence solves the problem.
That’s not the end of the story. If you take a Fibonacci number within the sequence and divide it by its following number, you get a result equal or at least very close to 61.8%, otherwise known as the “golden mean” or “golden ratio”, as it is sometimes known. This is where things really start to get interesting!
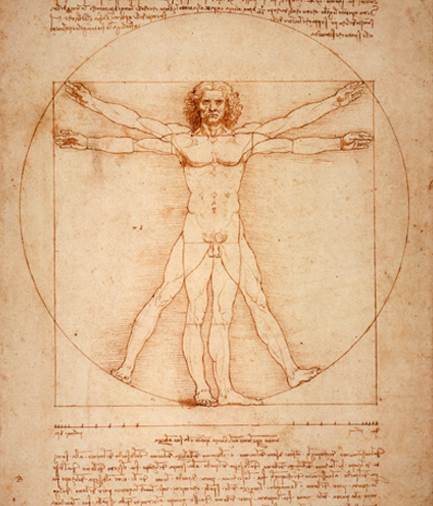
Since ancient times, many mathematicians, scientists and architects have noted that throughout geometry and nature, the ratio seems to appear again and again. It developed the nickname of the “divine proportion”. As an illustrative example, imagine a line of squares or other equal geometric designs, each of which is 161.8% times the size of its predecessor. In the human body, it can be observed in several cases. For example, each section of the index finger is about 161.8% the size of its preceding section (working from the tip of the finger down). The ratio of the forearm to the hand is also 161.8%.
Although some analysts have pointed out that many famous works of art that are commonly assumed to be based upon this “divine proportion” in fact are not, it is sufficient for our purpose.
To note that the Fibonacci sequence is seen by many as a way of tapping into a mathematical sequence of nature, and as such may be used by traders to their advantage.
The Golden Ratio
This sequence, as ordinary as it looks, has some very special properties. The most sited aspect is something called the “Golden Ratio”.
Let’s look at the Golden Ratio and how it’s derived. If you pick any number in the series, and divide it by the next one along, the answer will equal 0.618 or (61.8%). For example, 89 divided by 144 equals 0.618. Or you could pick 610 divided by 987. The answer will still be 0.618. This characteristic will hold no matter how long you continue the Fibonacci series for and whichever two numbers you pick. So, 61.8% is the Golden Ratio.
Now at this point, it’s worth touching upon what separates Fibonacci from other stuff out there in the world of Technical Analysis.
The Fibonacci series and The Golden Ratio are a natural phenomenon – it is not something that was invented artificially. Rather it was discovered every day in the world around us. Most readers are already aware of this, but its significance is often overlooked. When you are using Fibonacci points on a chart, you’re not looking for something that has been designed for trading that may work some of the time and not at other times, like an indicator. Instead, you are using something that is inherent in natural systems such as in the movement of planets, the proportions of the human body, and importantly for us the movement of price in a market and on a chart.
One example of its inherent quality is when there is an economic data release. You will find that even during a time of data release the price movement still obeys Fibonacci points – and data releases knockout regular technical indicators.
Other Fibonacci Levels
Aside from 61.8%, there are other Fibonacci percentages. Where do they come from?
Well, instead of dividing one Fibonacci number by its adjacent number, you can use numbers one or two places apart. So let’s use 233 as an example to generate other Fibonacci percentages as follows.
Taking the consecutive Fibonacci numbers:
55, 89, 144, 233, 377
You get:
55 / 233 = 23.6%
89 / 233 = 38.2%
144 / 233 = 61.8%
233 / 233 = 100%
377 / 233 = 161.8%
Above 100%, you can use the multiples of the first set of percentages – 123.6%, 138.2% etc. As you can see from the above, 161.8% is a true Fibonacci percentage and is the inverse of 61.8%.
In addition to the above percentages, further ones are derived by squaring (or multiplying by itself) the Golden Ratio, 0.618. This then gives you:
0.618 x 0.618 = 0.786 (78.6%)
0.786 x 0.786 = 0.886 (88.6%)
0.886 x 0.886 = 0.941 (94.1%)
Fibonacci can be applied in many ways when trading, but the two key approaches we are going to study in this section are Retracements and Extensions.
What is a Retracement?
A retracement is when the market moves in one direction and then changes to move back in the opposite direction. The second move in the opposite direction is called the “retracement”. This is obviously a pretty simple concept, and something regularly seen on any chart. Let’s look at a retracement of a recent fall in the value of the GBP/USD (also known as “Cable”) currency pair.
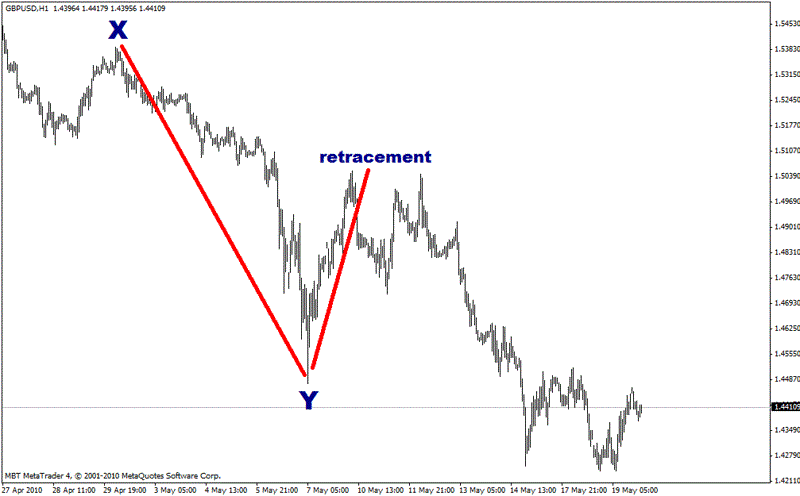
The market fell from Point X to Point Y, about 900 pips. It subsequently retraced this move by 500 pips before pushing on in the original downtrend. The second move up from Point Y is the Retracement.
Now let’s see if there is a fit with the Fibonacci percentages. When you hear the term “Fibonacci Retracement” it means that the amount the market moves in the retracement phase corresponds to one of the Fibonacci percentages, such as 38.2% or 61.8%.
Looking at the same retracement of GBP/USD, 61.8% clearly acts as a major level that defines the size of the retracement. That means the currency moved from Point X to Point Y, and then moved back 61.8% of the original distance.
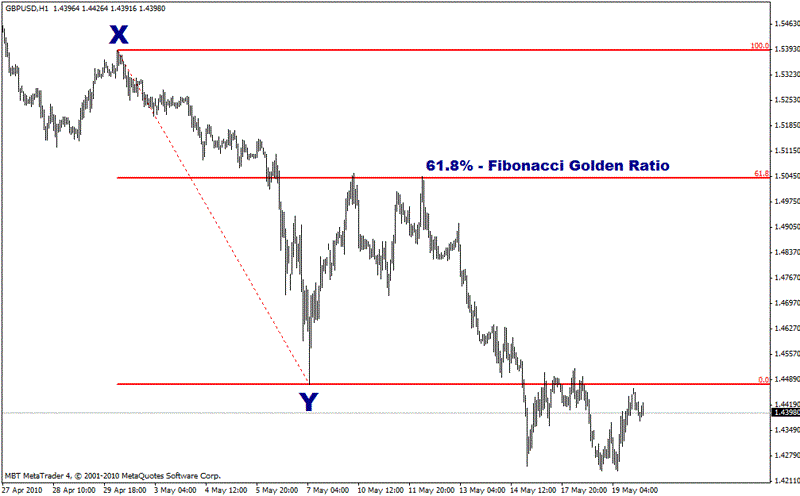
Chart reference:
Hourly bars
Point X: 2010-04-30; 0200 EST; 1.5473
Point Y: 2010-05-07; 0500 EST; 1.4475
Of course, a retracement can extend beyond 100%, i.e. go past the size of the original move. Let’s take another starting point on the same currency. Look at the final push up highlighted by the red arrow before Cable moved down to Point Y.
Now, let’s look at the Fibonacci percentages beyond 100%. As can be seen on the chart, 123.6% is another clear Fibonacci level for the retracement.
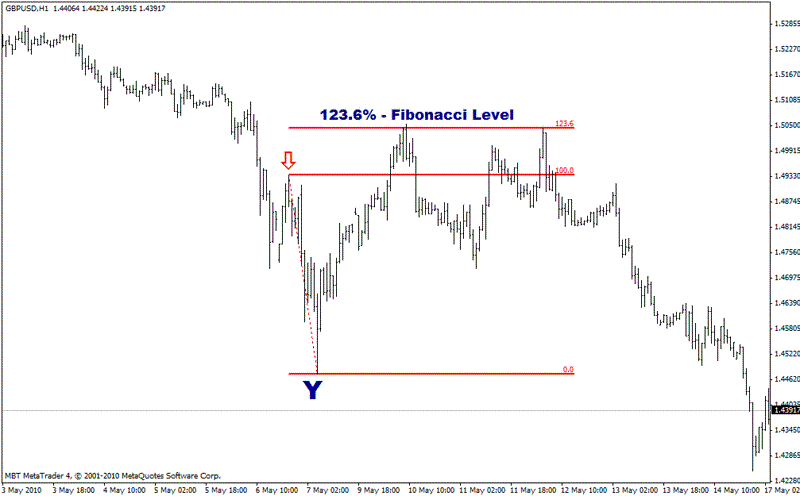
This Fibonacci level, at approx. 1.5045, confirms the previous one defined by the 61.8% retracement from Point X to Point Y. Here’s a combined chart:
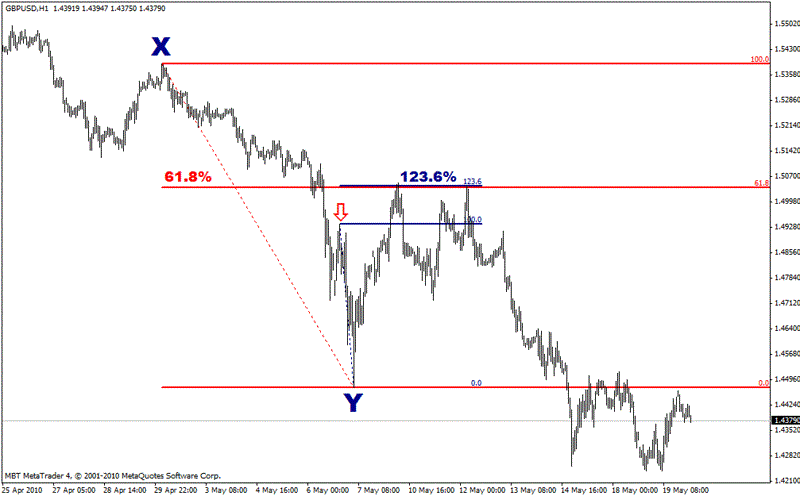
Spotting this area as a key Fibonacci level, even after the price had bounced off it, offered an achievable 500 pips of trading profits.
How to Use Fibonacci Retracements to Enter a Forex Trade
One of the most favored ways to trade Forex is to wait for a strong directional movement, then wait for it to retrace, and then enter when the retrace ends in the direction of the original strong movement. This is often done as a “breakout” trade, with the entry being placed just above the high or low (as applicable) of the original move:
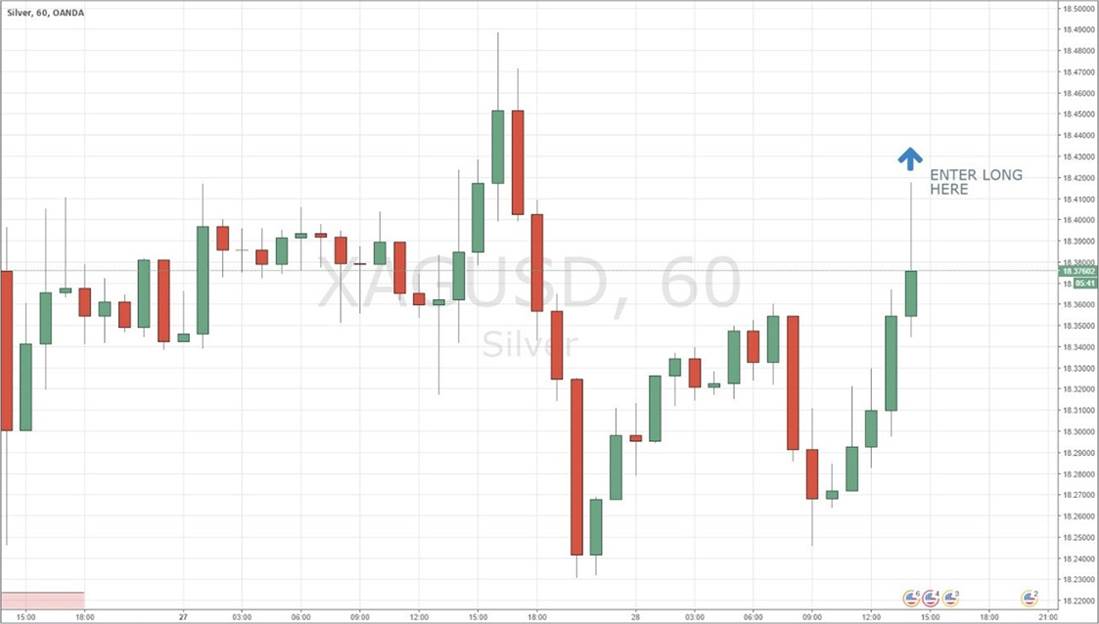
The run of 5 consecutive green bullish candles on the right of the image show a bullish move. If the high price of the move, marked by the text and arrow, is exceeded, then we have a breakout.
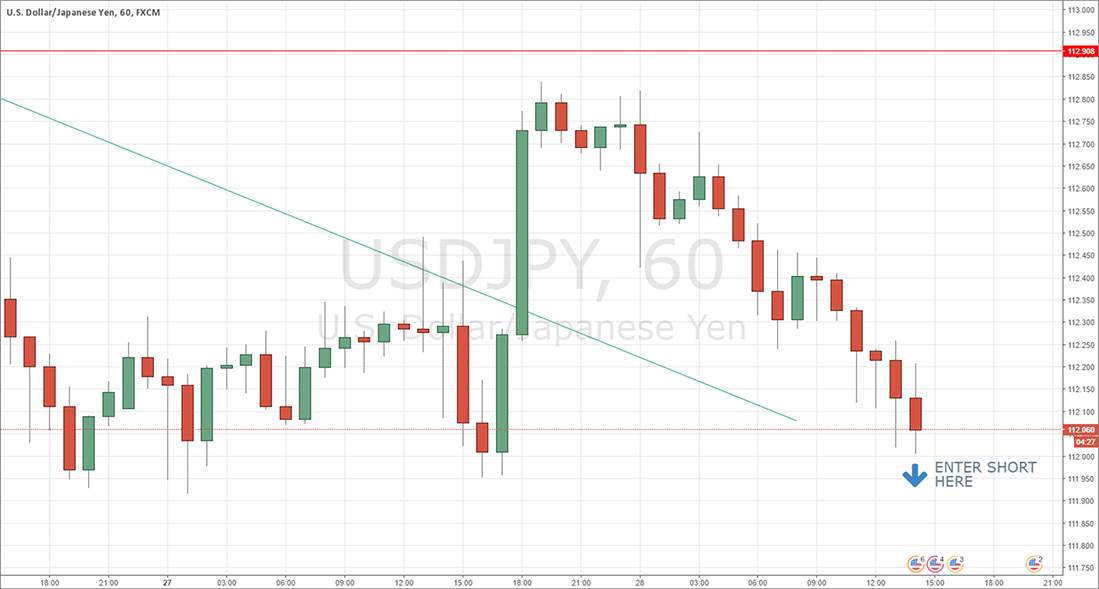
The run of 30 mostly red candles on the right of the image show a bearish move. If the low price of the move, marked by the text and arrow, is exceeded, then we have a breakout.
As an alternative, a trader might instead wait for an original, “qualifying” directional move, and then use Fibonacci values to determine points where the retracement is likely to turn around and resume the original movement. It is important to note that Fibonacci does not have to be used as the only tool in this method – it can be used in conjunction with price action, round numbers or other indicators giving correct readingsfor confirmation.
Before we can examine some examples, we must firstunderstand how the Fibonacci retracement values are calculated. Don’t worry, you won’t have to calculate them yourself – every charting platform includes a Fibonacci retracement tool as a built-in indicator.
Fibonacci retracement indicators indicate horizontal values equal to a percentage retracement of the movement that is being measured. The values that are usually indicated are:
50.0% - this is not a Fibonacci number in any way, but it usually included in the sequence, the logic being that half way is an important psychological tipping point.
61.8% - the Golden Mean/Ratio. Divide any number within the sequence by the number directly to its right, for example 34/55.
78.6% - the square root of the Golden/Mean ratio of 61.8%. Some indicators do not include this value.
Additionally, there are a few indicators which include 76.4%. This is not a Fibonacci number, it is just 1 minus the first Fibonacci number of 23.6%.
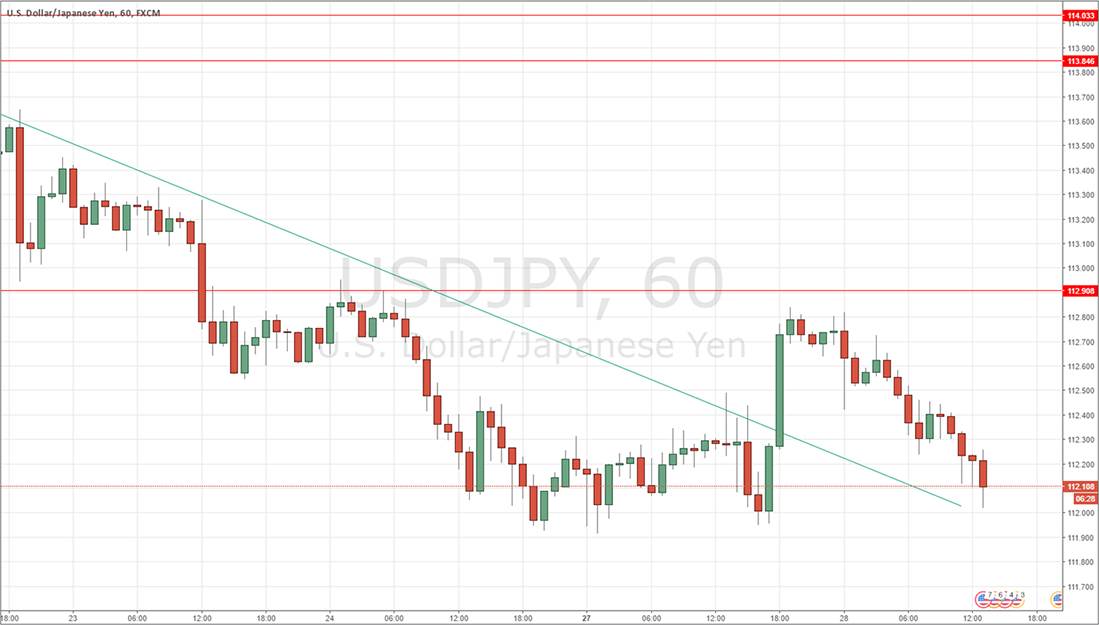
Now let’s look at an example. Imagine you see that the price of USD/JPY is in a long-term downwards trend, so you are interested in selling short USD/JPY. On the hourly chart, you see a reasonably large downwards move which looks like this:
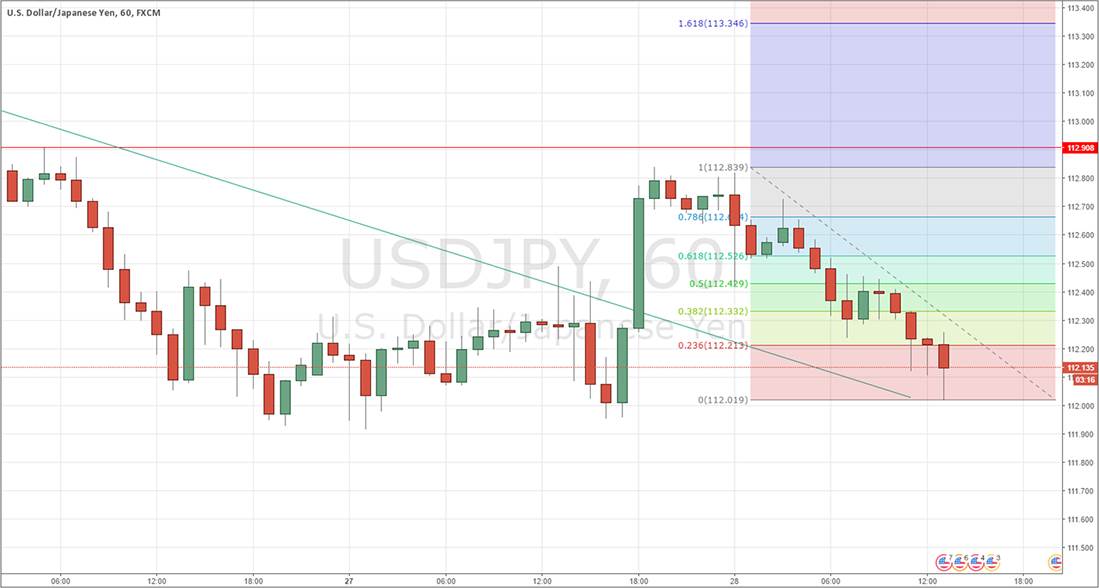
You decide that you want to sell with a limit order above the current price. You pull up the Fibonacci Retracement indicator/tool in your charting platform, and you click on the swing high (the other end of the move from where the price is now) and draw it down to the swing low before clicking again (nearer where the price is now). When you have drawn the Fibonacci Retracement, it looks like this:
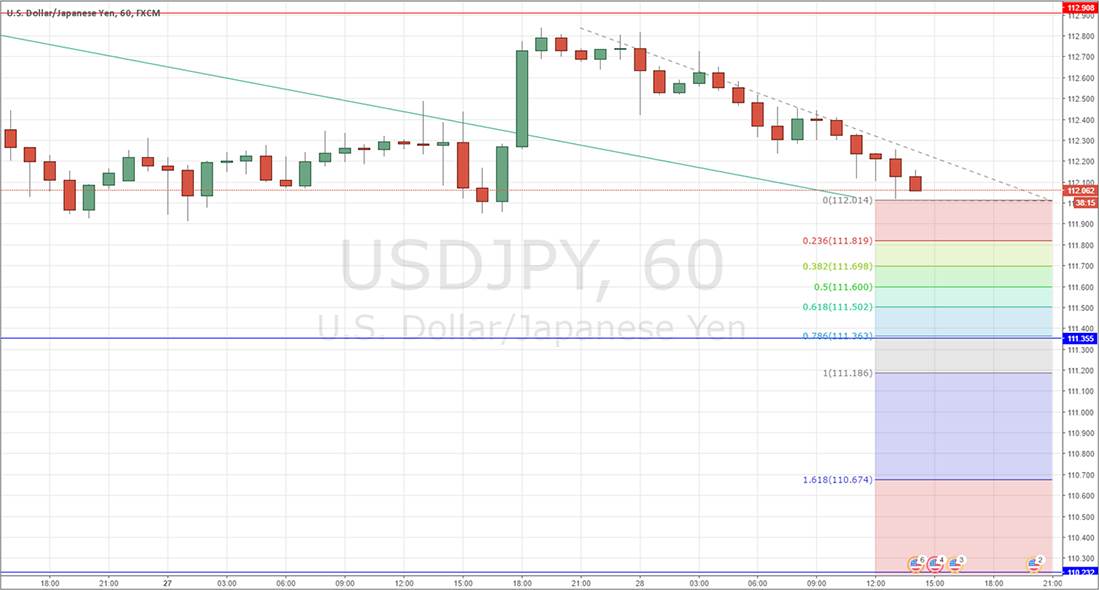
You can now place your limit order to go short at any of the prices marked by the Fibonacci proportions within the downwards movement. The logic is that a retracement is likely to stop at one of them. Which one should you choose? That could depend upon a lot of factors beyond the scope of this guide. Are any of the Fibonacci levels confluent with an obvious barrier to price, such as a round number? Not in this example. All I can see here that stands out is the 50% retracement level at 114.43 which acted as resistance for three hours after the price broke below it. For that reason, this level might be a good choice.
What is an Extension?
An extension of a trend is exactly what it sounds like – the price moves, retraces, and then extends in the original direction. So, the Extension is the portion after the retracement.
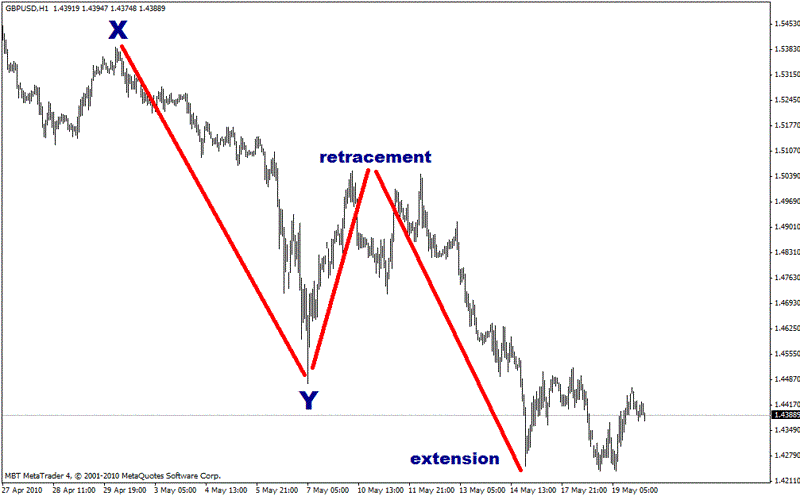
How do we measure the Fibonacci percentages of an extension? You measure the size of the original move (Point X to Point Y) from the end of the retracement or the beginning of the extension. This gives you potential targets to where the extension could go on to.
On MetaTrader, you can create the extensions by going to the menu bar at the top:
Insert > Fibonacci > Expansion
(MetaTrader obviously calls Fibonacci Extensions “Expansions”.)
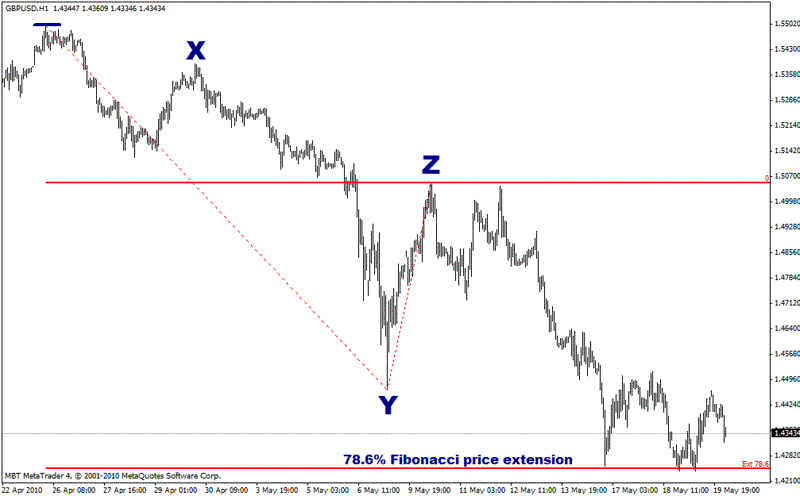
So, looking at the next chart, you start measuring the Fibonacci levels from Point Z, the start of the extension. On this chart, the value of Cable bounces neatly off the 88.6% Fibonacci extension level. What that means is that the price moves from Point X to Point Y, then moves up to Point Z, and then moves down covering 88.6% of the distance between Point X and Point Y before moving back up again. You may need to read that last sentence over a couple of times, but it explains exactly the logic of Fibonacci Extensions.
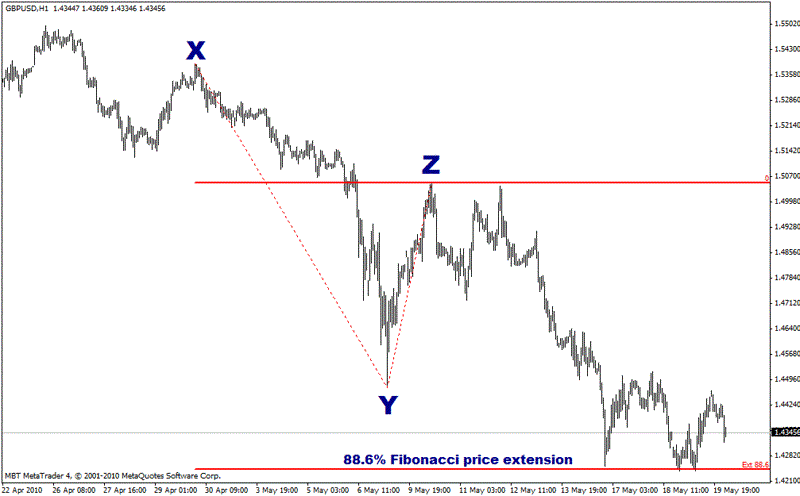
Chart reference:
Point Z: 2010-05-10; 0900 EST; 1.5053
This Fibonacci extension level, at approx. 1.4245, is confirmed in several ways. If you picked at the previous high prior to Point X (marked with a blue line on the next chart) as your starting point instead of Point X, you can see the price bounces off the 78.6% Fibonacci Extension.
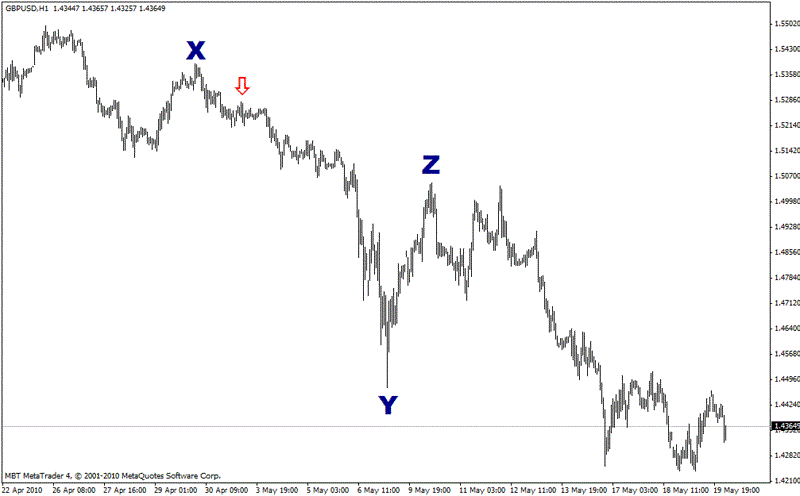
Here is yet another confirmation – shortly after Point X, the price popped up to make a small high (marked with a red arrow), before making its final descent to Point Y.
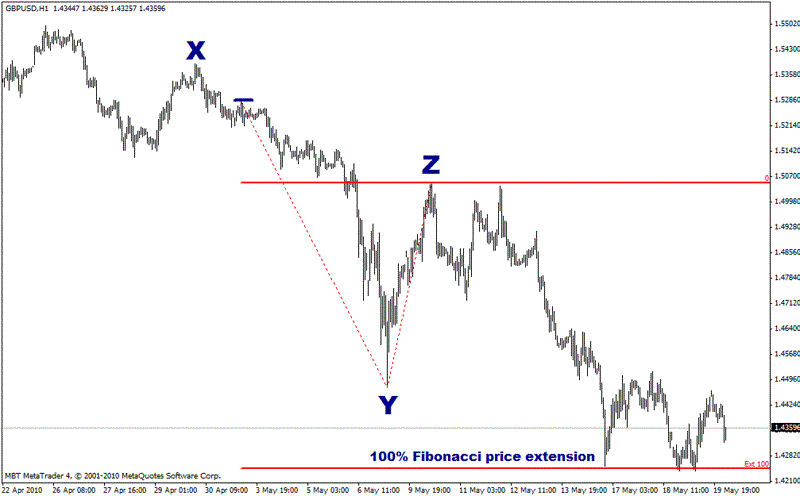
Using that small high as a starting point, the recent bottom in Cable is a 100% price extension.
And finally, here is a combined chart:
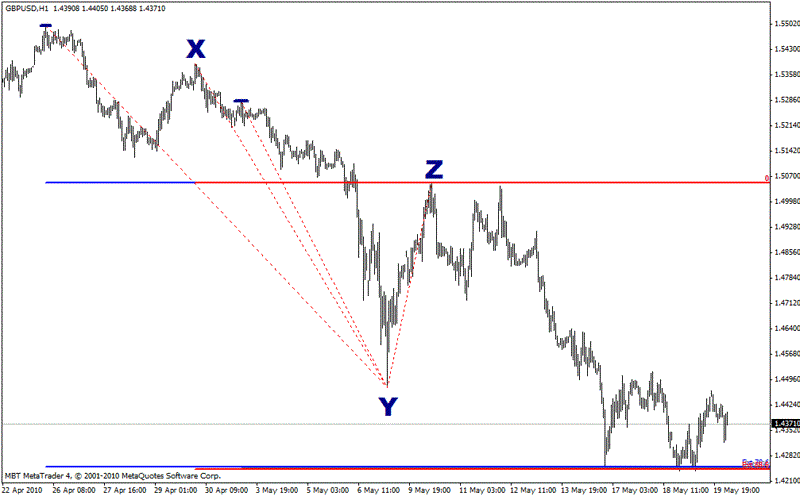
Now the lines are so close together, you can barely make them out. The Fibonacci analysis pointed in advance to this level being an area of support.
All the examples in this section are using Fibonacci levels discussed in my previous post, Part 1. For the sake of clarity on these charts, I have removed the other Fibonacci percentages when showing a retracement or extension. When I am analyzing my own charts from scratch, I will be using all the Fibonacci points discussed in my previous post (Part 1). I will be picking off major highs and lows, usually on the 1 hour and 4 hours, and occasionally 15-minute charts, to find my levels. I am particularly interested at points where the Fibonacci levels meet, and interested most in the 61.8%, 78.6% and 88.6% levels.
Depending on my view on the market, I may use a Fibonacci cluster to place a trade or avoid the cluster if I first need to see it rebound or broken. For example, if I wish to go long, but there is a Fibonacci cluster a few pips away, I will either wait until it is broken, or wait for a better (lower) entry to give myself more room to maneuver. Never trade without stops and keep an eye on your risk/reward ratio always.
How to Use Fibonacci Extensions to Exit a Forex Trade
The Fibonacci Extension tool/indicator uses the same Fibonacci calculations to produce, instead of an estimation of where a retracement move might stop, an estimation of where a further “wave” in the direction of the original movement might go – or to be more precise, the maximum favorable distance such a move might travel.
As an example, we can use the USD/JPY short move which we examined in the previous chapter. You draw the Fibonacci Extension in the same way the drawing of the Fibonacci Retracement was described there. The indicator/tool then produces a few price targets, as shown below:
The next stage is to examine each level and decide whether each is any good as a profit target, even if it is to take a partial profit. Keep in mind that it is important in trading not to take profits too early. Examining the chart, do we see any confluences?
There are two numbers which stand out as we work our way down the chart. Firstly, the 61.8% projection which is the “Golden Mean/Ratio”, is confluent with 111.50, which is a half number. Secondly, below there is an even better confluence of the 78.6% extension level with 111.35, a key historical support level for this pair that I had marked on my chart from the past.
We haven’t mentioned using Fibonacci numbers to set stop losses, but of course it is possible to do so. For example, in the example above, you could simply apply the Fibonacci extension in the other direction (drawing away from the bottom end to the top) and use one of the extension levels shown in the result – especially if it is confluent with a significant price or other indicator.
One thing that should be mentioned before we conclude this chapter is that it can sometimes be difficult to know which point to use for the start of the Fibonacci measurement. In the above example, the swing high point is very clear, but on other occasions it will be hard to pick. Sometimes there might be a swing high which is not the true “beginning” of the movement. In these cases, it is up to you whether to pick the technical recent high or low, or the price from which the strong up or down move seems to have truly begun.
Fibonacci: A Leading Indicator
Indicators such as moving averages and stochastics are generally attempting to fit onto a market. They may not necessarily work in all market conditions and they do not have any intrinsic properties that a market has to abide by.
However, this is not true of Fibonacci. What I think makes Fibonacci exceptional is that the Fib ratios are inherently part of natural systems, including the markets. Fibonacci ratios do not have biases for certain market conditions or economic cycles. And Fib ratios aren’t trying to fit a certain style or market; rather they are simply a natural part of market movements.
This makes Fibonacci robust, versatile and timeless.
One of my favorite Fibonacci plays is a retracement from the 88.6% level. This level is derived by taking the 61.8% Fib Golden Ratio, square rooting it, and square rooting it again.
A retracement consists of an initial move, a retracement of that first move, and then the subsequent move from the retracement, like so:
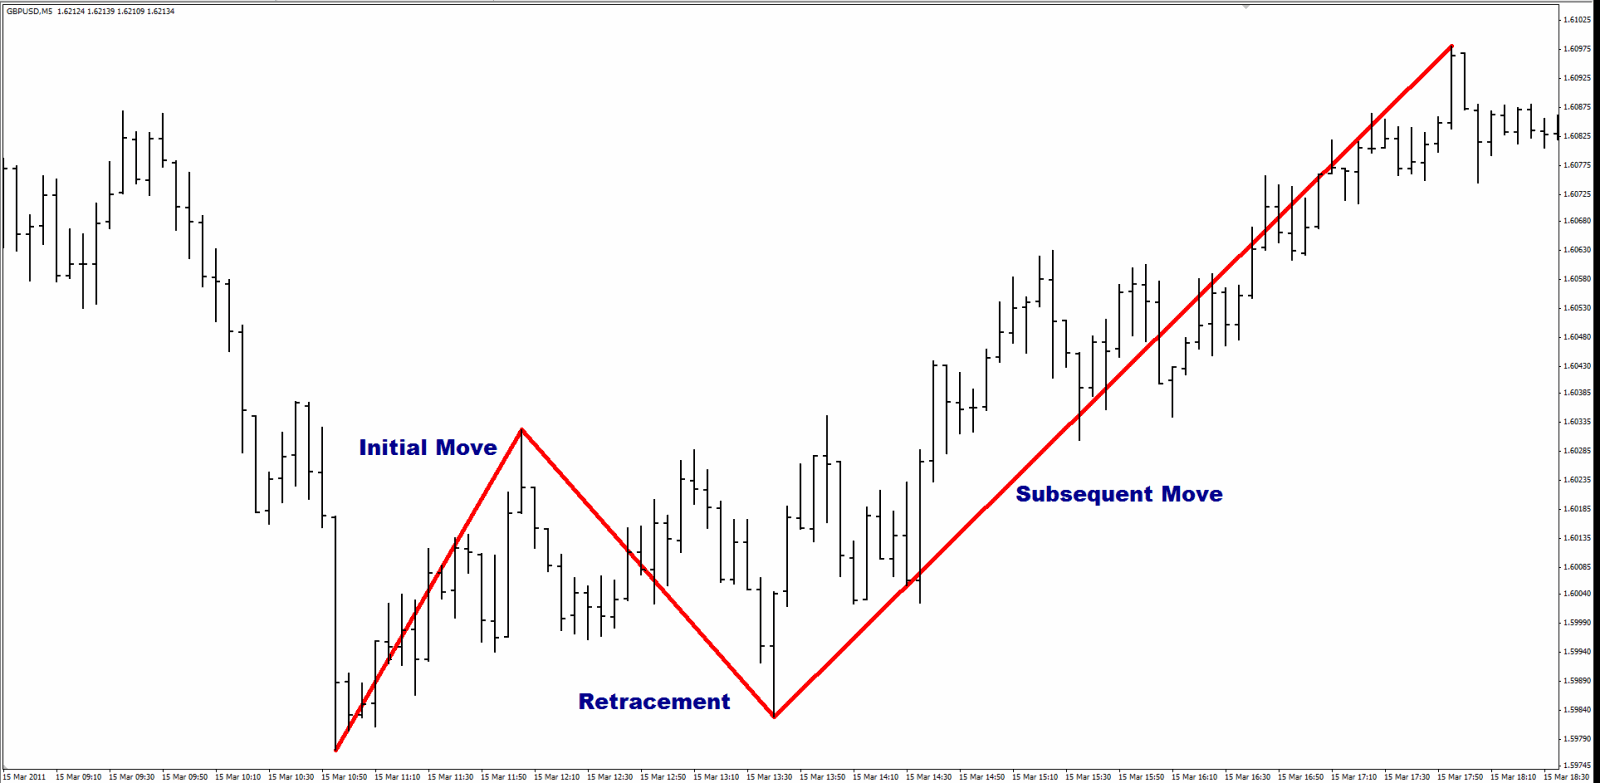
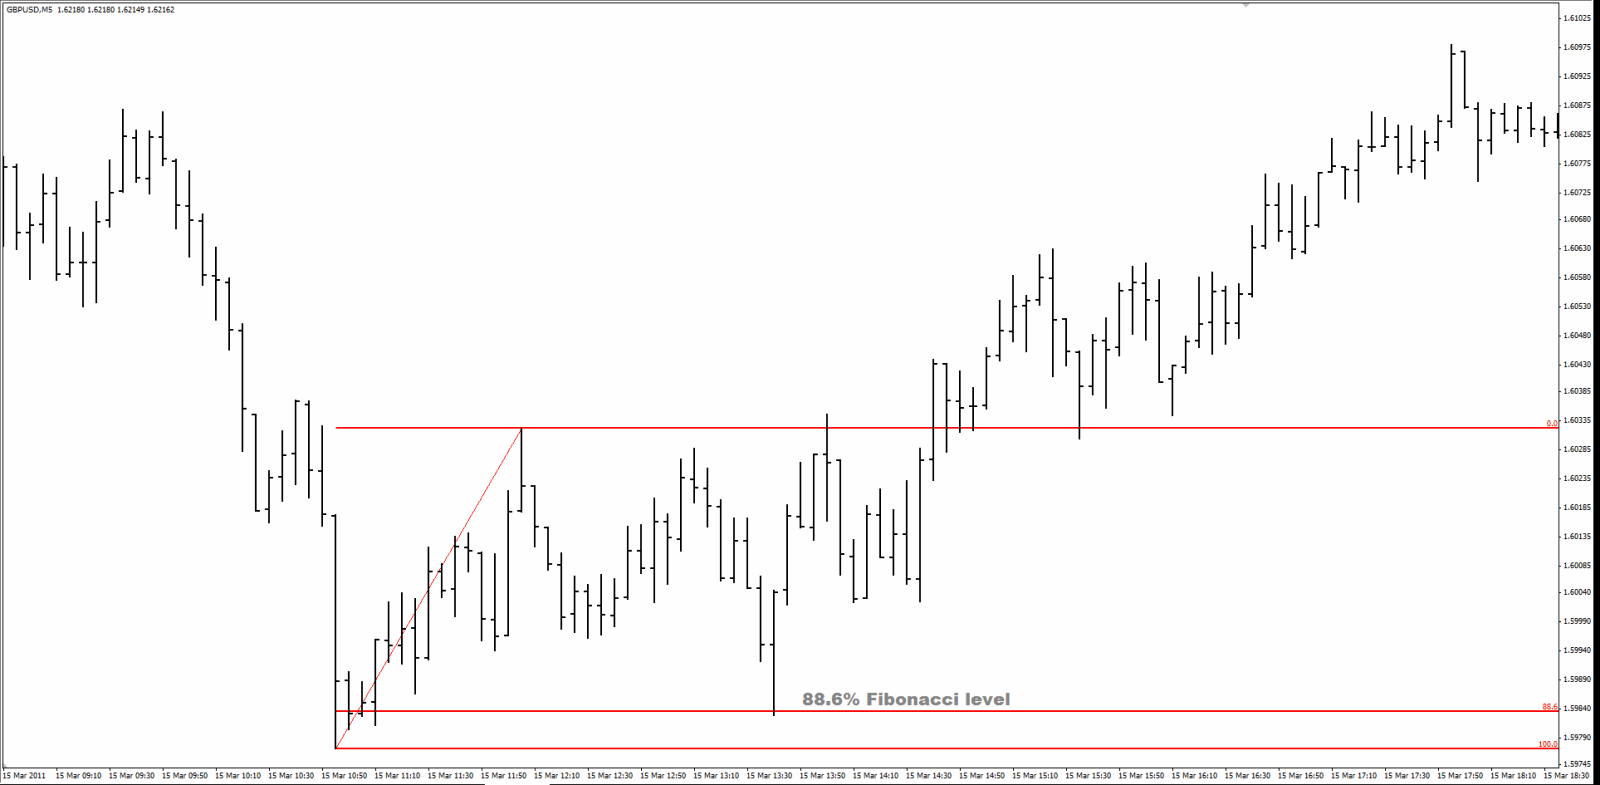
Now when I say, “This is an 88.6% Fibonacci retracement”, all that means is that the retracement is 88.6% of the size of the initial move. So, if the initial move was 100 pips up, the retracement would be 88.6 pips down. It doesn’t matter if the initial move was up or down.
Here are some examples of the 88.6% Fibonacci retracement.
Firstly, a 5-Minute GBP-USD chart where the initial move was up followed by a downward retracement:
Now a weekly USD-CHF chart, where the initial move was down followed by an upward retracement:
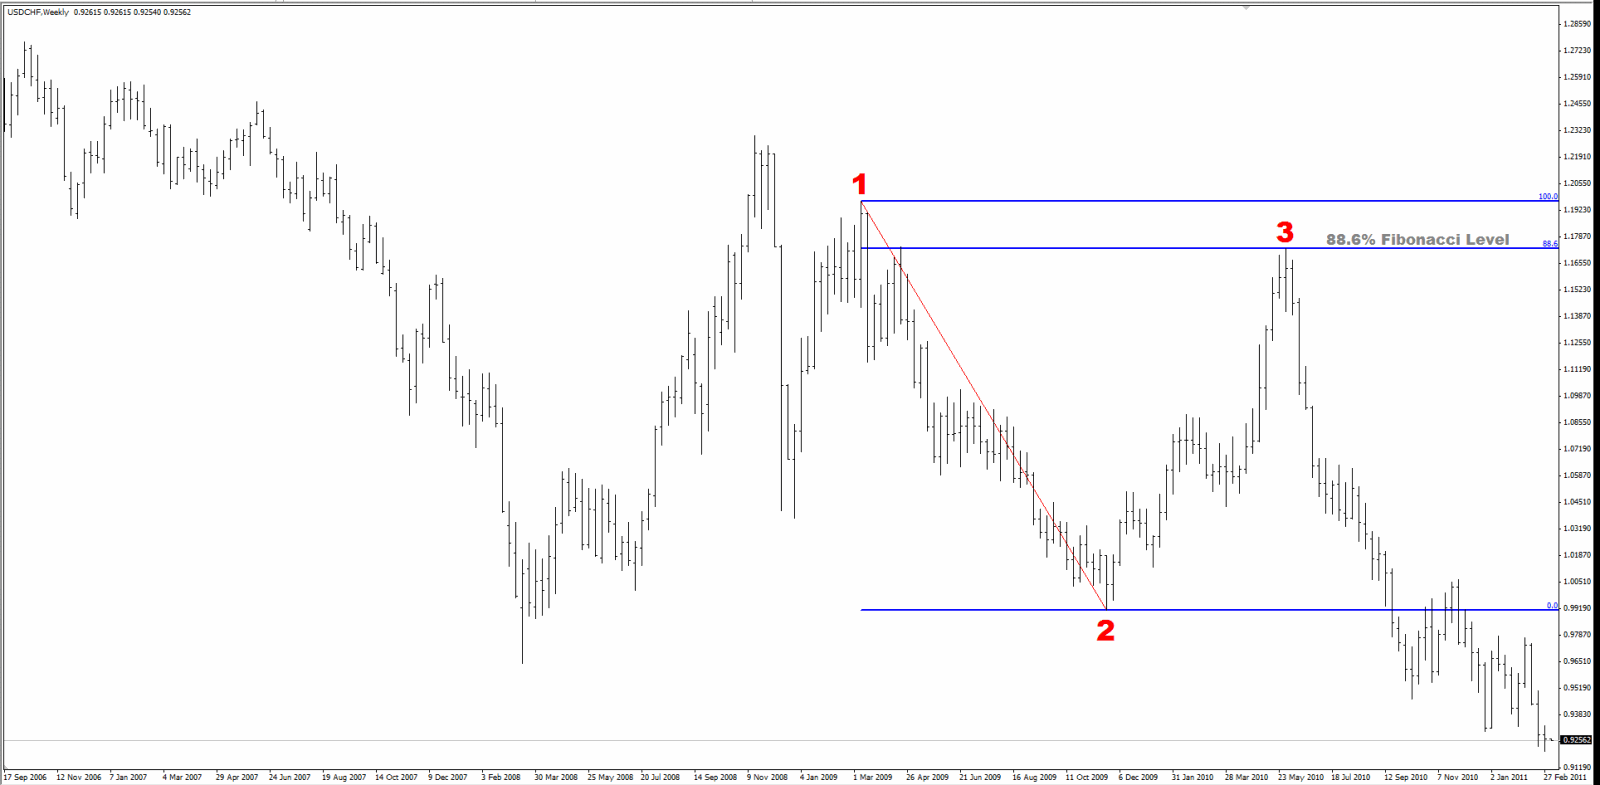
This is a fantastic example of the accuracy of Fibonacci levels. After the initial move down, the price retraced back up 1,821 pips over 27 weeks and hit the Fibonacci level within 2 pips! These kinds of setups can allow traders to have single trades that yield over 1,000 pips while still controlling their risk.
And just to showcase the versatility across markets, this is the Daily chart for the NASDAQ stock, Apple (Symbol: AAPL):
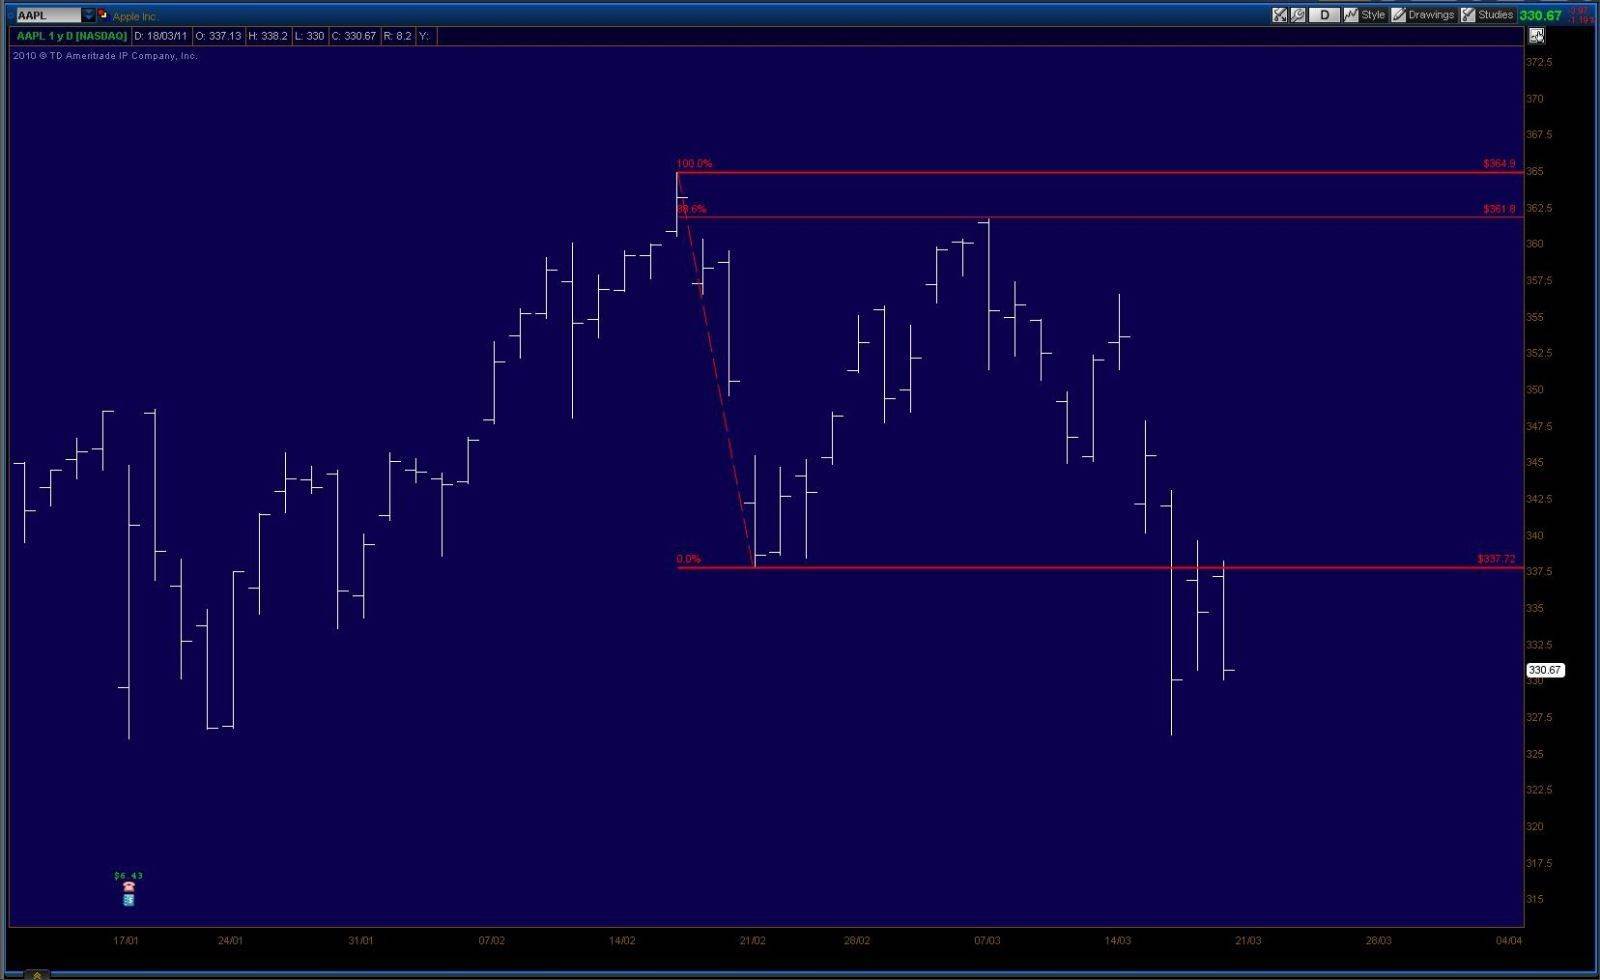
Here the stock price moved down over $27 in four days, then retraced to within a few cents of the 88.6 level, before moving down again.
When I trade a Fibonacci retracement, I like the price to hit the level and move away within one or two bars of the timeframe I am using, i.e. not hang around the level for several bars. In the three examples above, the price bar hit the 88.6 level once, and once only. Secondly, I like the level to be respected cleanly: the price shouldn’t penetrate the level significantly; rather it should hit the level accurately.
I always trade with a stop, and my profit target is where the retracement started, i.e. the end of the initial move up or down. Often the price will surpass that target, but I am happy to take my profit at this point. I will only trade this setup with a good risk/reward ratio, usually 1:2 or greater. If I can’t find a place to keep my stop at a reasonable distance compared to my target, I will pass on the trade.
So what can we learn about Fibonacci?
1. Fibonacci principles are timeless. You won’t find yourself needing to tweak or abandon Fibonacci ideas when markets change.
2. Fibonacci principles can be used from the smallest time frames to the largest.
3. Fibonacci has no biases for certain markets: you can use them on anything that has a chart, from a stock, a currency pair, a metal or even a complex derivative.
The Fibonacci Numbers
So, this is where it all begins: the “Fib Numbers”. Leonardo Fibonacci was a 13th century Italian mathematician who made popular a simple sequence of numbers that came to be known as the “Fibonacci Number Sequence”.
The sequence is this: starting with 0 and 1, each number is the sum of the previous two numbers. So, after 0 and 1, the next number is 1, followed by 2, followed by 3, then 5... you get the idea. The number sequence goes on forever, expanding to infinity:
0
1
1
2
3
5
8
13
21
34
55
89
144
233
377
610
987...
These numbers have some unique properties. Let’s take two consecutive numbers in the sequence: 21 and 34. If you divide one by the other, 21/34, you get 0.618. If you take any other two consecutive numbers, for example, 144 and 233, and divide one by the other, 144/233, again you get 0.618. It doesn’t matter how far down the sequence you go, you will always arrive at 0.618 when you divide one number in the sequence by the next one along.
This particular ratio, 0.618 (or 61.8%) is known as The Golden Ratio.
Aside from 61.8%, there are other ratios present in the Fibonacci sequence. The next ratio is found by taking a Fibonacci number and dividing it by the number two places along in the sequence. For example, if we pick 21, we would divide it by 55, which is two places along. This gives 0.382 (or 38.2%). You would get 0.382 no matter which number you started with as long as you divide it by the number two places along. So, 89 divided by 233 is again 0.382.
Continuing with this idea, if you divide a Fibonacci number by a number three places along in the sequence, for example, 55 divided by 233, you would get a new ratio: 0.236, or 23.6%.
So far, we have discovered three common ratios in the Fib number sequence:
0.236 or 23.6%
0.382 or 38.2%
0.618 or 61.8%, also known as “The Golden Ratio”
This is all great: it’s an interesting idea, but where does it lead us in our journey as traders?
The reason this series of numbers, and its associated ratios, are still being discussed centuries after first being widely known, is because they are found everywhere in nature, and today they are found in the markets.
For example, the human body is built around these ratios:
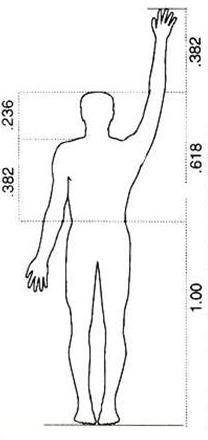
From the foot to the naval, to the head, the common ratios of 0.236, 0.382 and 0.618 are found in the proportions of the human body.
The proportions of DNA strands are also in line with the Fibonacci ratios. So are the proportions of the Moon to the Earth and even Saturn’s rings. The Greeks, over two thousand years ago, used the Golden Ratio when designing the proportions of the Parthenon, as did the Egyptians when calculating the size and height to build the Pyramids. Flowers more often than not have precise “Fib” numbers of petals, such as varieties of daisies with 55 petals and 89 petals.
Given that Fibonacci ratios are present from the smallest in DNA to the largest in planetary systems, it’s no surprise that these same ratios are seen in the way price moves in the market.
Let’s take a look at an example of price moving in harmony with The Golden Ratio. This is a daily chart of EUR/USD.
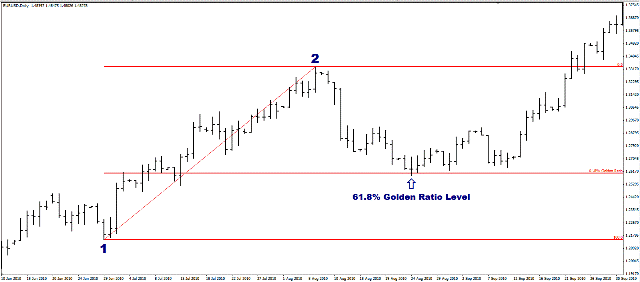
The price moves from the major low, at Point 1, to the major high at Point 2, then retraces 61.8% of that distance, before moving off again to continue the original upward trend.
What Ratios are we Going to Use When Trading?
Aside from the three ratios discussed, there are other ratios that are used by traders (and also found in nature for that matter). Three more common ratios are as follows:
0.786: the square-root of The Golden Ratio
0.886: the square-root of 0.786
1.618: the inverse of The Golden Ratio, i.e. 1 divided by 0.618
To summarize:
1. Fibonacci begins with a simple sequence of numbers, each number being the sum of the previous two
2. Dividing consecutive numbers in the sequence, and numbers separated by one or two places, gives the common Fibonacci ratios: 0.236, 0.382 and 0.618. The last ratio, 61.8%, is also known as The Golden Ratio
3. These ratios are found in nature and are also found in the way price moves in a market
Fibonacci and Forex: Ratios and Retracements
The Fibonacci sequence of numbers can be used to discover ratios that are found in nature and in the markets. The key ratios are:
23.6%
38.2%
61.8% (The Golden Ratio)
78.6% (The square root of The Golden Ratio)
88.6% (The square root of 0.786)
161.8% (1 divided by 0.618)
Before moving on, we are going to add some further Fibonacci ratios that are found in the markets:
100%
112.7% (the forth root of 161.8%)
127.2% (the square root of 161.8%)
138.2% (the addition of 100% and 38.2%)
200%
261.8% (the addition of 100% and 161.8%)
Now, with a more complete list of Fib ratios let’s look at how they are applied to the markets.
Fibonacci on Charts - Retracements
We will begin with one of the most primary concepts in trading: the “retracement”. This is where the price moves in a direction, then goes back over that move before continuing in the original direction. This example of a 4-hour Euro-Dollar (EURUSD) chart shows a retracement:

So there are three parts: the “initial move”, the “retracement”, and finally the “subsequent move”.
Of course, retracements can also be retracing in the other direction. For example, in this 4-hour Euro-Yen (EURJPY) chart, the initial move is down, and the retracement is up:
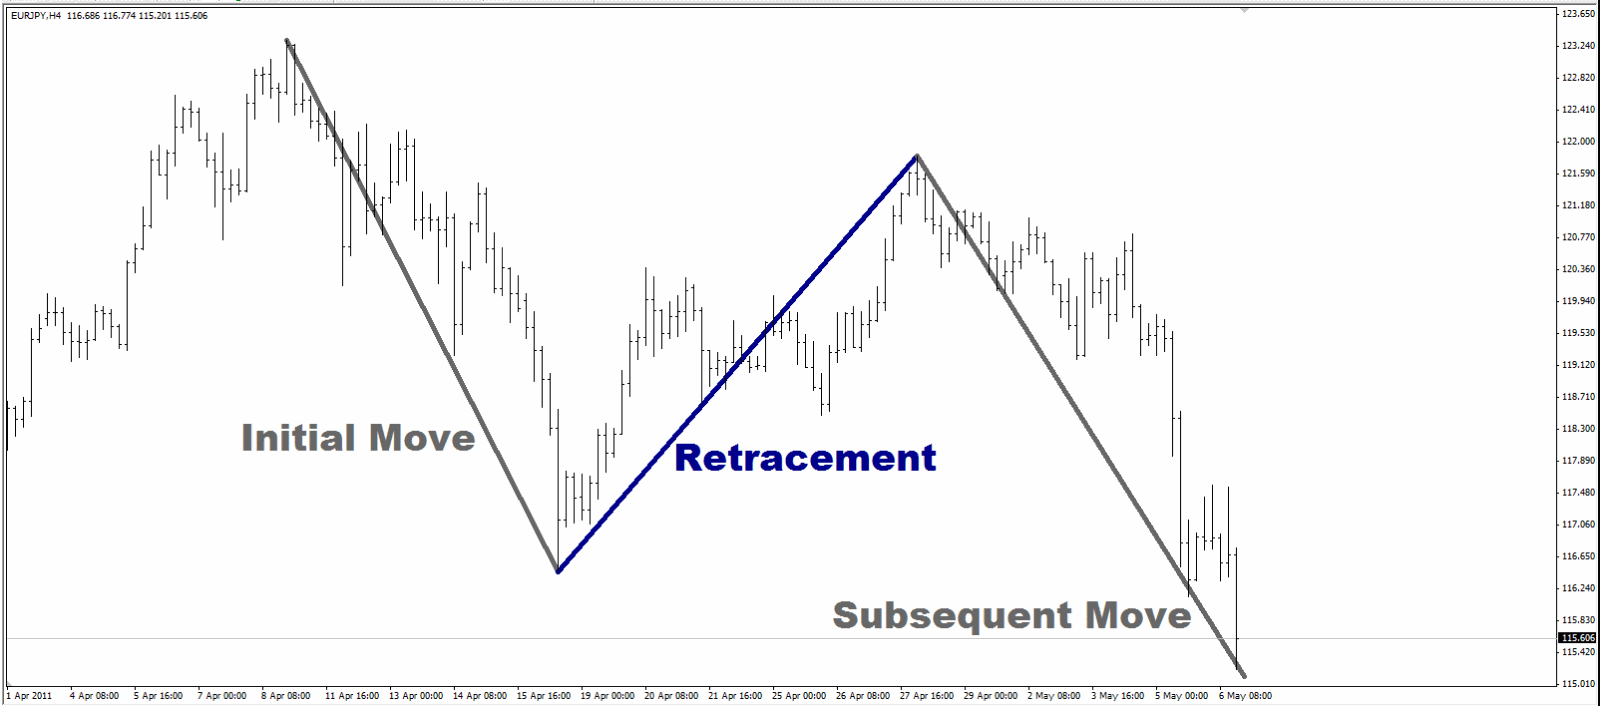
Let’s start to tie in the Fibonacci ratios with the markets beginning with retracements. By definition, a retracement traces a portion of the initial move. The amount that the initial move is retraced can be measured in relation to the Fibonacci levels.
Now when I say, “This is a 78.6% Fibonacci retracement”, all that means is that the retracement is 78.6% of the size of the initial move. So, if the initial move was 100 pips up, the retracement would be 78.6 pips down. Let’s go back to the same charts we looked at before, starting with the EURUSD chart:
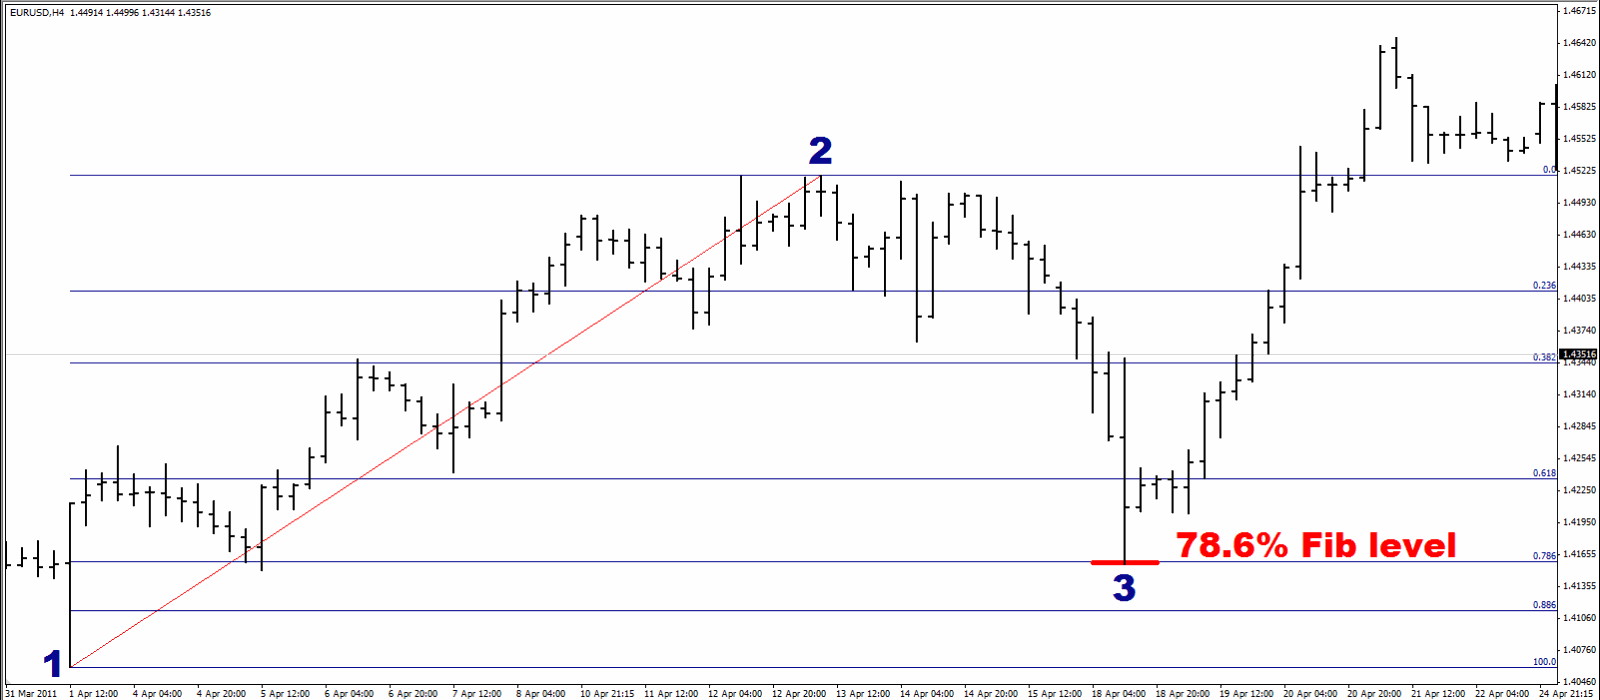
The price moved up from Point 1 to Point 2, then moved back precisely 78.6% of that distance to Point 3, before moving back in the original direction.
Let’s take a look at the same EURJPY chart that earlier showed an upward retracement, this time with the Fib levels in place:
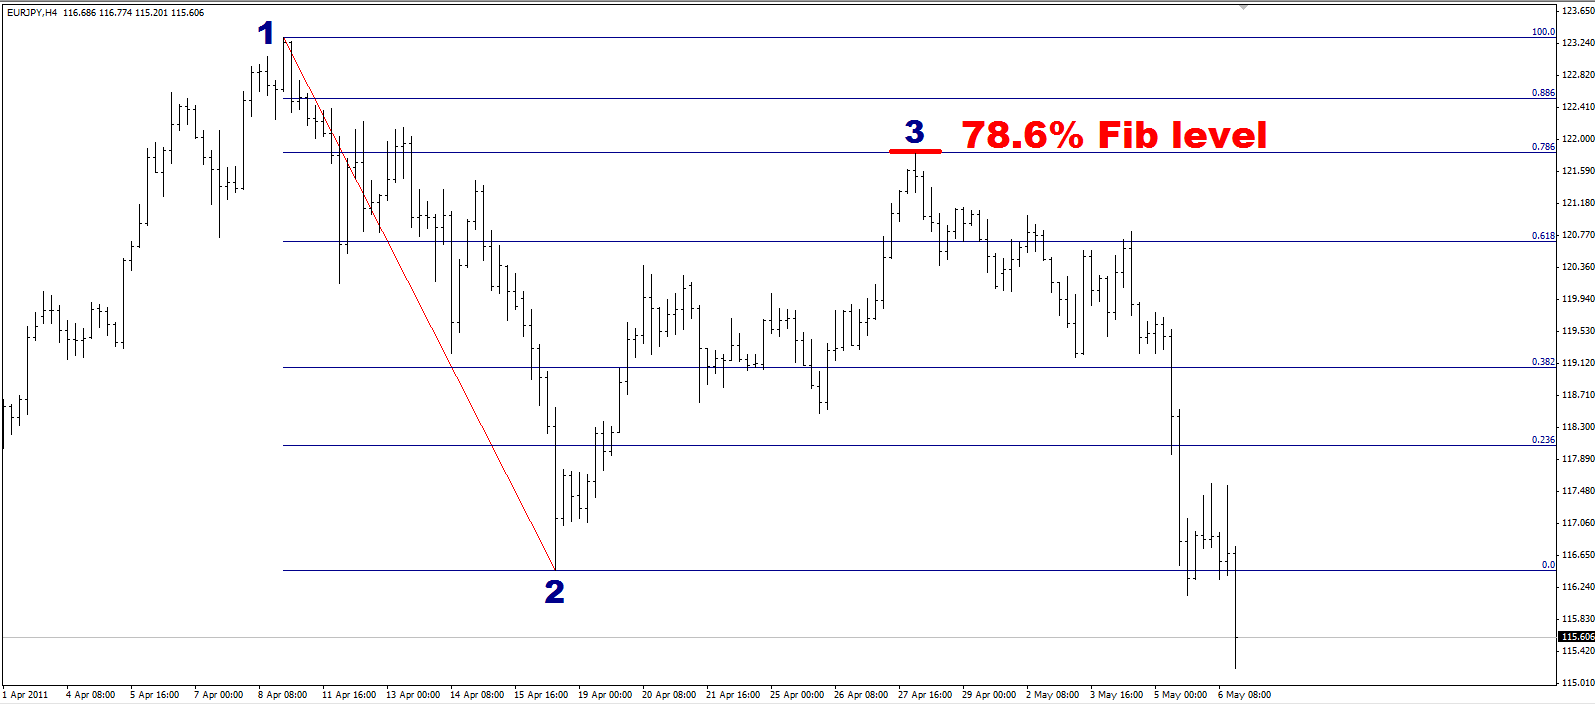
Now you should have the idea: the price moved down from Point 1 to Point 2, moved back up 78.6% of that distance to Point 3, before moving back in the original direction.
Multiple Fibonacci Lines
Can you start at different points to measure your retracement? Yes. A retracement can be measured with different Fibonacci levels using different starting points for the Initial Move.
In the following chart of the Aussie Dollar (AUD/USD), the price moves down to Point 1, retraces back up to Point 2, then continues moving down in the original direction. Several highs were made before the price reached Point 1. I’ve marked the two most recent and prominent highs as Point X and Point Y.
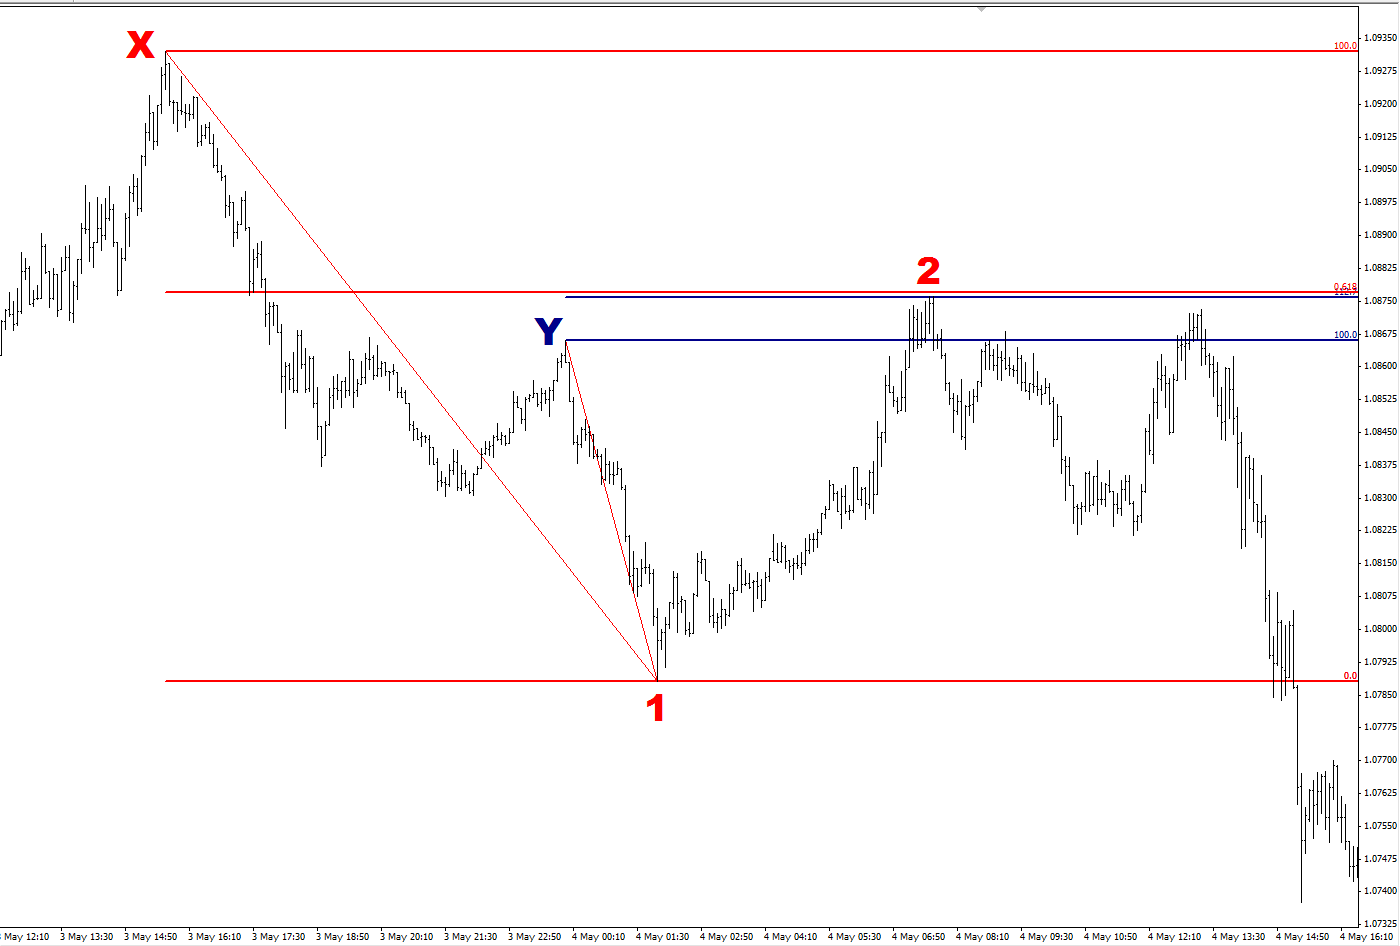
When the price moved from Point X to Point 1, it retraced 61.8% of that distance to Point 2 before continuing the downward move. This is marked by the red horizontal line.
Now, if you chose to use Point Y as the start point to measure the retracement, Point 2 was a 112.7% retracement of the distance from Point Y to Point 1 (as marked by the blue horizontal line). Therefore, a retracement can in fact go past the start of the initial move depending on where you choose to start your measurement. This is why the Fib levels above 100% are important.
The Aussie-Dollar example also illustrates another point we will be examining later in this series of articles: different Fib levels produce confirmation points to allow us to plan trades.
Looking over charts, you can find examples of small retracements that reach just the 23.6% level, to larger retracements that go back all the way to 88.6% of the initial move. You can examine retracements from the smallest charts, e.g. 5-minute bars, to long-term charts using weekly bars. The principles apply in the same way. As this series of articles unfolds, we will look further at how these principles can be applied to trading scenarios to find entry points, targets and protect risk.
In summary:
1. Fibonacci levels used in trading start from 23.6% and extend well beyond 100%
2. A retracement can be measured in relation to the Fibonacci ratios
3. Multiple Fibonacci levels on a chart can confirm key price areas
Note: Many of you use MetaTrader for your charting. On MT4, the following button is the Fibonacci retracement tool:

Once pressed, click and drag it on your chart from your selected start point to your finish point. Where you click first is where the 100% level will appear and where you finish dragging is where the 0% level will be set. Double-click the Fib lines that appear and you can move the ends from the small squares at the ends of the handle to fine tune your selected points. Right-click and go to “Fib Properties” on the pop-up menu to add levels, change colors etc. Remember to get the 0% and the 100% the right way around: think about what you’re measuring; if you’re measuring a retracement, you want to make sure the 0% is at the start of the retracement.
Fibonacci and Forex: Extensions
The extension is often considered the third move, or “Wave 3” when looking at a chart; there is an initial move, a retracement, followed by an extension, as in this 5-Minute EUR/USD chart:
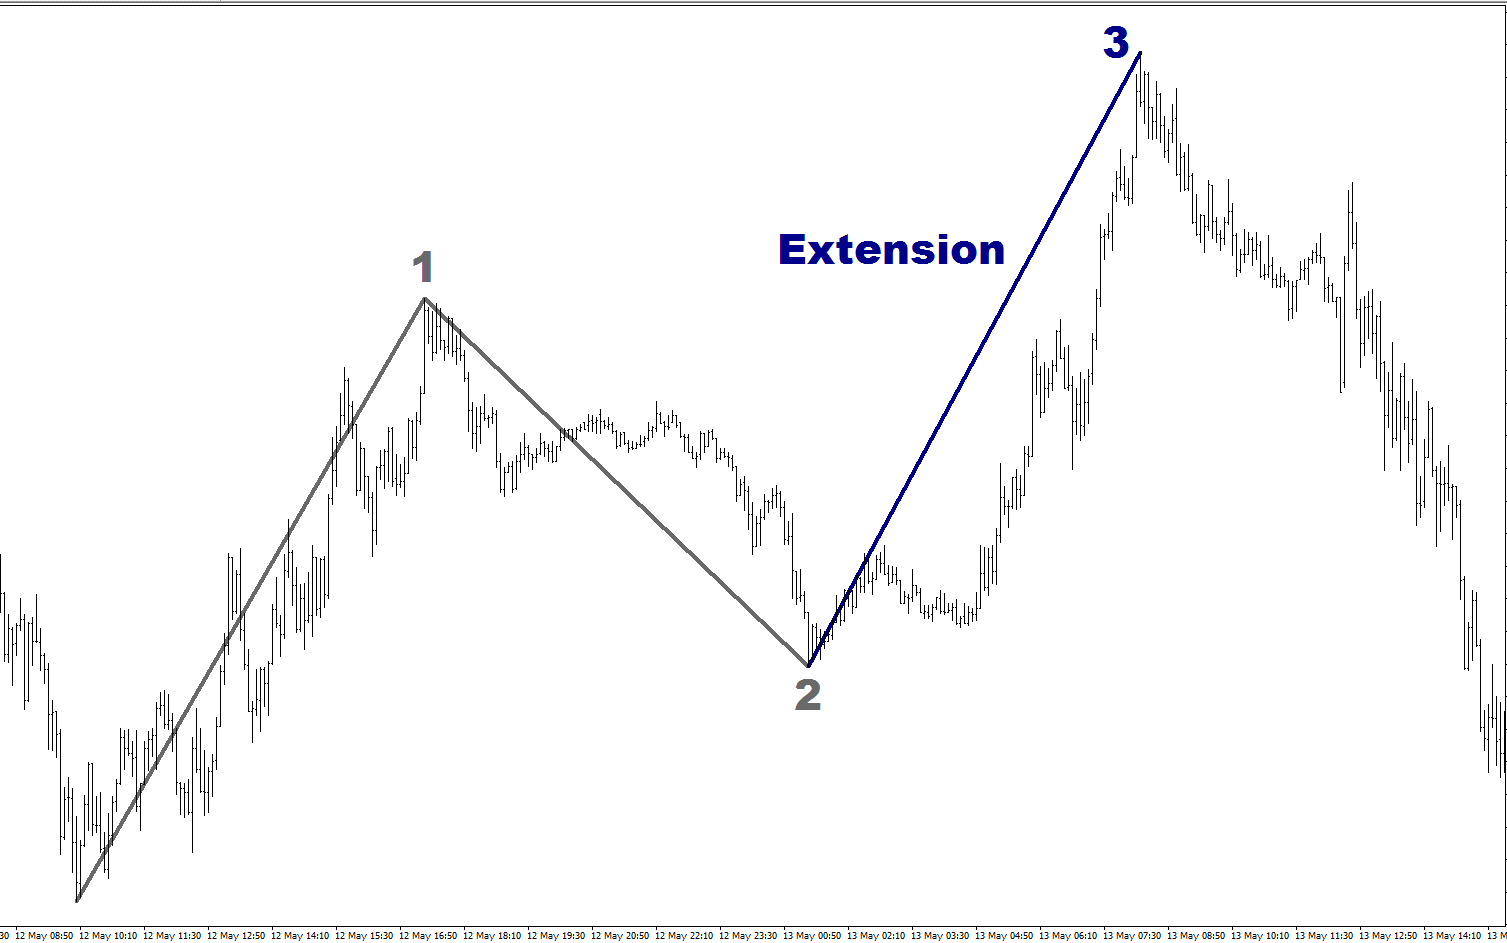
When measuring an extension in relation to Fib levels, we measure it in proportion to the first move. In other words, we look at the size of the extension and see what that size is as a percentage of the first move (up to Point 1 on the chart above). This is not as straightforward as measuring the retracement, but with a little bit of practice it should be easily understood. Let’s look at the same 5-Minute EUR/USD chart:

For the sake of clarity, I have removed all other Fibonacci levels and just left one level displayed to prevent the chart from being too cluttered.
In this example, the 100% level is hit. What that means is that the size of the first move is equal to the size of the extension. In practice, the size of the move up to Point 1 was 154 pips, and the distance the price moved from Point 2 to the end of the extension was 156 pips, i.e. a fraction over 100%.
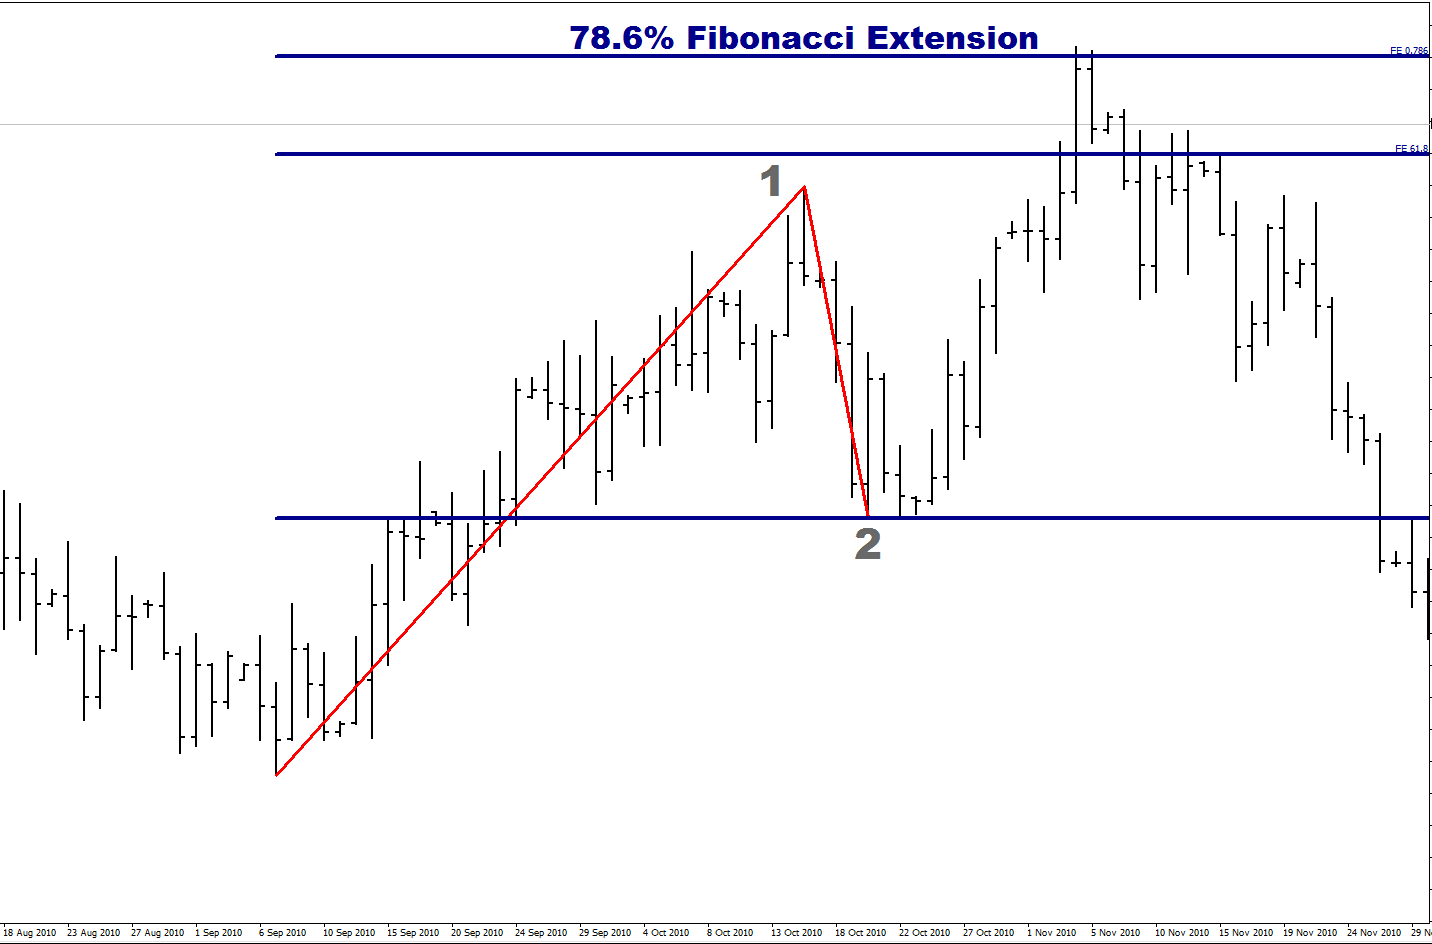
Let’s take a look at two other examples of extensions hitting different Fibonacci levels. In the following example of a Daily GBP/USD chart, the price moves up to Point 1, retraces to Point 2, then hits the 78.6% Fib Extension level before moving back down again.
Of course, extensions can be down as well as up, as in this 4-Hour AUD/USD chart:
Here, the price moves down to Point 1, retraces to Point 2, and then hits the 78.6% extension level before moving back up.
As with retracements, multiple extensions can be combined on a chart and this will be explored later in the series.
In summary:
1. The move after the retracement is known as an “extension”
2. An extension can be measured as a Fibonacci proportion of the first move, or Wave 1
3. Multiple extension levels can be combined on a single chart
Note: MetaTrader refers to extensions as “expansions”. To measure extensions in MT4, go to “Insert > Fibonacci > Expansions”. Click and drag the mouse on the screen to your desired points. Double-click anywhere on the handle line move the start & end points using the small square handles that appear. Right-click and go to “Expansion Properties” to change the Fib levels, change colors etc.
Fibonacci and Forex: Trading Using the 88.6% Retracement
When Fibonacci is applied to trading, there are three common routes:
1. Using multiple retracements and extensions to find price levels where different Fibonacci levels coincide to produce “clusters”
2. Using additional indicators, for example MACD, with Fib levels
3. Using Fibonacci levels as part of larger chart patterns, for example a “Head and Shoulders” reversal pattern
Now we’re going to discuss a particular Fibonacci level that I focus on much more and often trade in isolation: the 88.6% retracement.
To recap, the 88.6% level is derived by taking The Golden Ratio, 0.618, square rooting it and square rooting it again to get 0.886. Now when I say, “This is an 88.6% Fibonacci retracement”, all that means is that the retracement is 88.6% of the size of the initial move. So if the initial move was 100 pips up, the retracement would be 88.6 pips down.
Fibonacci levels do not have a bias for particular timeframes: they have the same validity if you’re looking at a long-term weekly chart or a short-term 5-minute chart.
Let’s state off with a weekly chart of the USD versus Swiss Franc, USD/CHF.
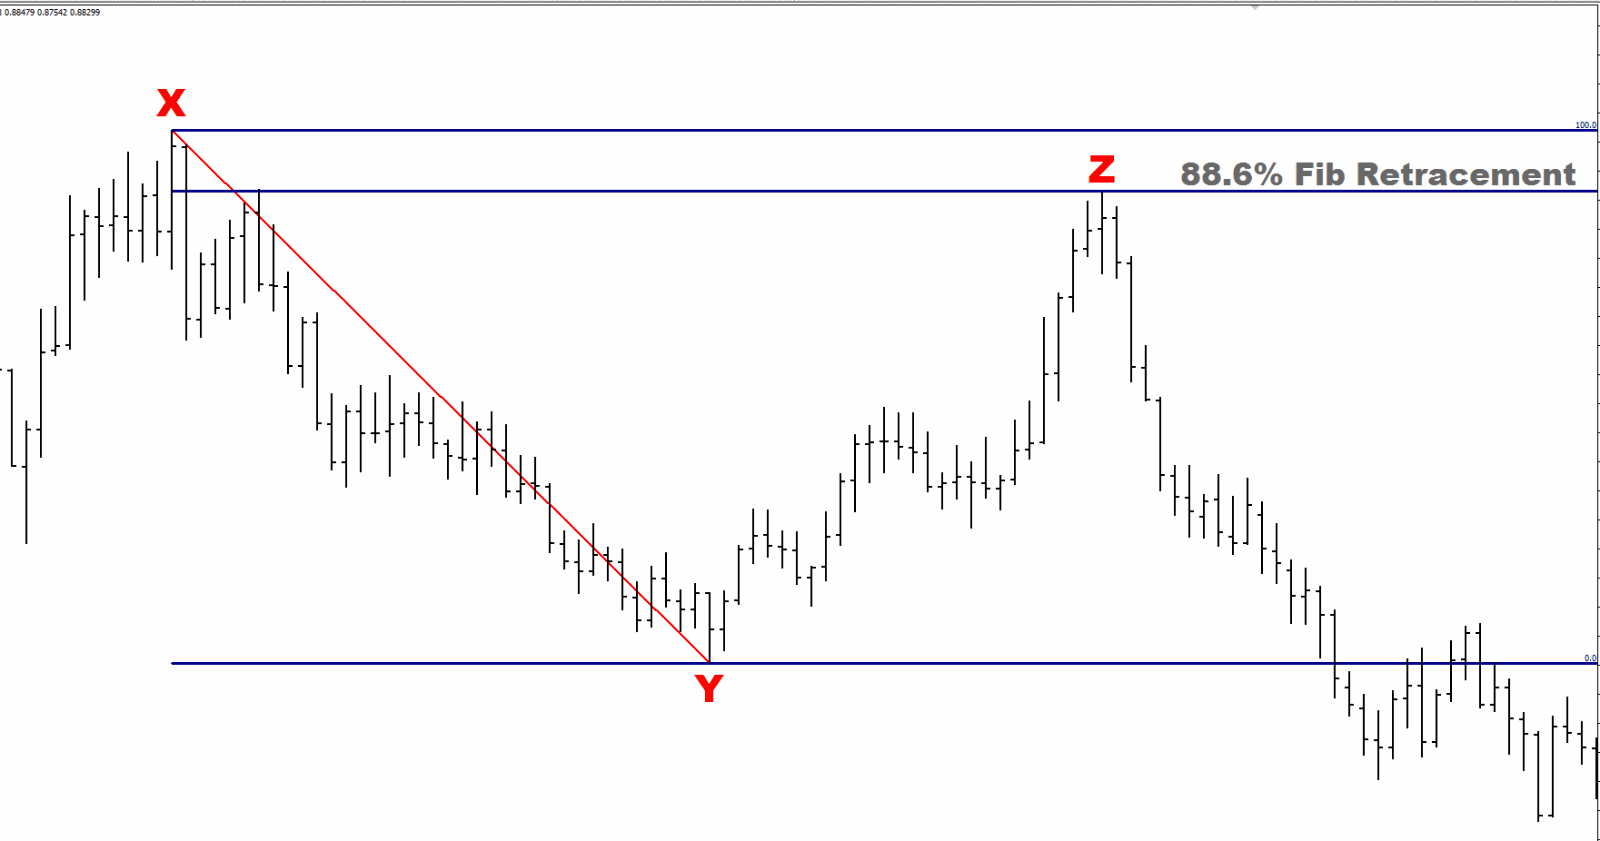
The price firstly made a high at Point-X at 1.1967 on 8 March 2009. It then moved down to the low at Point-Y at 0.9909 on 22 Nov 2009. So, the price moved 2,058 pips over 37 weeks. Then the price retraced to Point-Z at 1.1730 (or 1,821 pips) on 30 May 2010, i.e. 28 weeks after Point-Y. Looking closely at the chart and the figures, the retracement was within 2 pips of the 88.6% level. This is incredible given that the price travelled thousands of pips over many weeks and months, yet still made such a precise hit against a key Fibonacci level.
Identifying this level and seeing a clean hit could yield a trader in excess of a 1,000 pips if he chose to ride the price down after the retracement ended at Point-Z. (If you were to zoom out of the chart, you would also see that this setup was part of a very long-term downtrend for the USD/CHF which has in fact continued to this day.) Alternatively, knowing that a Key Fib level had been successfully and cleanly tested, a trader could take multiple trades on shorter-term charts such as 4-Hour or 1-Hour, looking for entries to sell USD/CHF. Entering on shorter-term timeframes but using a long-term level allows for tighter stop losses and better risk/reward ratios on your trades.
A potential target for your trades could either be the start of the retracement, Point-Y, or a 100% extension of the initial move, which would be slightly beyond Point-Y.
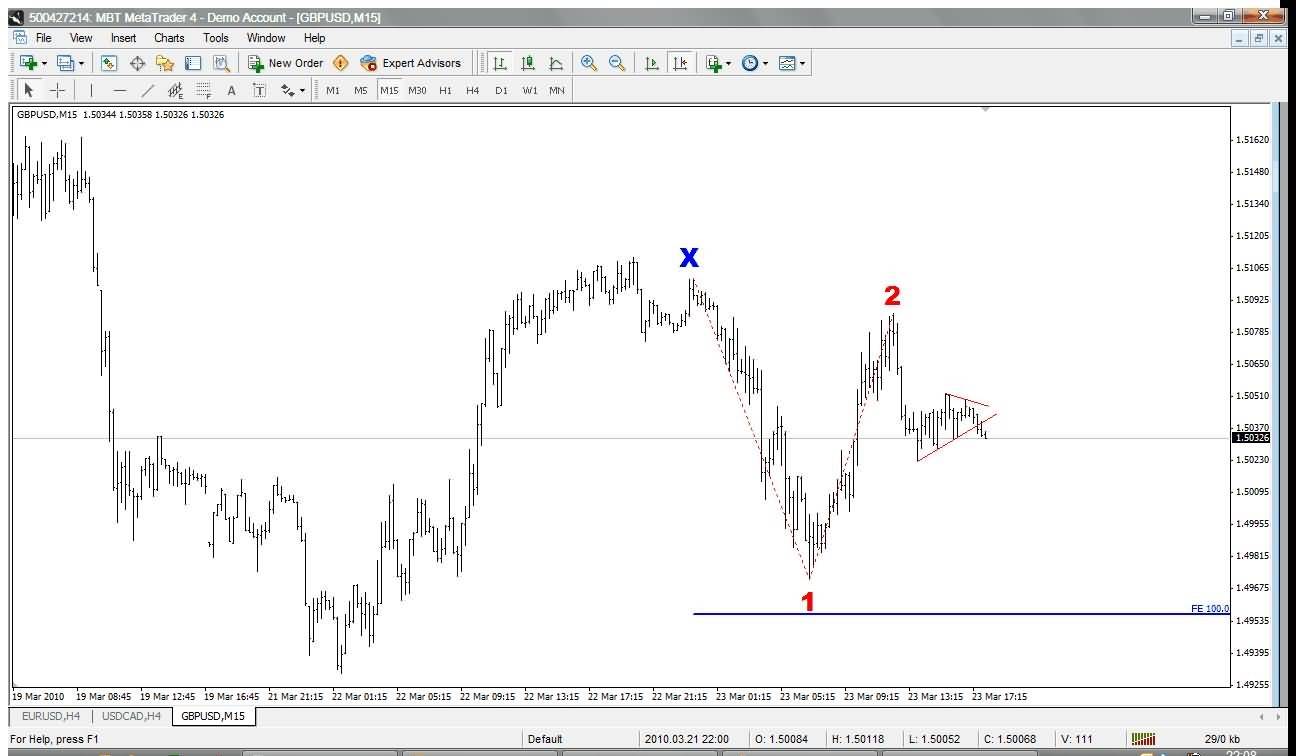
Now let’s take a look at an actual trade I took on the GBP/USD on this 15-Minute chart:
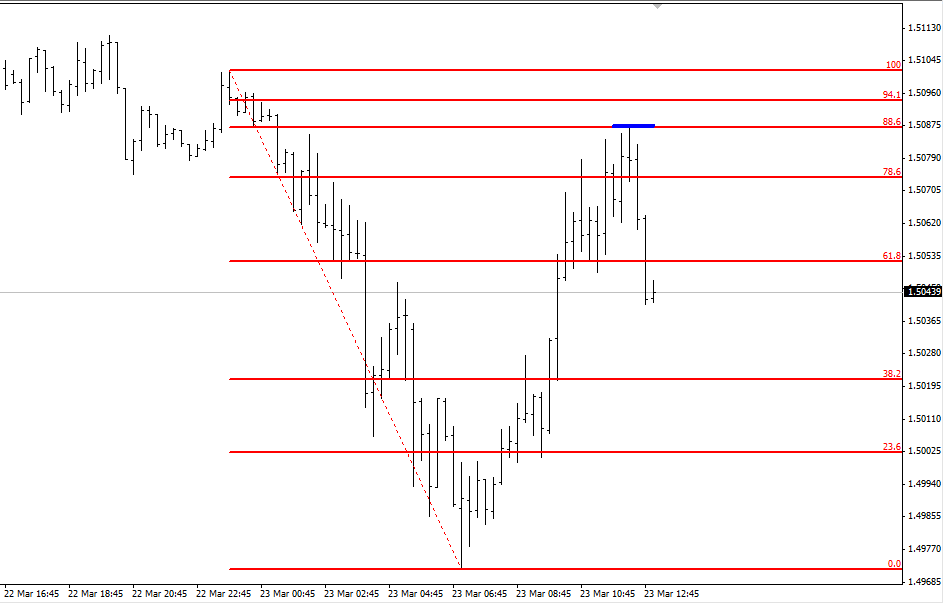
I saw that the price had tested the 88.6% level as marked by small blue line on the chart (this is what my chart looked like as I was trading). However, I didn’t enter right away. The price had already moved quickly and I was concerned about where I would place my stop-loss.
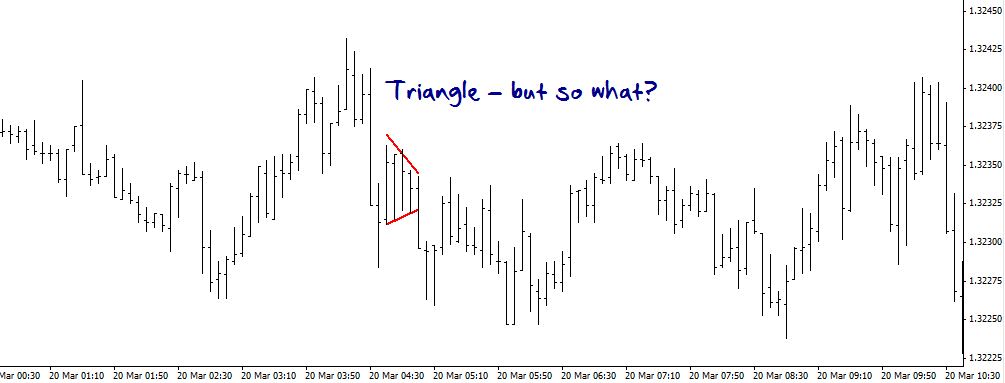
I continued to monitor the chart and the price moved into a nice consolidation, or sideways “triangle” pattern, marked by the red lines:
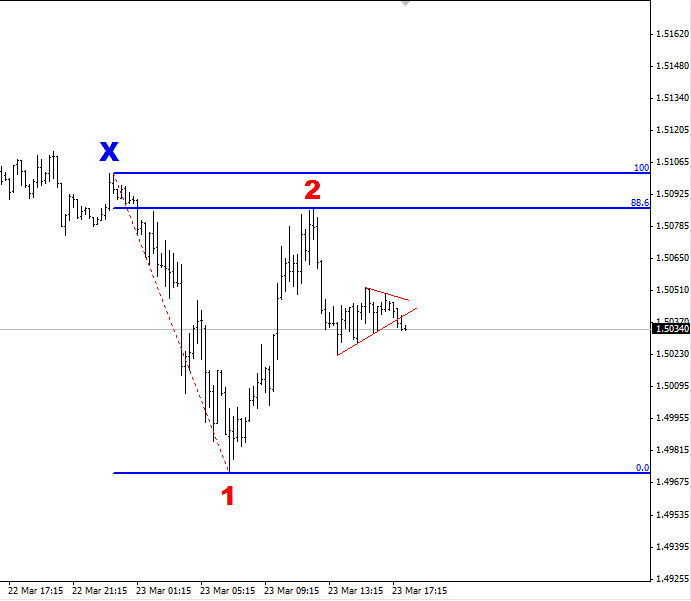
This allowed me to enter the trade and place a stop just above the triangle, rather than a larger stop above the 88.6% level. This gave me a better risk/reward ratio for my trade of over 1:3. In other words, the profit target was greater than 3 times the size of the stop-loss.
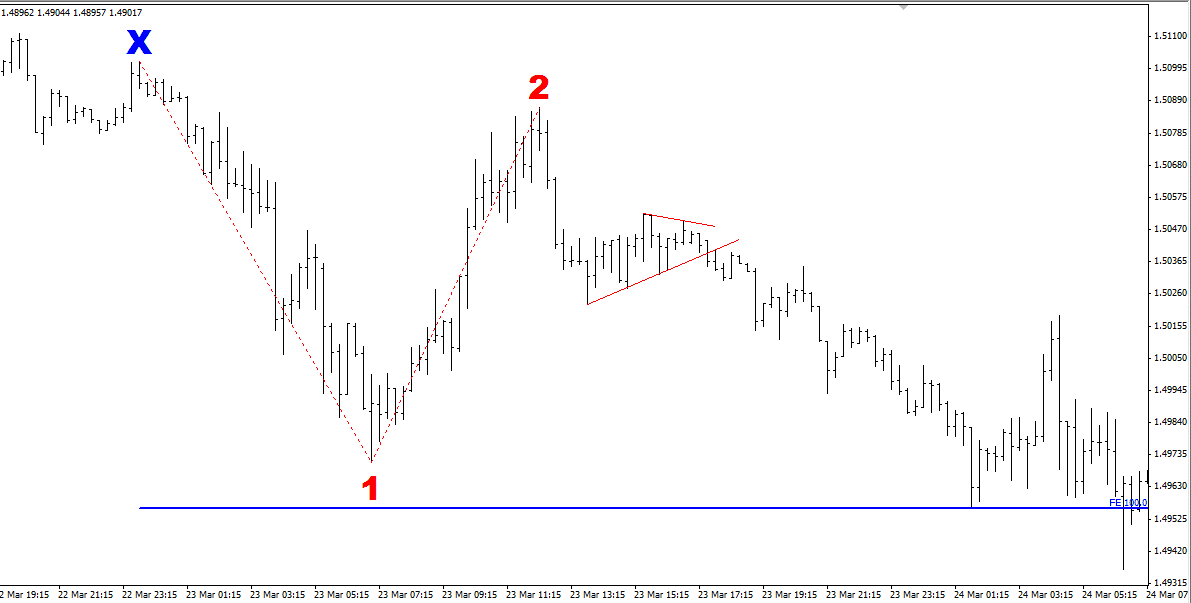
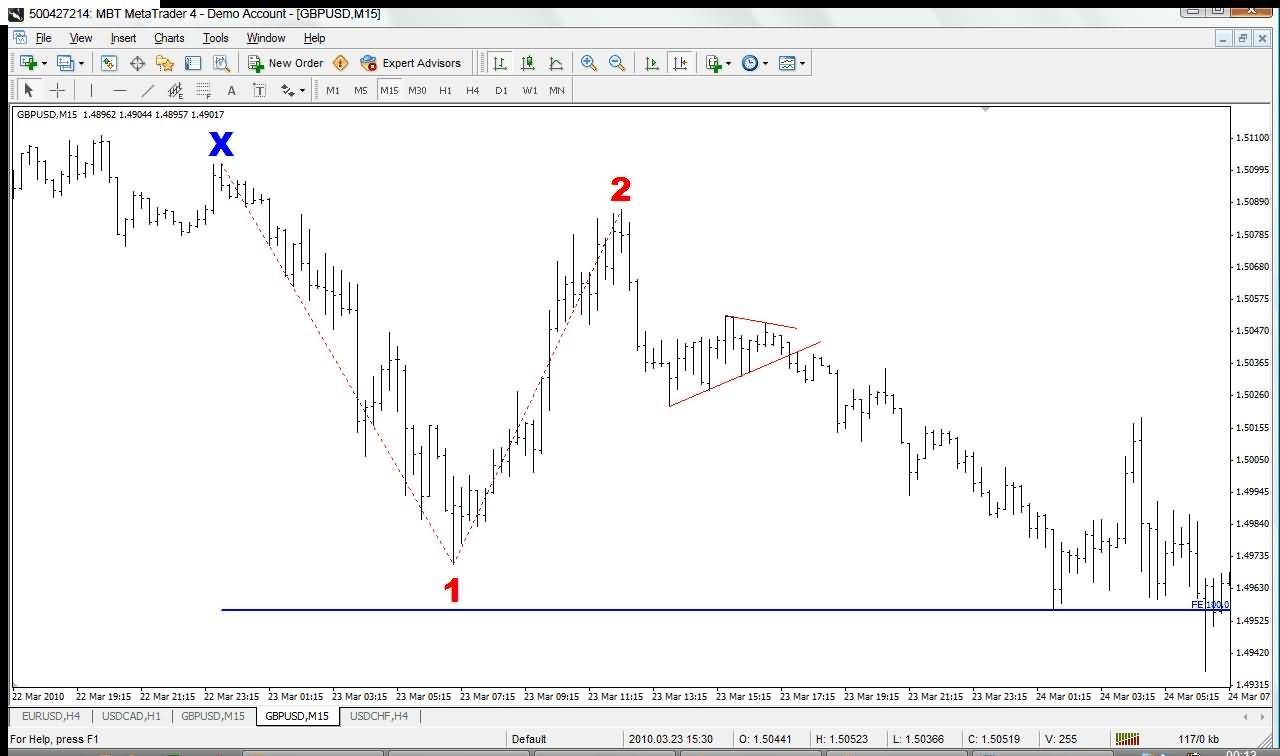
In this particular trade, I used a 100% extension of the initial move as my profit-target. To recap, that means I took the size of the move from Point-X to Point-1 and measured that down from Point-2. This is shown as the lower blue line in the following chart:
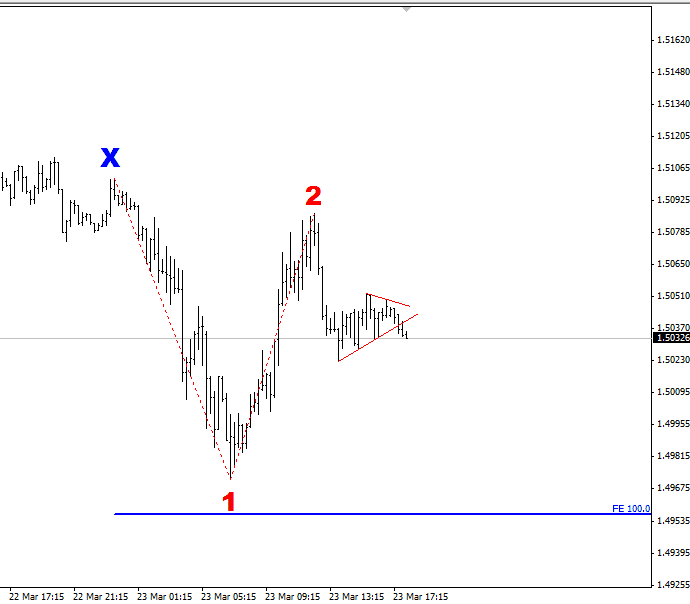
The following chart shows how the trade unfolded:
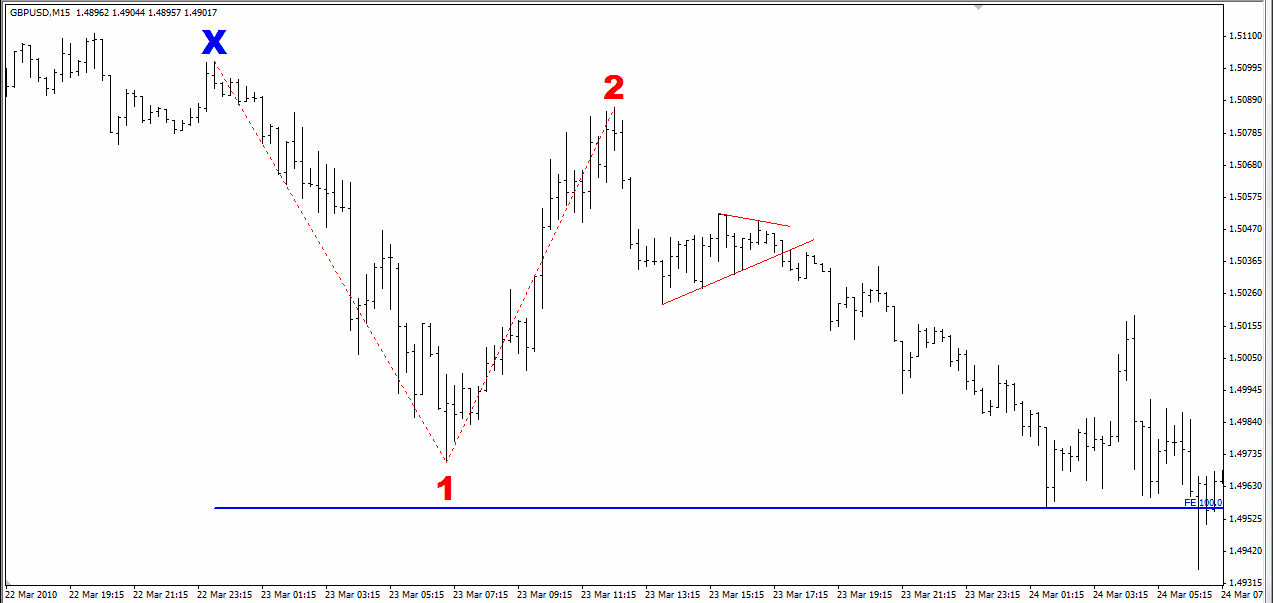
The price moved down nicely and hit the profit-target a few hours later. The stop-loss was a little over 20 pips and the profit target was 80 pips.
In summary:
1. Fibonacci levels are applicable on both long-term and short-term charts.
2. Fibonacci can be traded with other indicators and other chart-patterns.
3. The 88.6% Fib retracement level is particularly strong to trade in isolation.
Fibs with Chart Patterns
In the previous GBP/USD example, the 88.6% Fib retracement level was the reason for the trade and a smaller chart pattern (a triangle pattern) helped to pin the entry. In this week’s examples, the chart pattern itself is the reason for the trade and the Fib level helps to find the entry point.
The following chart shows the US Dollar versus Japanese Yen, USD/JPY, forming a bullish “Head & Shoulders” pattern. Here is a simplified diagram of this chart pattern:
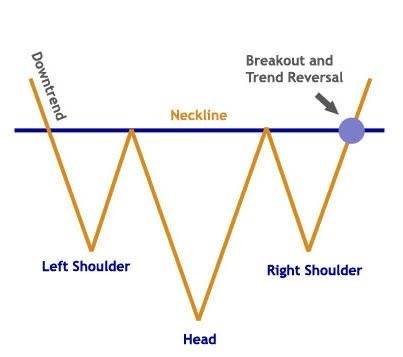
So, the pattern consists of three lows: the middle one larger than the two either side of it. The middle peak is therefore referred to as the head, and the left peak is the Left Shoulder and the right peak is the Right Shoulder. Connecting them is a “Neckline”.
Chart patterns do not come so neatly formed but over time you can train your eyes to spot them. This is what I saw as a Head & Shoulders pattern forming on the following USD/JPY 15-minute chart:
The two blue circles highlight the Left Shoulder and Head, and the red line is the neckline. At the time I was looking at the chart, the pattern wasn’t complete and there was a potential Right Shoulder forming. It’s important to emphasize that the Right Shoulder was still potentially forming: the price could continue moving down and not complete the pattern.
I don’t see or trade this pattern often, but I liked it in this case because (a) I felt the neckline was very clear with multiple touches and (b) I had identified quite clearly the Left Shoulder and Head. Classical technical analysis teaches that a trader should enter when the Neckline is broken or when the Neckline is re-tested after it is broken (i.e. when it is broken but the price comes back down to touch it as support). However, I prefer to enter the pattern before the Neckline is broken. This is because if the price breaks the Neckline, it can still be a false breakout and come back to hit your stop-loss. If instead, you enter during the formation of the Right Shoulder, the price can break the neckline but just come back to your entry leaving you room to exit at breakeven rather than take a loss.
Zooming into a 5-minute chart, I noticed the price bounced against the 88.6% Fib level between the Low Point-1 and the High Point-2:
(The blue circle is the Head of the Head & Shoulders pattern.) I’ve marked my entry with the small red line. My reasoning was that the price would at the very least go back up to Point-2 and this would allow me to move my stop-loss to breakeven. Of course, the price could continue down after my entry and give me a loss near my initial stop-loss at Point-1. But the risk would be small compared to entering at the neckline and keeping a larger stop-loss.
Let’s see how the trade unfolded:
I’ve now marked the full chart pattern with the Neckline, and the three circles highlighting the Left Shoulder, Head and Right Shoulder. My entry is marked with the small red line. The price successfully broke the Neckline after touching it a couple more times and then hovering around it. My early entry identified with an 88.6% Fib retracement allowed me a much tighter stop-loss of 15 pips. I took profits at 60 pips (after the first long bar up): once the price spiked up very quickly, I was weary of a retracement plus I had covered four times my initial risk, or a 1:4 risk/reward ratio.
In summary:
1. When you’re looking at a chart pattern you would like to trade from, a Fib level can help identify an entry.
2. Using Fib levels can often allow you to enter earlier than if you used the chart pattern by itself.
3. Earlier entries, particularly on smaller timeframes give smaller stop-losses and better risk-reward trades.
To recap, the 88.6% level is derived from taking the Fibonacci Golden Ratio, 61.8% (or 0.618), square rooting it and then square rooting it again. This gives you 0.886 or 88.6%.g
88.6% Fib Bounce Before 150 Pip Move
When the price retraces to a Fibonacci level, all that means is that the size of the retracement as a percentage is equal to a Fibonacci percentage. For example, if the price makes a low, then moves 100 pips up to make a high, then moves back down 88.6 pips before moving back up in the original direction, then it has retraced 88.6%.
When I am using other Fib retracements levels, such as 61.8% or 38.2%, I often want to see a confluence of other factors such as a chart pattern, previous support/resistance etc. But with the 88.6% level, if I see price bounce cleanly off it and move away, I can often take a trade on that alone especially if it is in line with the larger trend. I have found it to be a very accurate predictor of price movement.
Yesterday morning (Tuesday 7 February), I saw a nice clean 88.6% retracement on the 1-minute EURUSD chart:
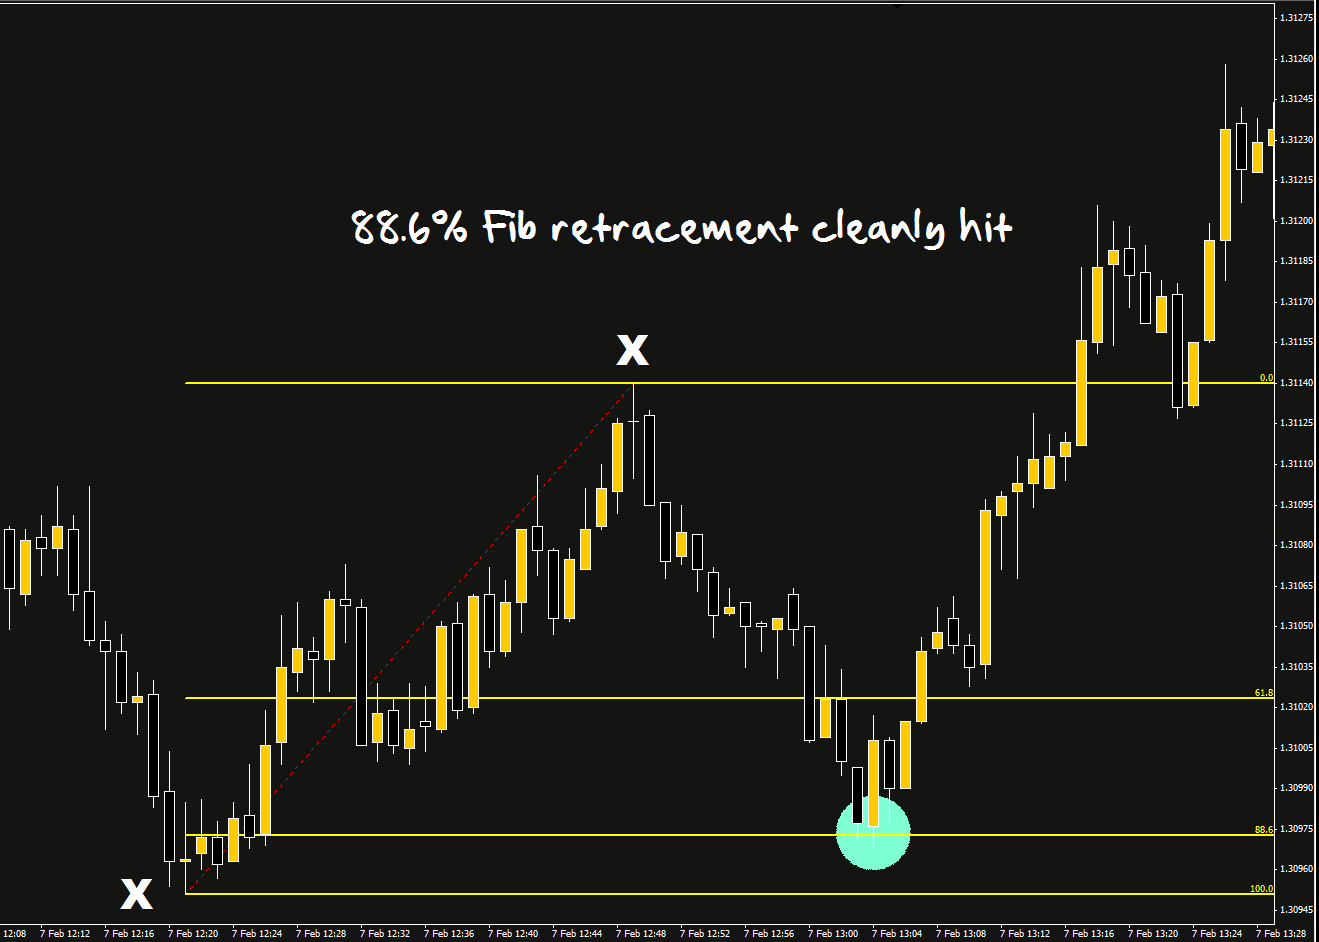
The price made a low and then went up to make a high between the two points marked with an “X”; it then retraced down 88.6% and bounced off it within a pip. (You could also have seen this on a 5-minute chart.)
Notice that after the bounce, not only did the price move back to the original high, but it continued moving up for the rest of the day and didn’t look back – over 150 pips from the original 88.6 level.
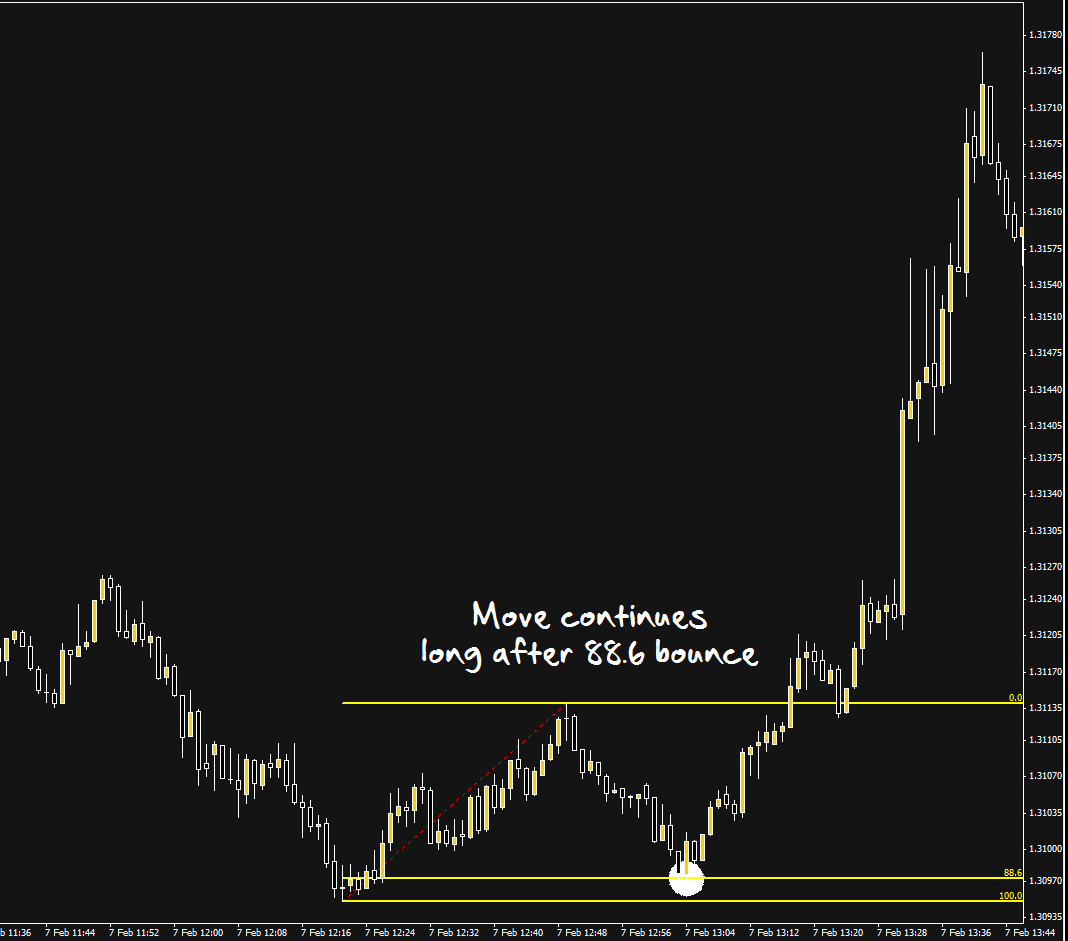
It is worth pointing out that the price at the 88.6% level, 1.3097, was also a previous area of support & resistance, further validating an entry. In the following 5-minute chart I’ve marked 1.3097 with a red line and looking back on the chart you can see previous support/resistance that I’ve highlighted with grey boxes:
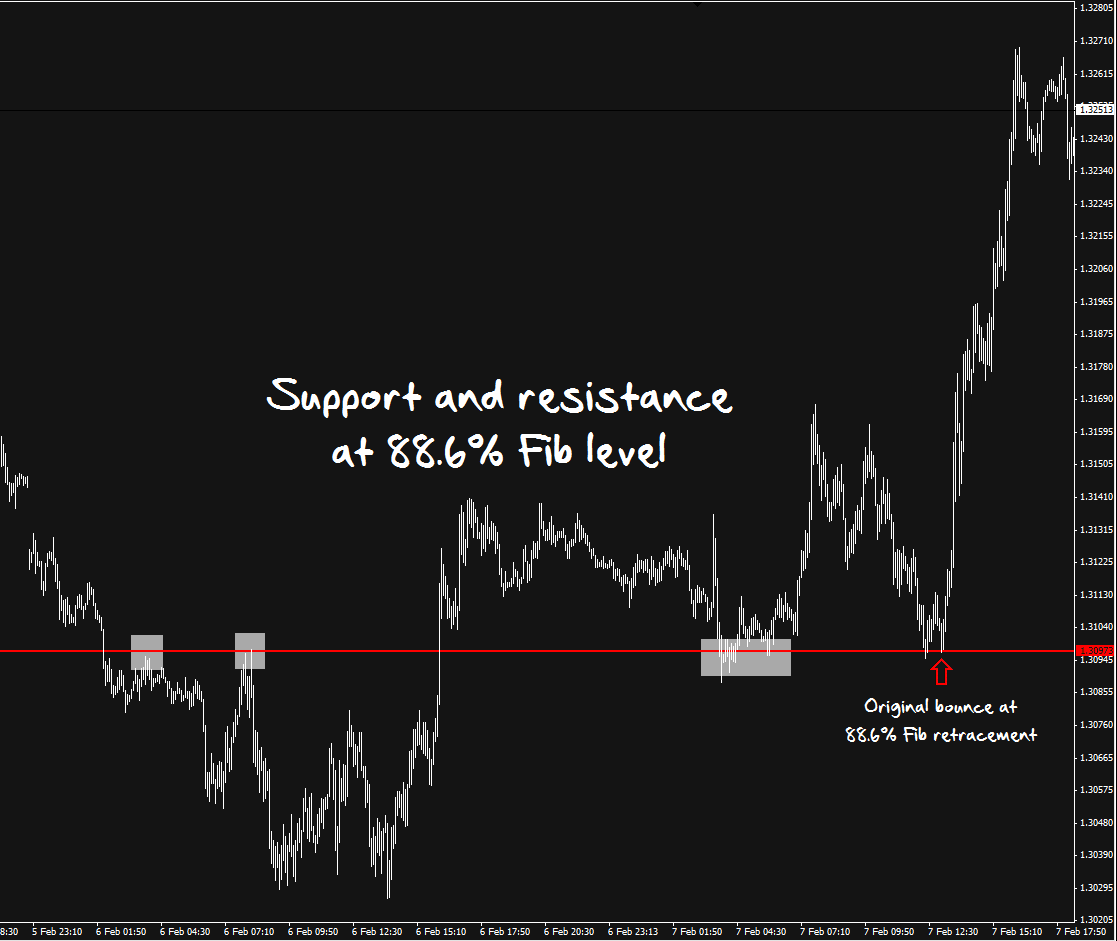
The previous support/resistance confluence is particularly useful because the previous trend on the 1-minute & 5-minute was down, so taking a long trade was against that short-term trend.
As the day unfolded, the uptrend paused and developed into a range that lasted for about 35 minutes. During that range, another 88.6% retracement occurred that presented opportunities to buy into the current uptrend and/or add to previous long positions.
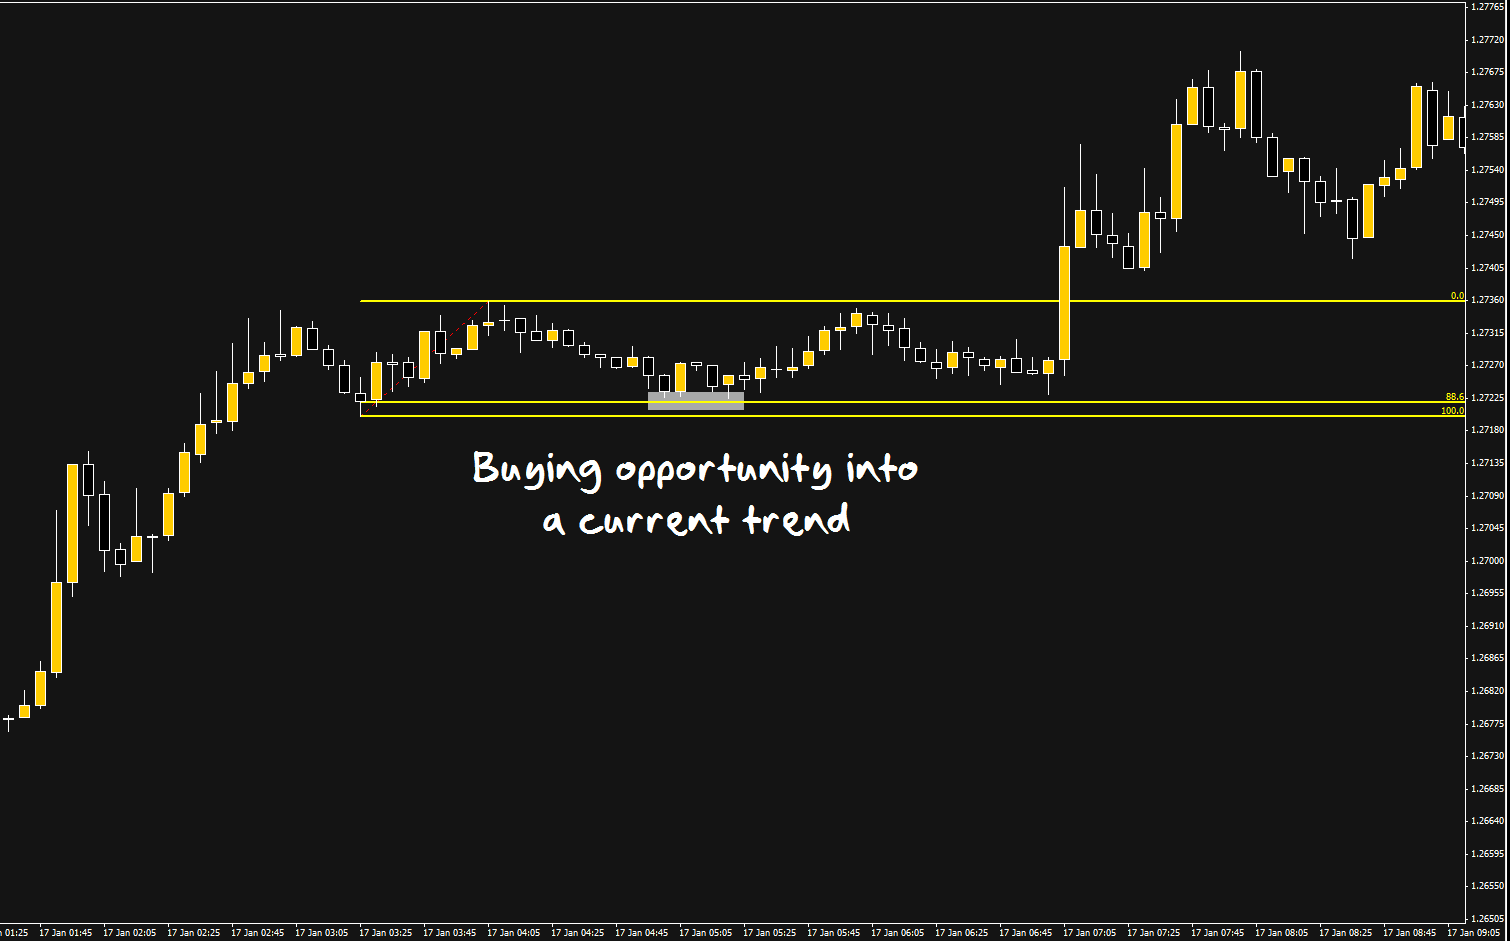
The other advantage an 88.6% bounce has over 61.8%, is that the price has further to travel to the previous high (in this case for a long trade), therefore giving you a better risk/reward ratio for your trade.
Typically, I place stops just below the 88.6 level or the 100.0 level. Ask yourself first, what is the risk/reward ratio on the trade? If your minimum target of reaching the beginning of the retracement, i.e. the Zero Level on the Fib lines, cannot be reached with a decent risk/reward, then pass on the trade.
The above examples are for long trades. They work the same in reverse with short trades. In those cases, the 100.0 Fib level is at the previous high, and the Zero Level at a low, and you’re looking for the price to move up to the 88.6% and bounce down.
Simplify your Fib retracement lines to 61.8% and 88.6% (or even just 88.6%) and start looking for these bounces...
In Summary
1. The 88.6% Fib retracement level is one of the more powerful Fibonacci levels when it produces a bounce; you can consider a trade just on that level or with previous support/resistance (the best trades are often in line with the larger trend).
2. The 88.6% level gives good risk/reward ratio trades when caught early. Always consider risk/reward for every trade.
3. Bounces off 88.6% retracements often travel much further than just the previous retracement allowing you to trail some of your position.
Fibs and Triangles: Getting 80 Pips with a 25 Pip Stop
We’ve written about the importance of a much overlooked chart pattern, the “Triangle”, and how it can produce accurate trades with excellent risk/reward ratios.
Here, we’re going to look at this concept tied in with a Fibonacci retracement level that I love, the 88.6 Fib percentage. To recap, the Fibonacci Golden ratio is 61.8%. If you square root that percentage, and square root it again, you get 0.886, or 88.6%. I often use a bounce off the 88.6% Fib level as a trade entry.
Let’s dive right in and look at an example. This is a live trade that I took on the GBP/USD on a 15-minute chart.
The following chart is the point at which I saw the trade developing:
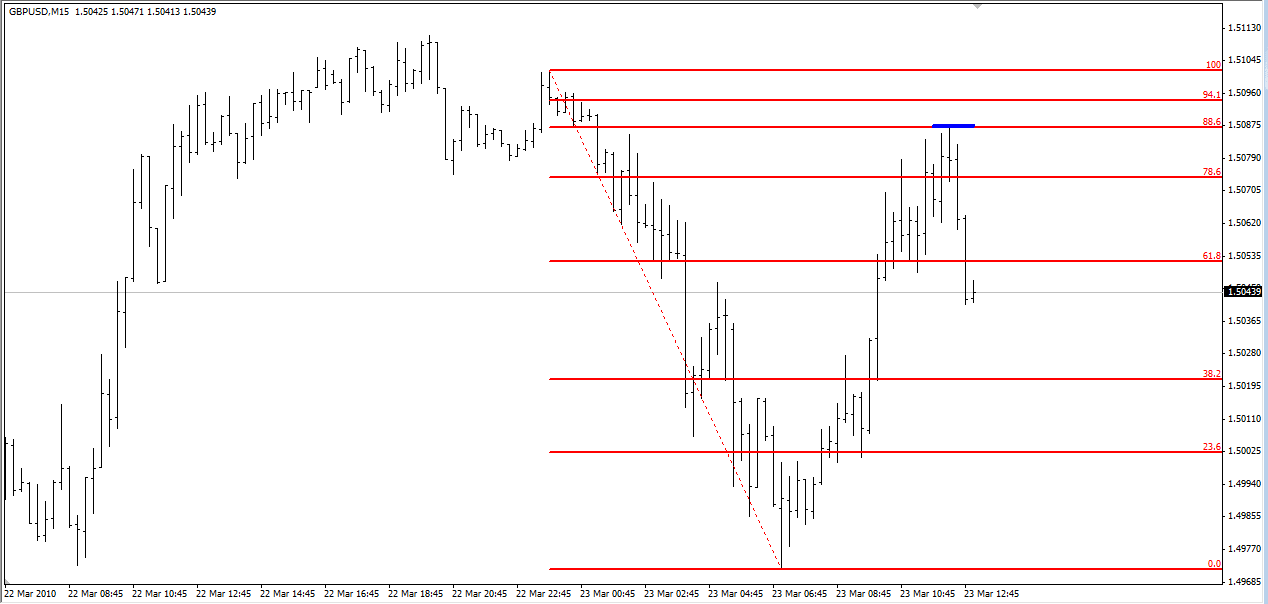
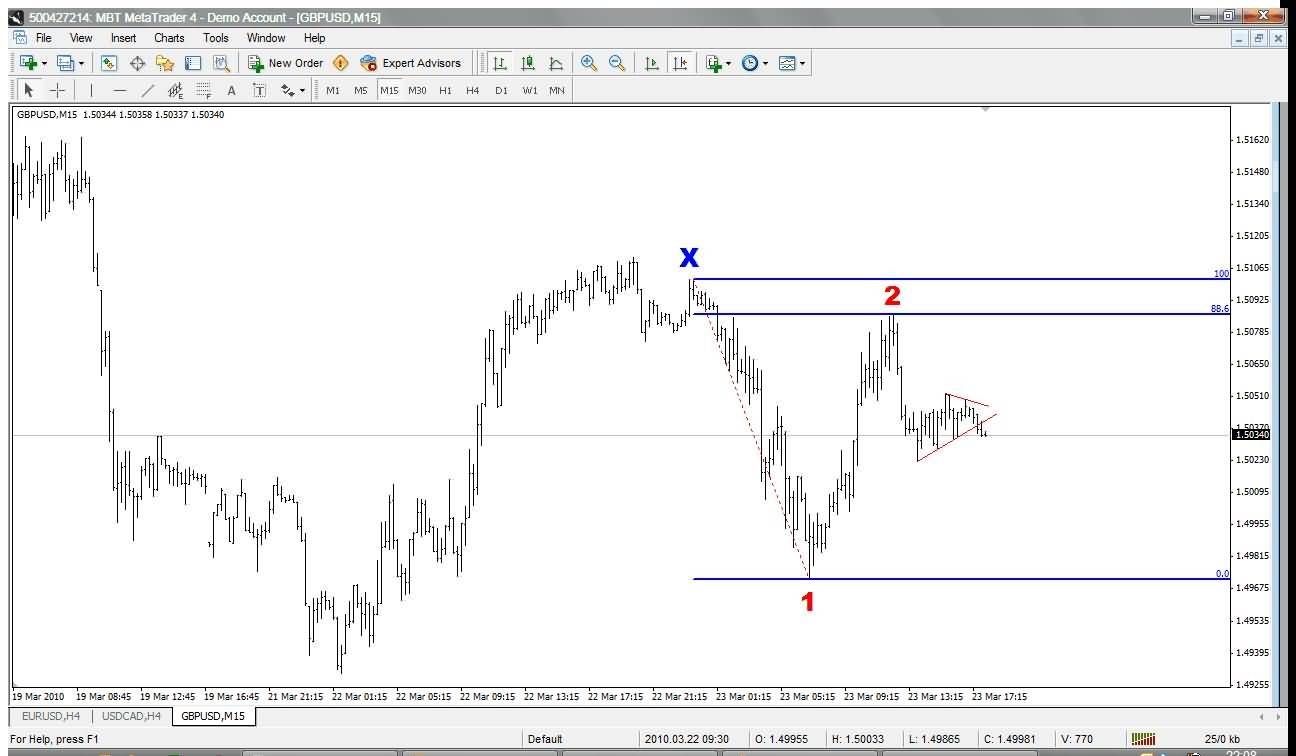
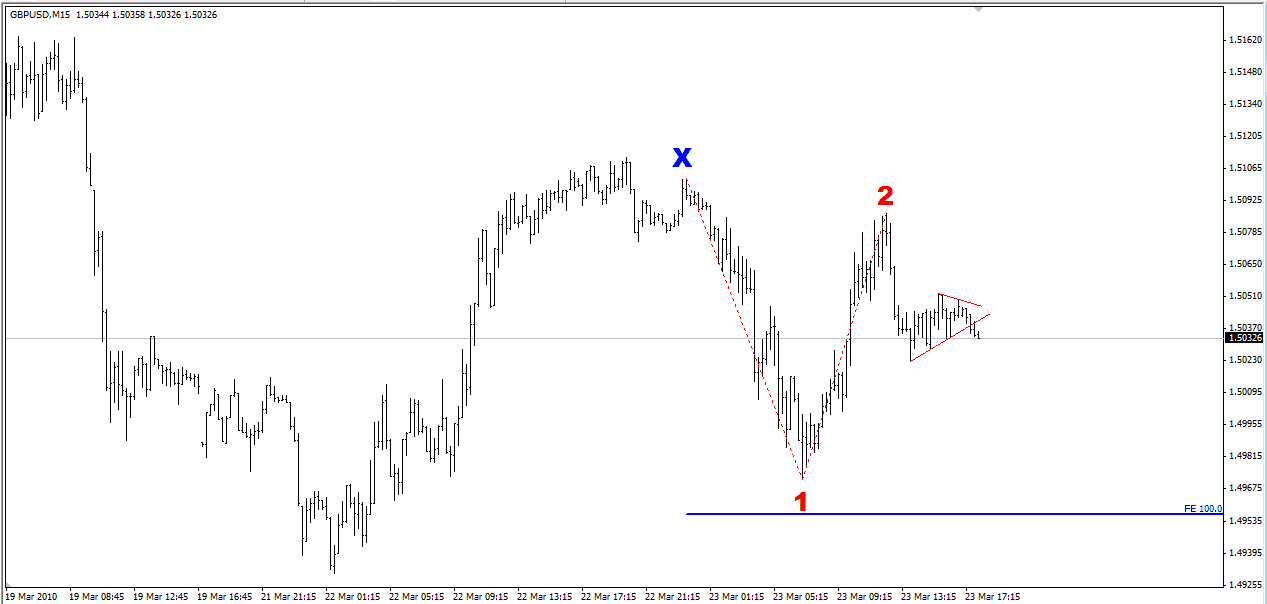
My logic was this: The price moved from a high to a low (marked by the 100% and 0% lines) and then moved back up to the 88.6% level (highlighted by the small blue line). The price bounced off that level to the exact pip. I felt the price would continue moving down and extend the previous down-move past the 0% level.
I could have entered a short position immediately but the nearest place for a stop was around 45 pips away (above the previous high); whilst the profit-target was over 80 pips giving an okay risk/reward, I felt I could get a tighter stop-loss on a consolidation. So instead I waited for a pull back or a consolidation (such as a triangle) to plan the trade from. The risk with waiting is missing the trade entirely as the price could just rocket down and not consolidate at all.
Getting Into the Trade
When I checked the chart again, I noticed a triangle consolidation that the price had just broken out from and decided this made a good entry point. I used a 25 pip stop that was just above the triangle. In the following chart, I’ve marked just the initial high as Point X, the low as Point 1, and the 88.6% level as Point 2 (and removed the other Fib levels for clarity). And the triangle pattern is marked with the red lines.
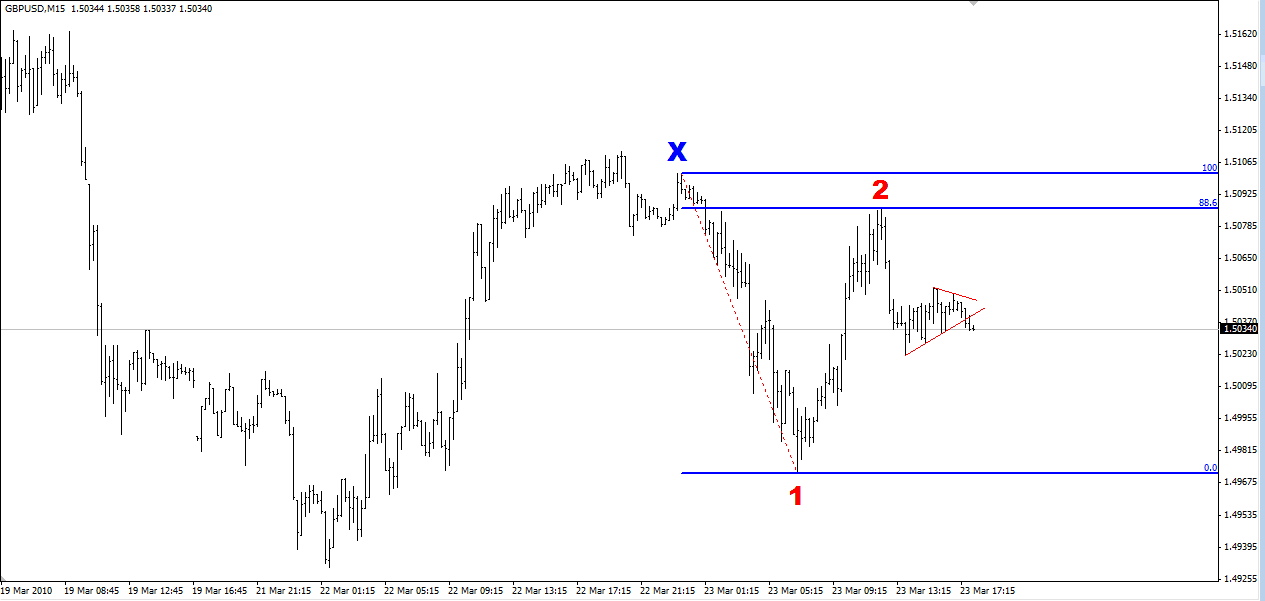
Getting Out of the Trade
My target was a 100% extension of Wave 1. This means you take the size of Wave 1, i.e. from Point X to Point 1, and measure 100% of that size from Point 2. That gave me a target of about 80 pips away from my entry. This was a risk/reward ratio of over 1:3 which I think is very acceptable.
When it hit the target, it broke it by 1-2 pips before rebounding and going through it firmly. See the following chart.
In Summary:
1. A Fib level can often produce a good setup, but if you don’t see it quick enough, you may miss the trade or must accept a wide stop
2. The triangle pattern can give you a tighter entry and therefore a better high risk/reward
3. In Forex, the pips made only makes sense when you compare it to the pips you risked!
How to Trade Price Action with Fibonacci
We are going to recap the detailed examples shown above by going back over the general principles you should apply when using Fibonacci levels to trade Forex.
The Fibonacci is normally used by taking two extreme points (the high and low) and measuring the key Fibonacci ratios in between.
An example of the three common levels and how to use them are below. In these examples all 3 diagrams are in an uptrend. They all retrace lower to a Fibonacci level before again moving higher with the trend.
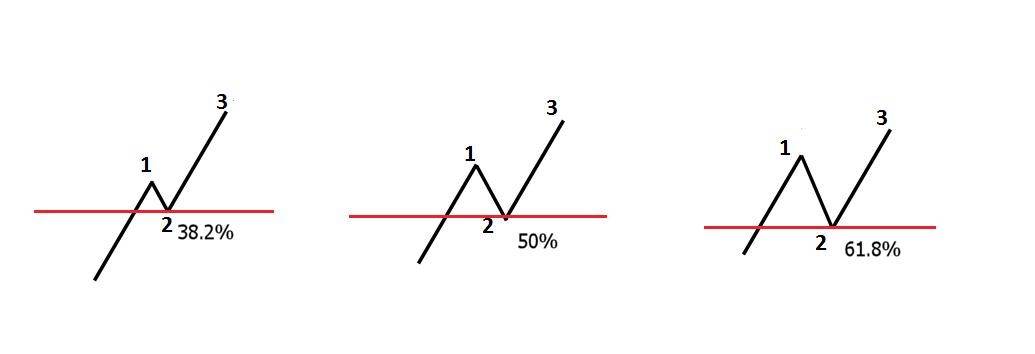
The number 1 on the above diagrams is the first move higher. This is followed by number 2 which is the market retracing lower to the key Fibonacci level. It is here at these key levels where Price Action traders would be looking for solid Price Action and hints from the market to get along with the uptrend. Number 3 represents the market respecting the key Fibonacci levels and moving back higher.
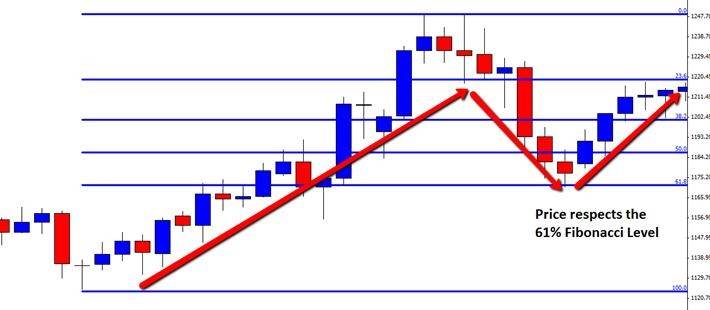
The chart below shows how this pattern works in the Forex market. Price has been moving higher. A retrace back lower falls into the 61% Fibonacci level. The market respects this key Fibonacci levels and again moves higher completing the pattern.
The Fibonacci pattern can be used the exact same way when traders are looking to short the market. The only change is traders are looking to get short and are looking for retraces back higher into key Fibonacci levels to get on board the down trend.
An example of the Fibonacci tool being used in a downtrend is below. Notice price is stopped at the 38.2% Fibonacci level before again moving lower.
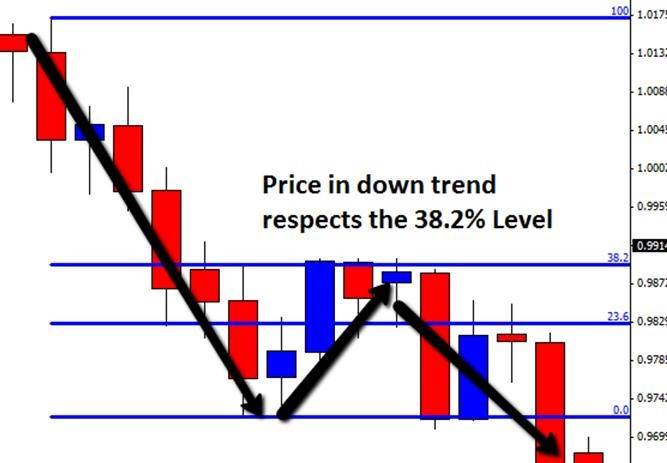
The Fibonacci tool can be a very successful tool when used correctly. To increase the chance of placing a wining trade, traders should look for Price Action at the key Fibonacci levels to confirm a trade.
As suggested with all new trading techniques, make sure you practice this technique with a demo account before ever considering going live. Until you have proven you can use this tool and profit consistently on a demo account do not start “live” trading! If you can’t make money on a demo, you have no chance once trading live!
How to Set Stops with Fibonacci
Most traders are familiar with the use of Fibonacci ratios as entry and take profit points, but few have considered placing stops with FIBS. Using unconventional methods for setting stop loss levels can have a surprisingly uplifting effect on profitability, and when a method can be found that is both unconventional and reliable, a serious edge can be uncovered. Placing stops with FIBS can be such a method.
The point of a stop loss is to limit risk. Most traders tend to take the view that a stop loss should be placed at the point where the trade becomes “wrong”, i.e. an adverse point which if reached means the trade is likely to continue going in the wrong direction. Traders also tend to set stop losses very conservatively, telling themselves that the trade needs “room to breathe” as they place the stop one pip above or below the trigger candle or swing high or low. Is this the correct attitude to take? That depends very much upon the individual trader’s risk to reward profile and trading style.
The best trades often spend little time in negative territory. This is not always true, but if one looks at a large sample of historical trades produced by most types of strategies, especially breakout strategies, a positive correlation of approximately 0.25 is usually found between the trades that take off immediately and the trades that ultimately are winners. This has serious implications for the traditional approach of setting stops so that trades have room to breathe, as a disproportionate number of winning trades don’t need any room to breathe!
This means that many strategies, especially shorter-term breakout strategies, produce a higher positive expectancy if stops are placed more tightly than the other side of the candle or swing. There will be more losers, but the winners will be larger overall. How to tighten these stops? One approach is to look within a shorter time frame for obvious micro support or resistance levels. This can work extremely well, however often such a level is not clearly identifiable, and it is not practical under seriously pressured entry conditions to spend much time looking for one. This is where FIBS can come in. Calculate the pips risk mentally from your entry to where you would traditionally place your stop and apply that number to a FIB calculator. You can select any of the common FIB ratios as they all have some power, but the 50% level does tend to be the strongest. Placing your stop two or three pips beyond the 50% retrace level can almost double the size of your winning trades while being surprisingly protective of many of the best ones. It is recommended to review your past trades and see how your results would have been different using type of stop loss strategy.
There is an alternative approach that can be taken in placing stops with FIBS that is especially appropriate for longer-term strategies that utilize wider, larger stop losses. We can take it for granted that there is stop loss hunting especially during periods of low liquidity. These hunts can and will take the price to those areas one pip above or beyond the swing high, where the herd tends to place its stops. Consider trying to place your stops more out of harm’s way by finding a widely used FIB retracement or extension ratio that can be applied to a larger swing that is placed not too much further away than their traditional stop loss placement area. Place your stop loss a few pips the other side of that level and you might find better protection from the hunters, at a small extra premium. If your trade is for a large target, it can be worth it.
