Inside Bar Pattern—Definition and Meaning
Let’s first define an Inside Bar pattern:
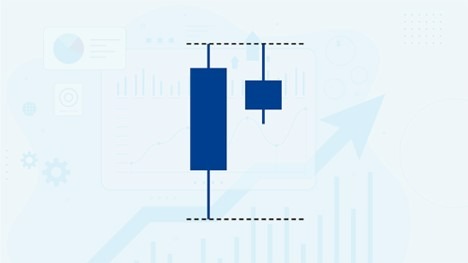
An Inside Bar Pattern is two consecutive candles with the second candle’s high and low range within the first candle’s high and low range.
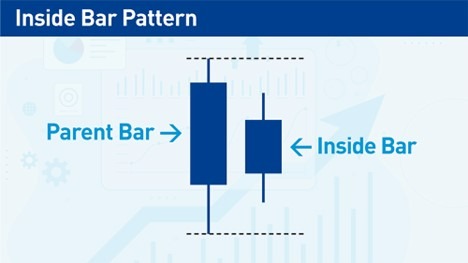
But what about the candles’ bodies—do they have to be within each other or be different colours, etc.?
No, the bodies of each candle do not play a role in defining an Inside Bar pattern. It does not matter if one candle’s body is outside the range of the previous candle’s body or whether the candle bodies are bullish or bearish. The Inside Bar Pattern only concerns each candle’s high and low range.
If the two candles have the same highs or lows, but the rest of the candle is in the range, is it a valid Inside Bar Pattern?
Most traders do not consider this a true Inside Bar setup. However, if I see the second candle as much shorter than the first, for example, less than half its length, I will treat it like an Inside Bar Setup.
What Does an Inside Bar Pattern Represent?
- Reduced volatility, i.e., a consolidation.
When a candle has less range, the price is less volatile. The Inside Bar Pattern shows that the market is experiencing a volatility squeeze, also known as a contraction or consolidation.
Volatility is cyclical—a contraction will eventually be followed by an expansion in price, i.e., at some point, the price will break out of an Inside Bar Pattern. Price action analysis will be the key to determining whether the price will break out in the direction of the previous momentum or be a reversal.
Top Forex Brokers
When is the inside Bar Pattern Broken?
The Inside Bar Pattern is broken when the price breaks the parent bar in the setup shown previously. This does not have to happen immediately after the Inside Bar setup—when the price takes a long while to break out from the range of the parent bar, the subsequent breakout is often more decisive.
How to Trade with Inside Bar Patterns
Let’s look at two types of price action analysis that work well with Inside Bars: trends and ranging markets.
Trends
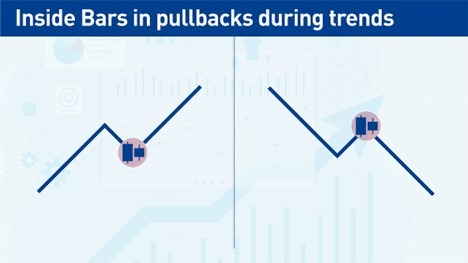
Trends can be the most profitable market condition to make money if a trader can find a reliable entry mechanism—that is where an Inside Bar Pattern can help.
An Inside Bar represents a consolidation or a pause in a trend. The expectation is usually that the trend will continue after the pattern. Once I identify an established trend (higher lows for an uptrend or lower highs for a downtrend), I can look for an Inside Bar Pattern to appear and use that to enter. I prefer to see the Inside Bar Pattern as part of a pullback in a trend—that way, there is less risk of a false breakout.
Ranging Markets
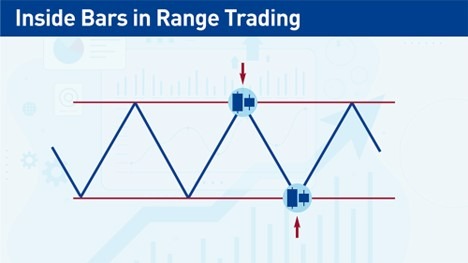
A ranging market is when the price trades within horizontal support and resistance levels. These levels are rarely exact, and it is more practical to consider them zones instead. When there is a price zone instead of an exact level, the Inside Bar is a great way to signal to find a precise area to enter a trade in the zone.
Trading with Inside Bars—Entries, Stops, Exits
Entries
Long trade: after an Inside Bar, a long entry should be above the high of the parent bar.
Short trade: after an Inside Bar, a short entry should be below the low of the parent bar.
Stop-Loss
Long trade: The stop-loss should be below the low of the parent bar or below a recent support level.
Short trade: The stop-loss should be above the high of the parent bar or above a recent resistance level.
Using a previous support or resistance level as a stop-loss will result in a larger stop loss. But it also means there is less likelihood of being stopped out too early in the trade, i.e., it can give the trade more breathing room.
Target
I always ensure I can get at least a 1:1 reward/risk ratio (1R) on any trade. I will not take a trade if there’s a nearby support or resistance level that could stall the trade before getting to at least 1R. Once I know the trade has at least the potential of 1R, I usually keep a target at the most recent resistance level for a long trade or support level for a short trade.
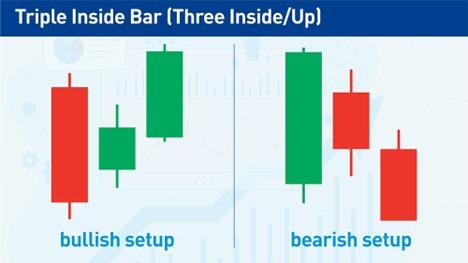
Triple Inside Bar (Three Inside/Up)
This strategy uses Inside Bar principles to find short-term reversals.
Step 1: Long candle
We want to see a bearish or bullish candle with a long body.
Step 2: Next candle’s body is inside the previous candle’s body and is in the opposite direction.
Traditional Inside Bar rules do not use the candle’s body. But in this case, the strategy does. If the first candle was bullish, the second candle should be bearish.
Step 3: The third candle continues in the direction of the second candle and closes above the second candle’s close.
Step 4: Enter at the opening of the next candle.
Place a stop loss below (long trade) or above (short trade) the first candle.
The Hikkake Pattern — Trading False Breakouts
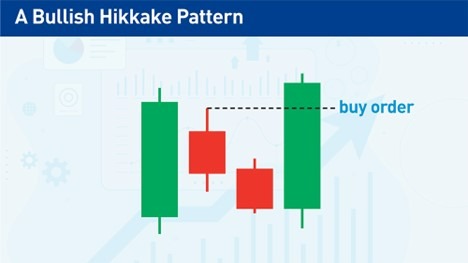
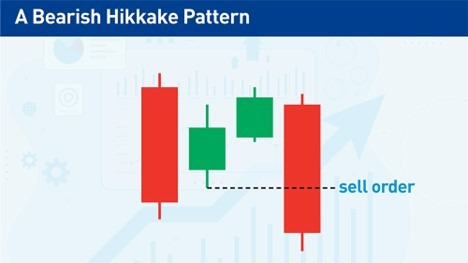
False breakouts happen regularly, and they usually result in losses. But they also represent an opportunity to trade proactively. The Hikkake Pattern, developed by Daniel L. Chesler in 2003, is a rules-based method using the Inside Bar Pattern to trade false breakouts.
Step 1: Wait for an Inside Bar.
Step 2: The following bar must have a higher low and higher high compared to the Inside Bar or a lower high and lower low compared to the Inside Bar.
Now the price is showing direction, either bullish or bearish. Remember, this rule focuses on the highs & lows relative to the Inside Bar, not the parent bar.
Step 3: Place an entry order above or below the Inside Bar.
Remember, the Hikkake Pattern is looking for a false breakout. If the previous candle was a higher low and high, I am looking for a bearish trade and will place a sell-stop order below the low of the Inside Bar. If the previous candle were a lower high and low, I would place a buy-stop order above the Inside Bar.
Step 4: If the order entry is not triggered within three bars of Step 2, cancel the trade.
The power of this method is that the price has a rapid reversal after the initial breakout from the Inside Bar. If that reversal does not occur relatively quickly within the first breakout, the chances of it being a valid trade are less.
Tips on Trading the Inside Bar Pattern
- Look for a big difference between the size of the parent bar vs. the Inside Bar. The whole point of the setup is to show consolidation—the larger the difference between the two bars, the higher the degree of consolidation.
- Higher timeframes are more reliable. I only take notice of Inside Bars on daily timeframes and above. 4-hour Inside Bars are valid, but there will be too many of them on timeframes lower than that to give them much meaning.
- Price action context is key to trading Inside Bars. Inside Bars is a short-term candlestick pattern within wider context price action. It helps find precision in entering trades, but the price action determines the overall direction.
Advantages and Disadvantages of Inside Bar Trading
Advantages
- Easy to spot. It is one of the simplest candlestick patterns out there. No special indicators are required, and you can use any charting platform.
- They help find precision in entering trades. For example, if you are looking for entry points in trends or ranges, Inside Bar Patterns can be tremendously helpful.
Disadvantages
- They are not a tool to use in isolation. Price action context is massively essential when trading Inside Bar patterns. Do not buy or sell a breakout of a pattern without first looking to see what the market is doing. Is there a trend? Is the Inside Bar near a support or resistance level? The answer to these questions will determine how to trade Inside Bar Patterns.
- Inside Bar Patterns are less effective on lower timeframes. The optimal timeframe for Inside Bar Patterns is the daily chart or above. Below the 4-hour charts, Inside Bar Patterns lose effectiveness.
Bottom Line
The Inside Bar Pattern is a simple and easy-to-spot 2-candlestick pattern. It represents a consolidation in the market or a contraction in volatility. That is not a signal by itself, but when it happens at crucial market moments, the pattern makes for a good entry point. Inside Bar Patterns are particularly useful for finding entries into trends or in ranging markets when the price is near support or resistance levels.
