As a long-time Forex and futures trader, my trading strategy involves primarily technical analyses. I look at price charts, and almost never use indicators in my trading. I also look at economic calendars – not so much to analyze interest rates, but more to get an idea of what drives the markets.
Let's talk about breakout trading. As the name suggests, breakout trading is a trading style in which you wait for the price to break out. First, we'll discuss the theory of breakout trading, what breakouts are, how we define them, what constitutes a breakout, etc. Then, we'll look at a live breakout trade and look at the anatomy and sequences of the trade, so that you can see how we apply the theory.
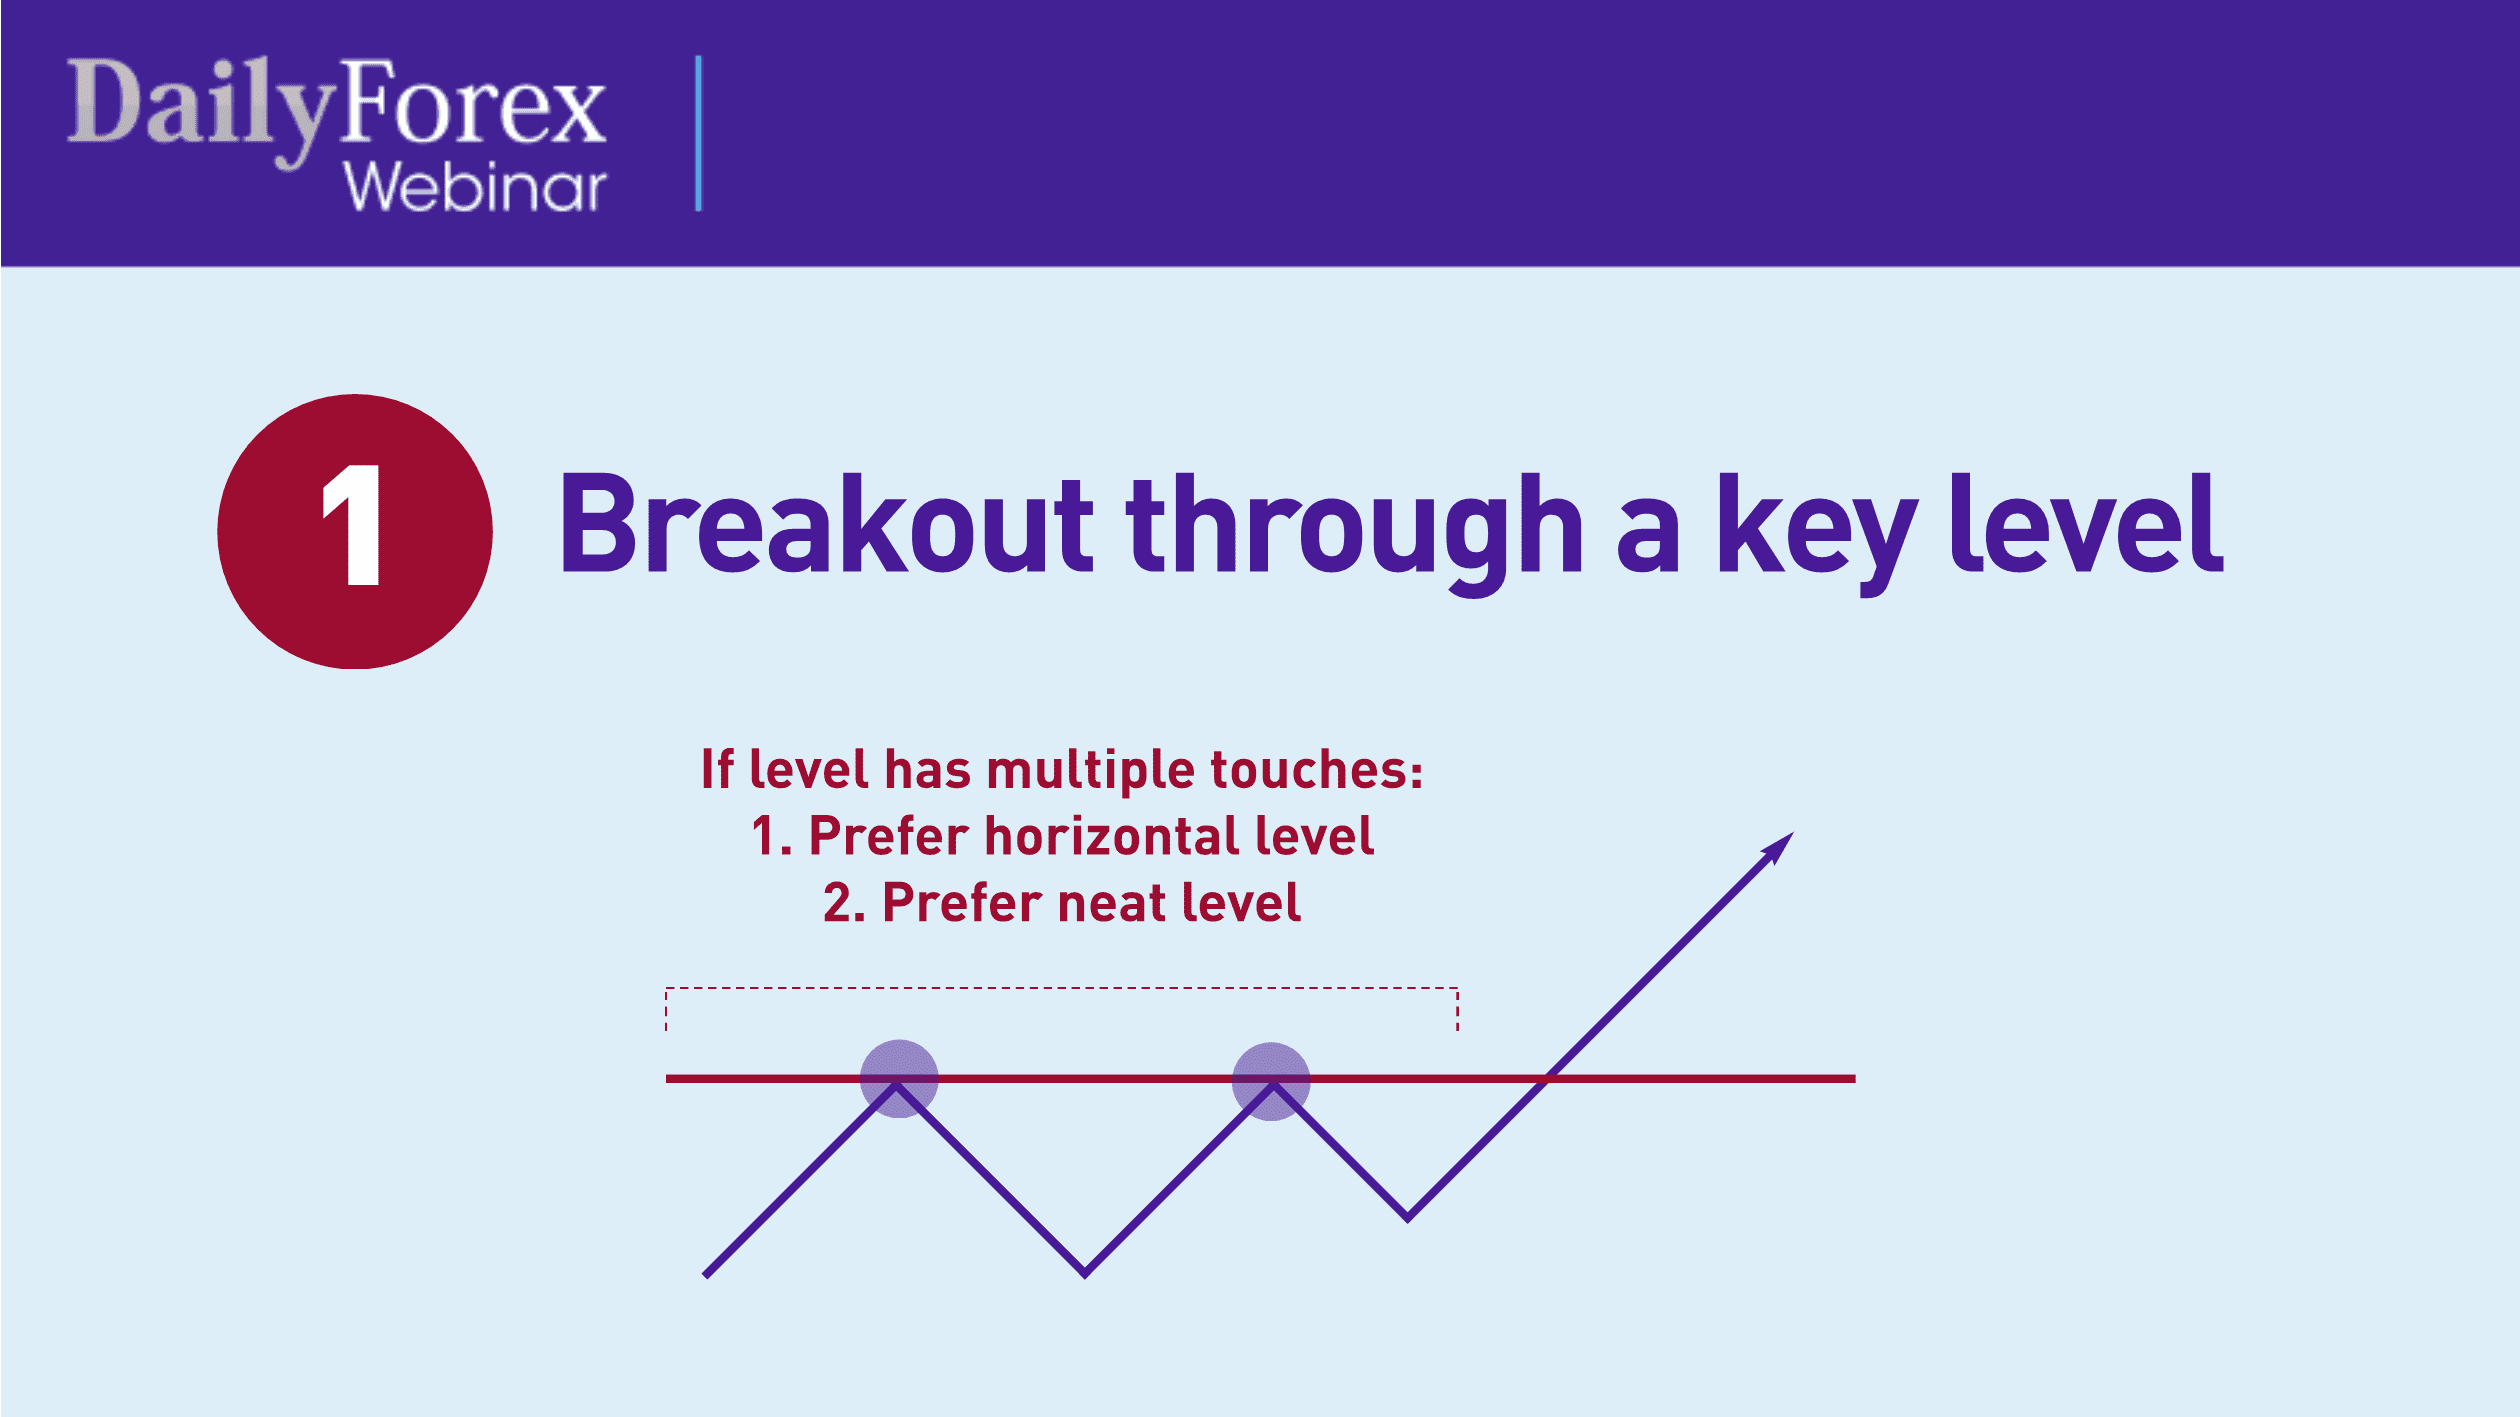
The first type of breakout is a breakout from a key level. When I use the term “key level”, I'm referring to a support level or resistance level.
This simplified chart, for example, shows how the market will go up and down and make a key level (symbolized by the line), and eventually break through it.
Let me emphasize that if you're looking at a level which has multiple touches, such as this one, you want to (a) make sure the level is flat and horizontal, and (b) that it is neat, i.e., without candles poking through the level.
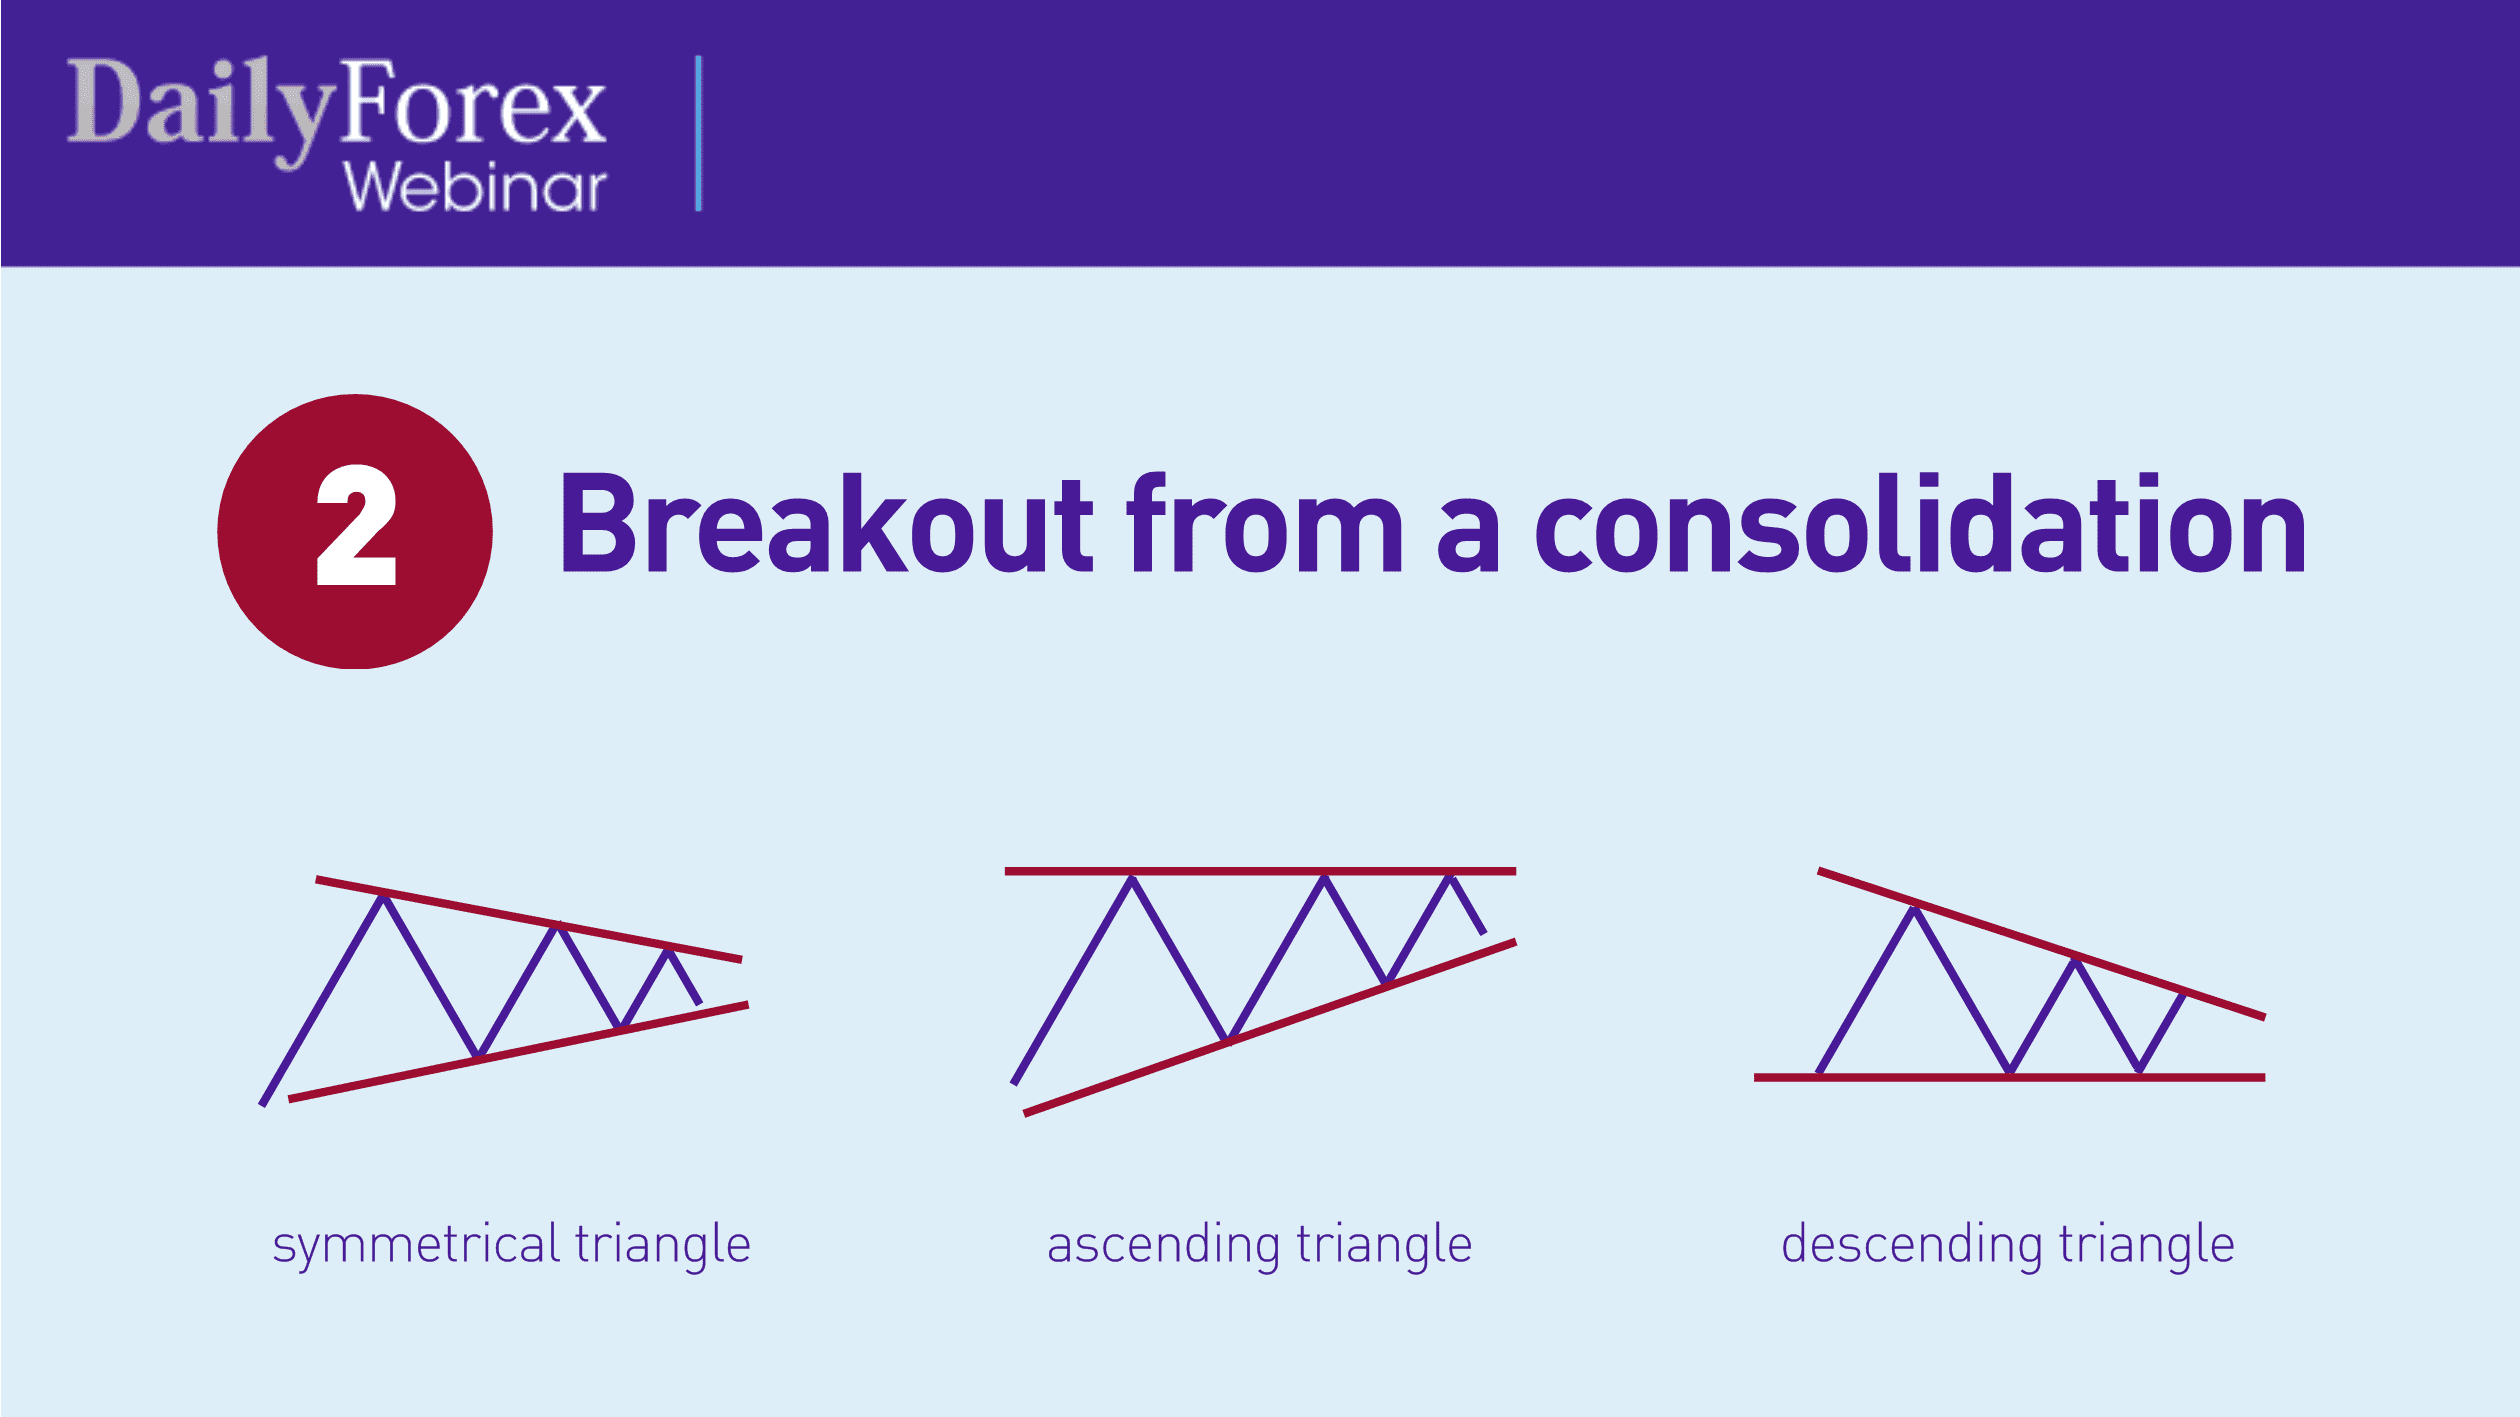
The other type of breakout to consider is a breakout from a consolidation pattern, or a range, where the range becomes tighter over time. It would look triangular, like this:
Each one of these triangles has a name (e.g., symmetrical, ascending, descending, etc.), which you can learn more about at FXacademy.com or through technical analyses.
Let's talk about how to spot breakouts. Firstly, look at news events and the economic calendar. These can drive breakouts if they're high-impact events, such as interest rates, announcements by virtually any central bank, geopolitical events, war, pandemics, etc. Secondly, look to see if a price is consolidating near a key level or tight range. If it's hitting a support or resistance level and coming down in range, then you can safely assume there will be a breakout eventually.
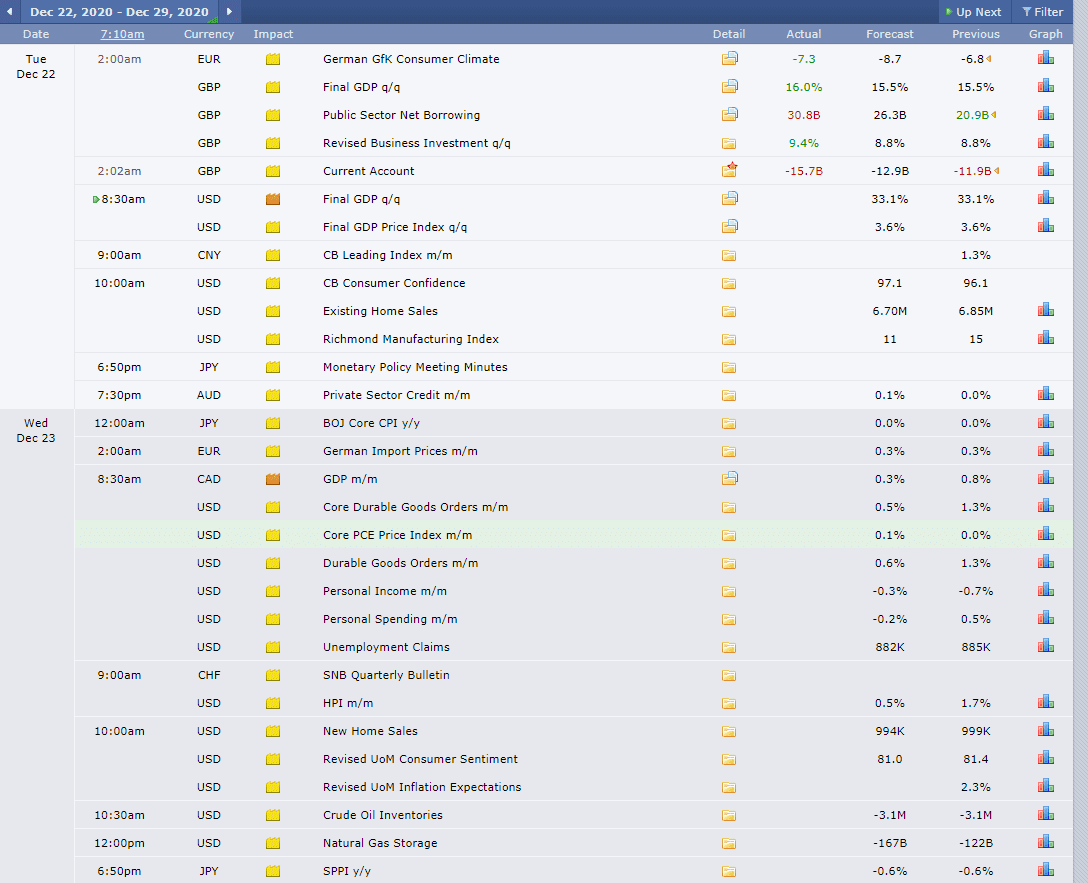
If you're never before used an economic calendar, take a look at this screenshot of the current economic calendar from ForexFactory.com:
You'll see that it color-codes each announcement according to its impact: orange for medium impact, and red for high impact.
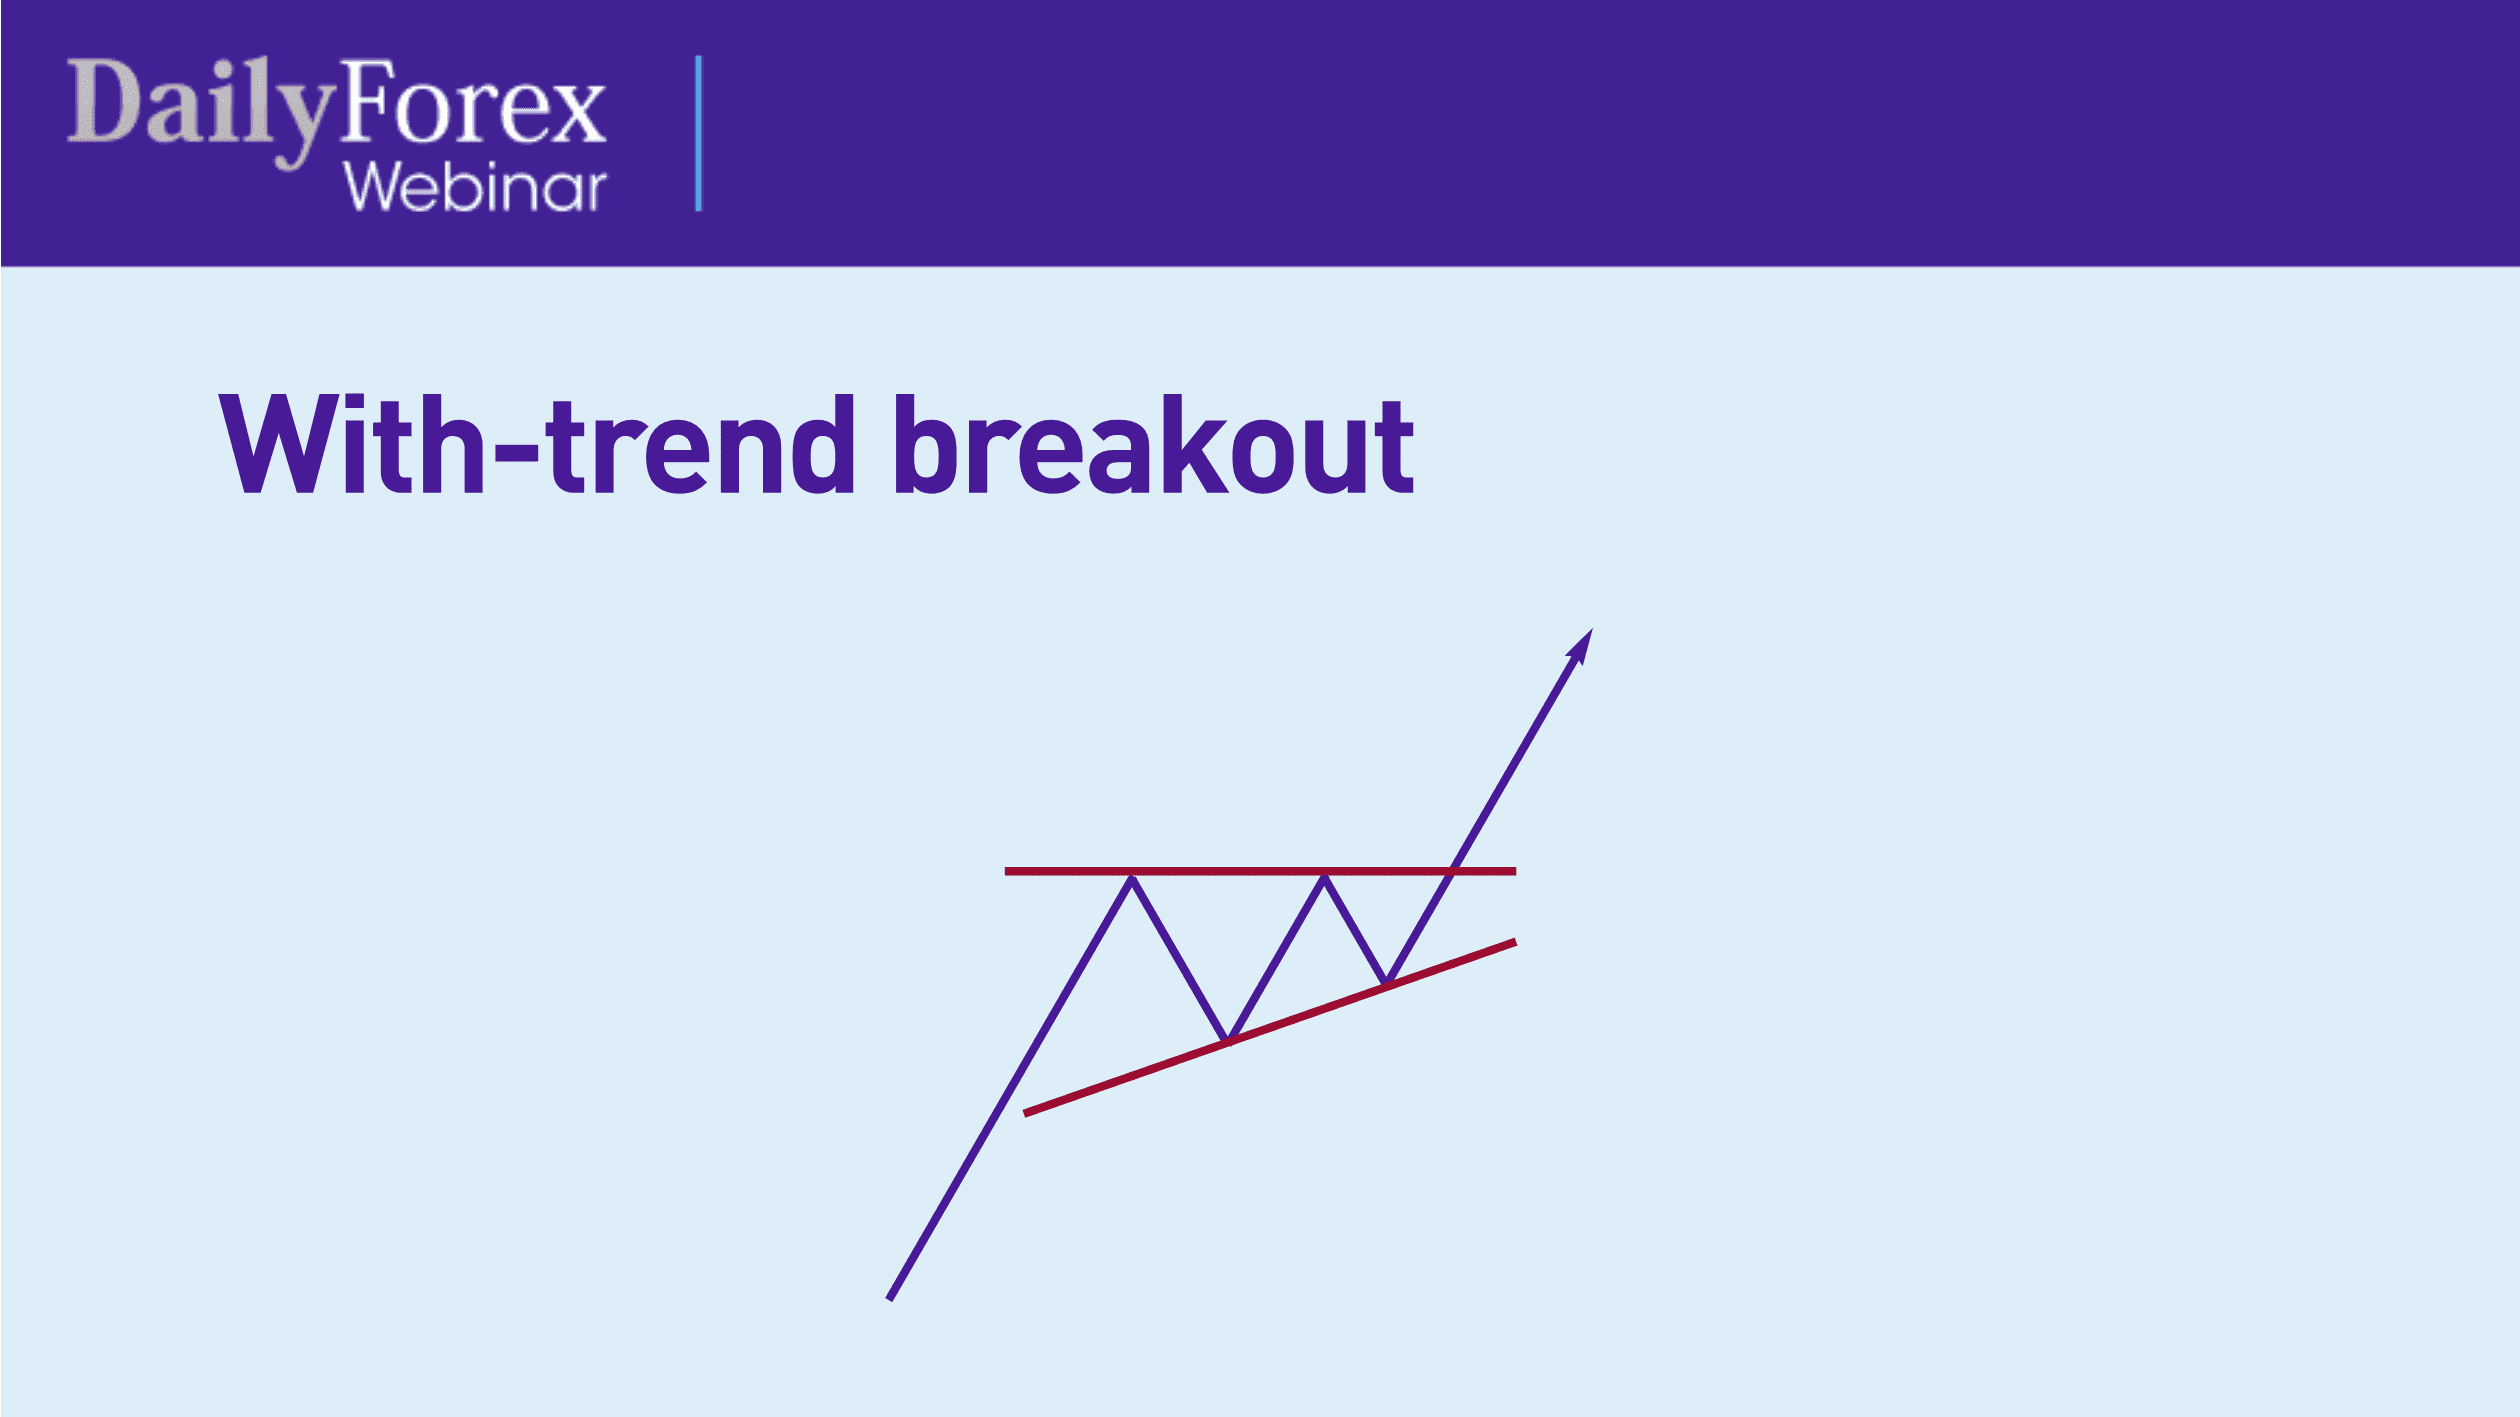
Now, some breakouts happen “with-trend”, where the price goes with the trend and then breaks out, in the same direction as the trend, as you can see here in this simplified chart:
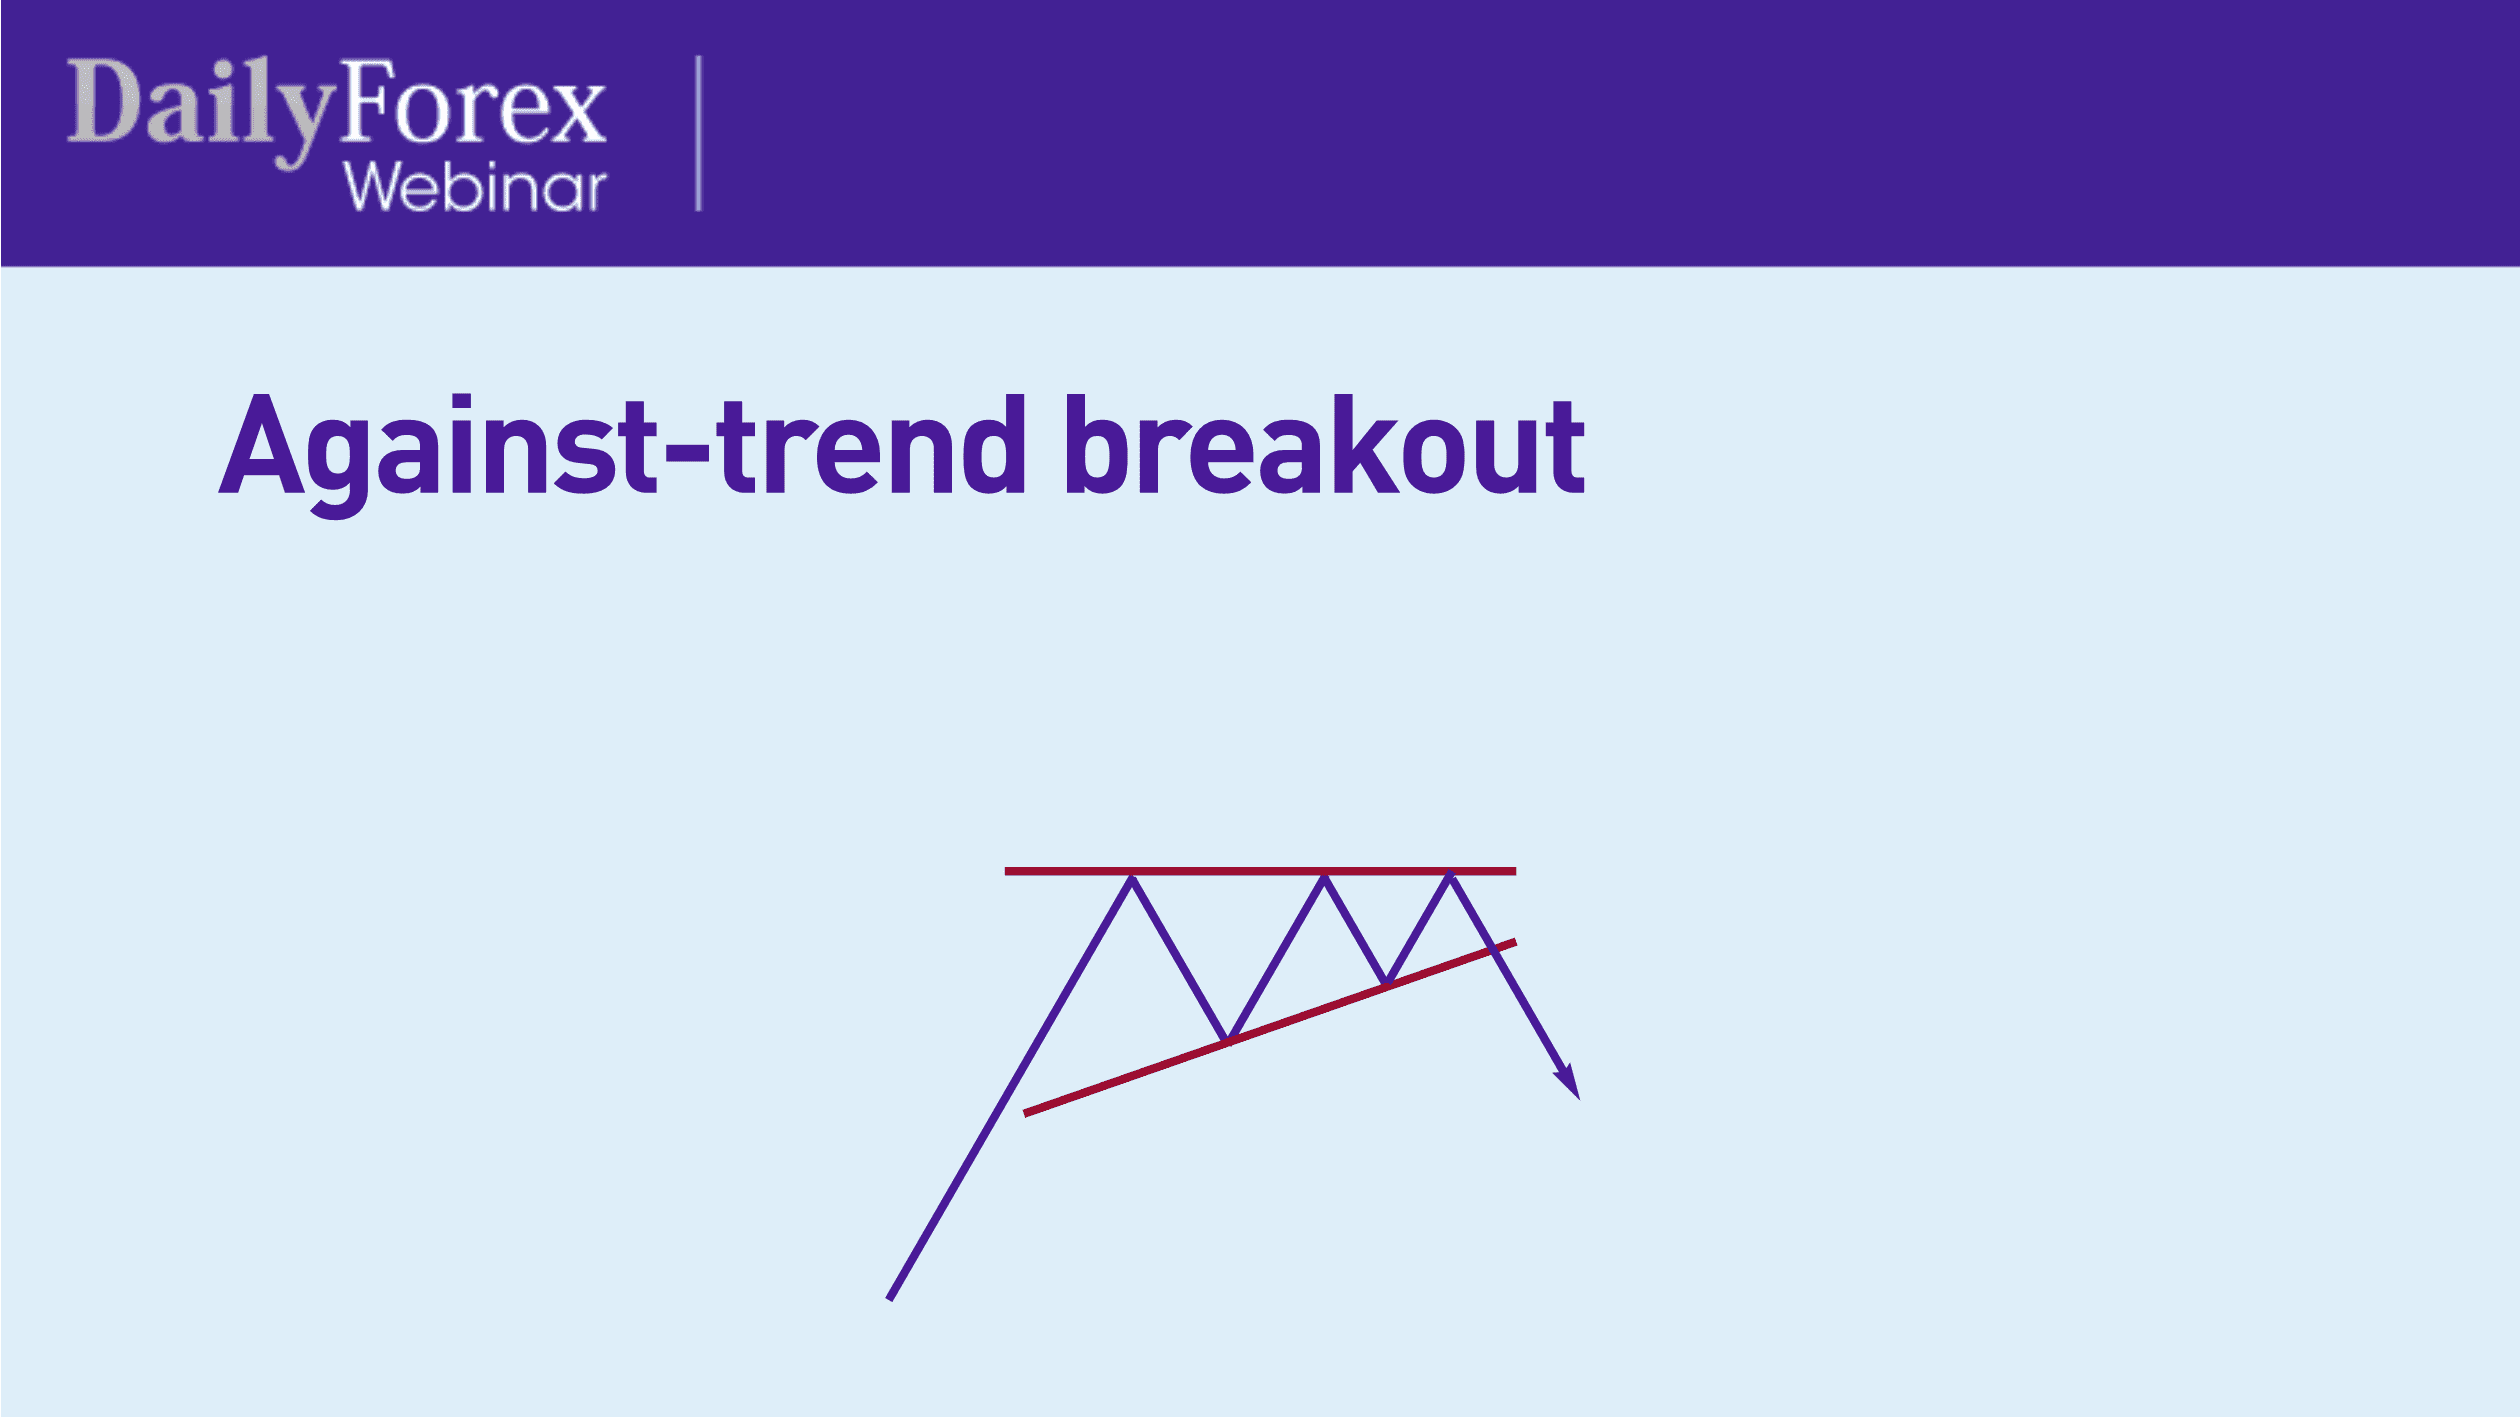
Other breakouts can happen “against-trend”, as you can see here, where the breakout happened against the trend:
With-trend breakouts are considered safer, because it's going with the market flow. In fact, most breakouts are congruent with the trend, and only happen based on confirming factors, which we will discuss.
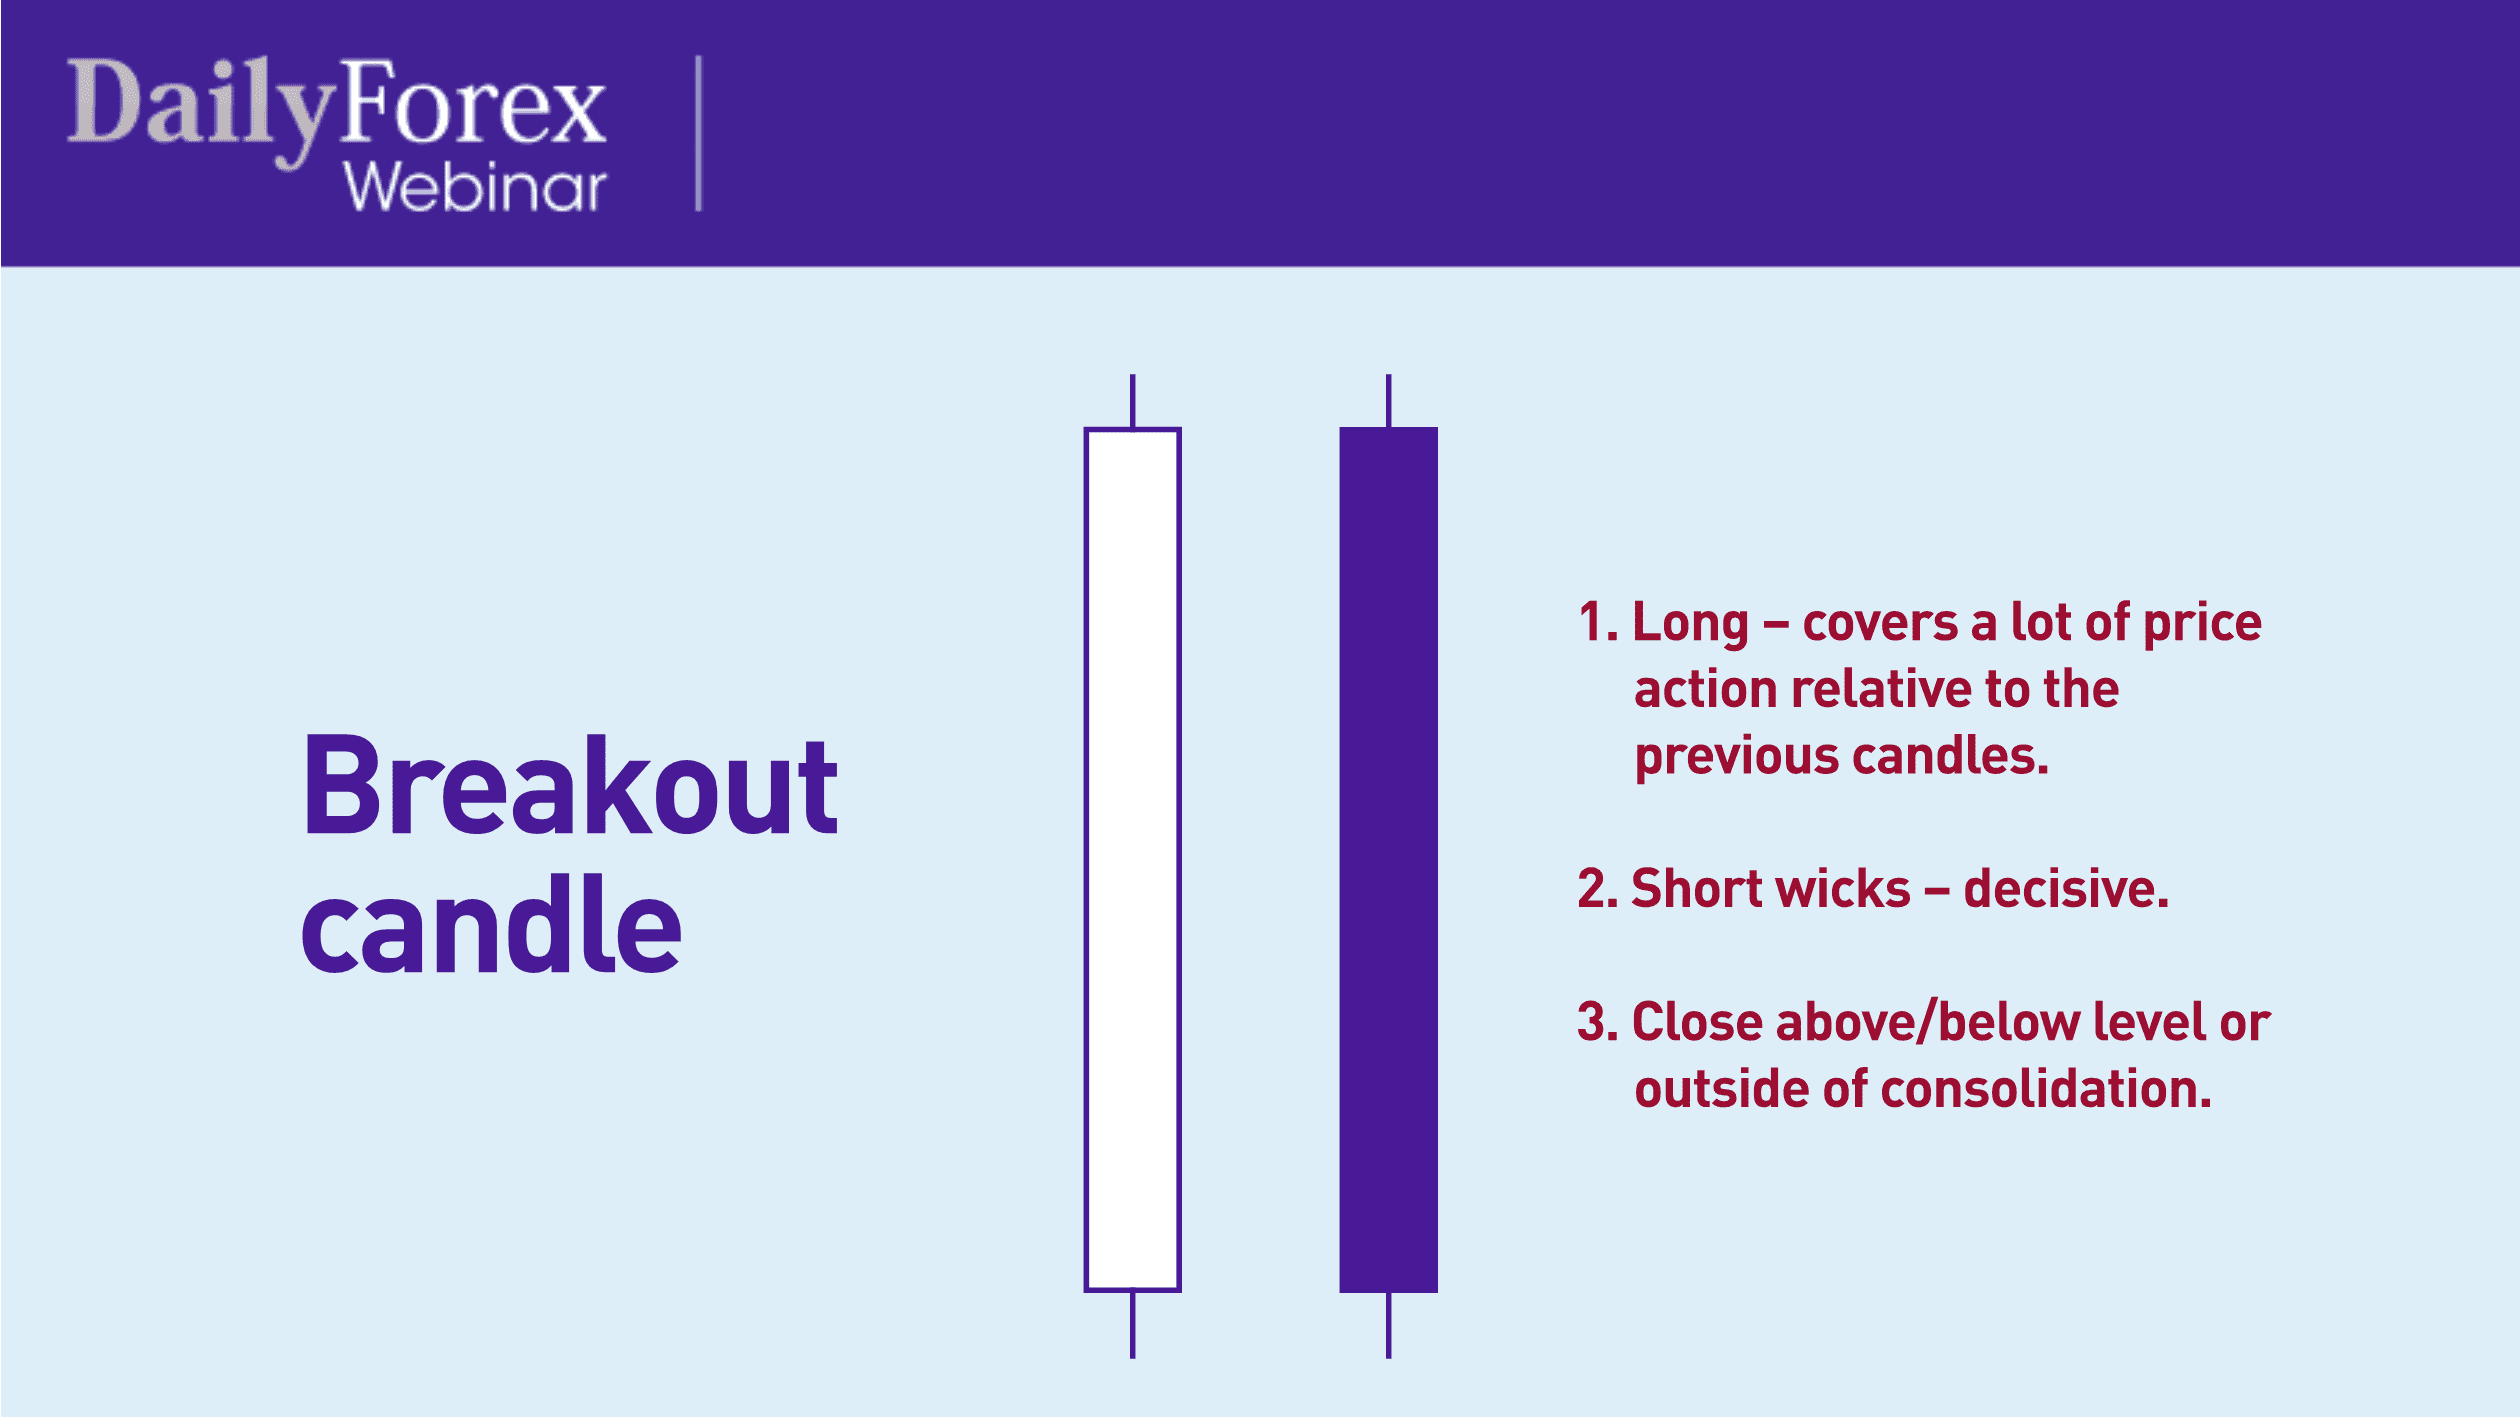
An important part of spotting breakouts is recognizing the breakout candle.
A breakout candle has three key features:
It's long, covering a lot of price action relative to previous candles. The definition of “long” depends on the time frame you're looking at; for instance, 50 pips would be extremely long on an hourly candle, but almost imperceptible on a daily candle. So the candle would need to be longer than previous candles on the same time frame.
It has short wicks. If the wicks are short relative to the body of the candle, it means the candle is decisive. A good point of reference to use in estimating this is to see if both wicks together are no longer than a third of the candle's body. In such a case, the wicks could be described as short.
It closes above or below the key level or outside the pattern/range, if applicable.
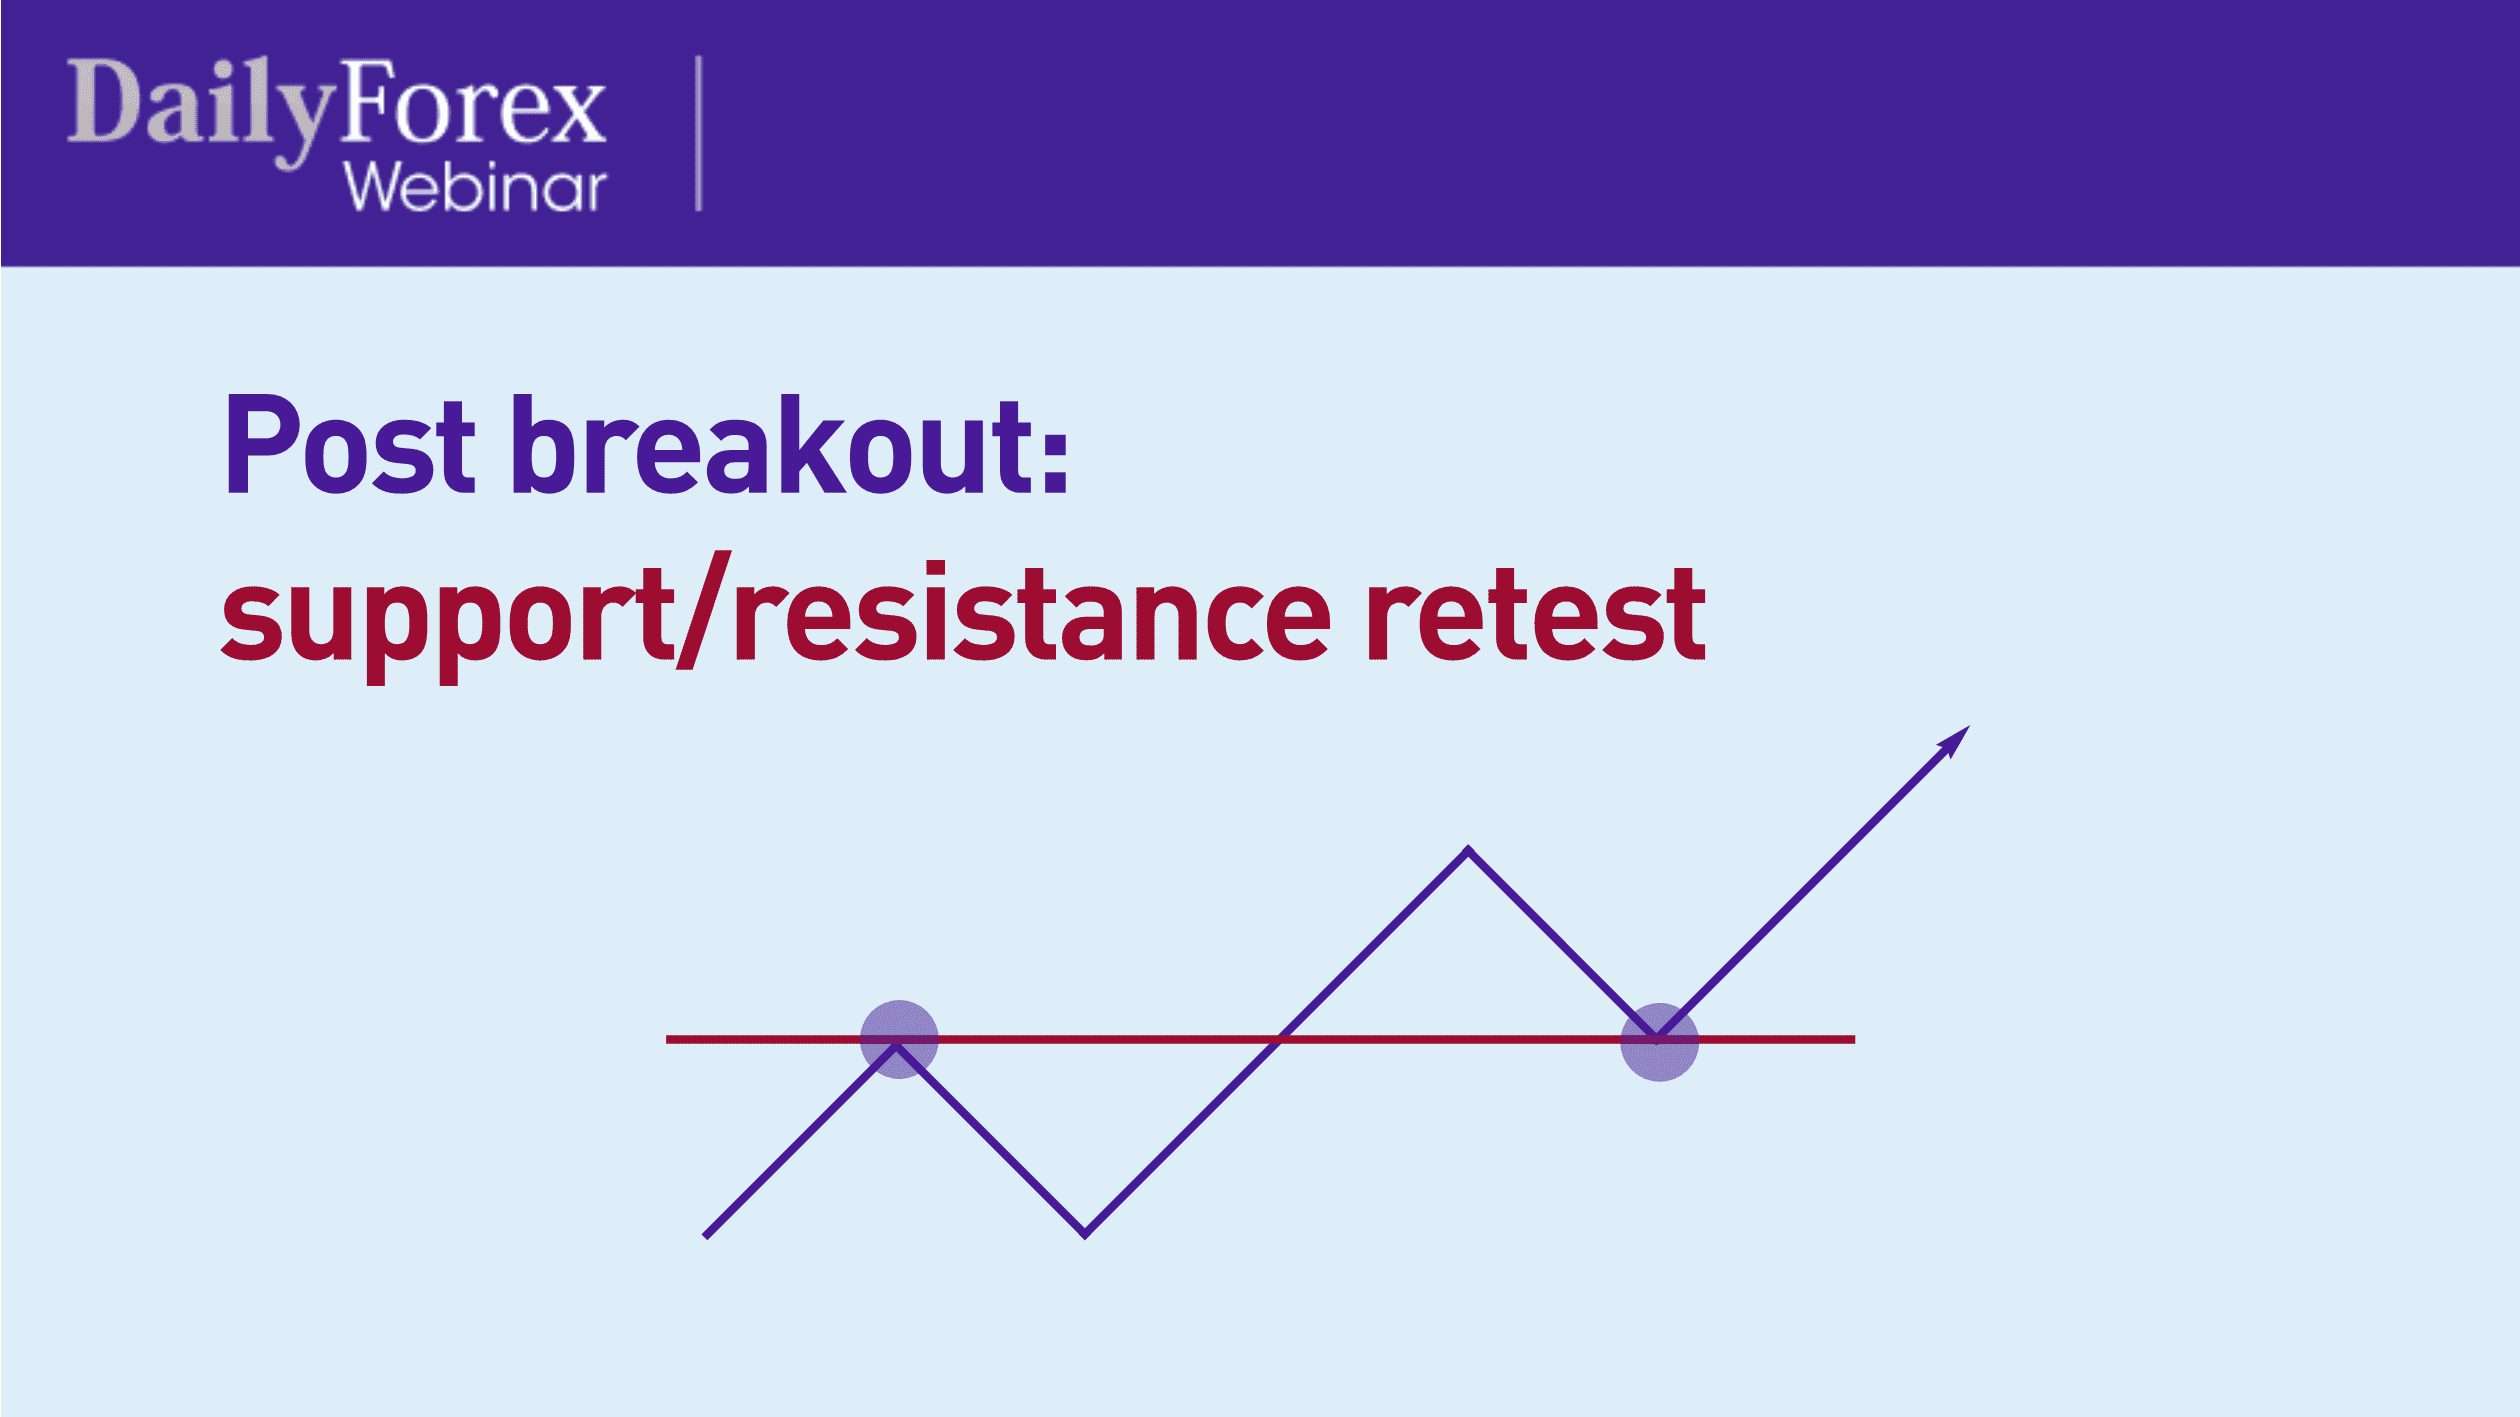
Now, what happens after a breakout? Where should your entry be post-breakout? Often you'll see that post-breakout, the price will do a support/resistance retest. Take this simplified chart, for example:
See here how the price broke out of the resistance and then came back down to re-test that resistance, turning it into a support level as it goes back up, in a classic support/resistance role reversal.
So, after a breakout, you don't want to just jump in with a position. Wait for the price to re-test the level. Occasionally, the price may just keep going, in which case you'll have missed the trade. But if you want to preserve capital and have safe trades, wait until you see a re-test.
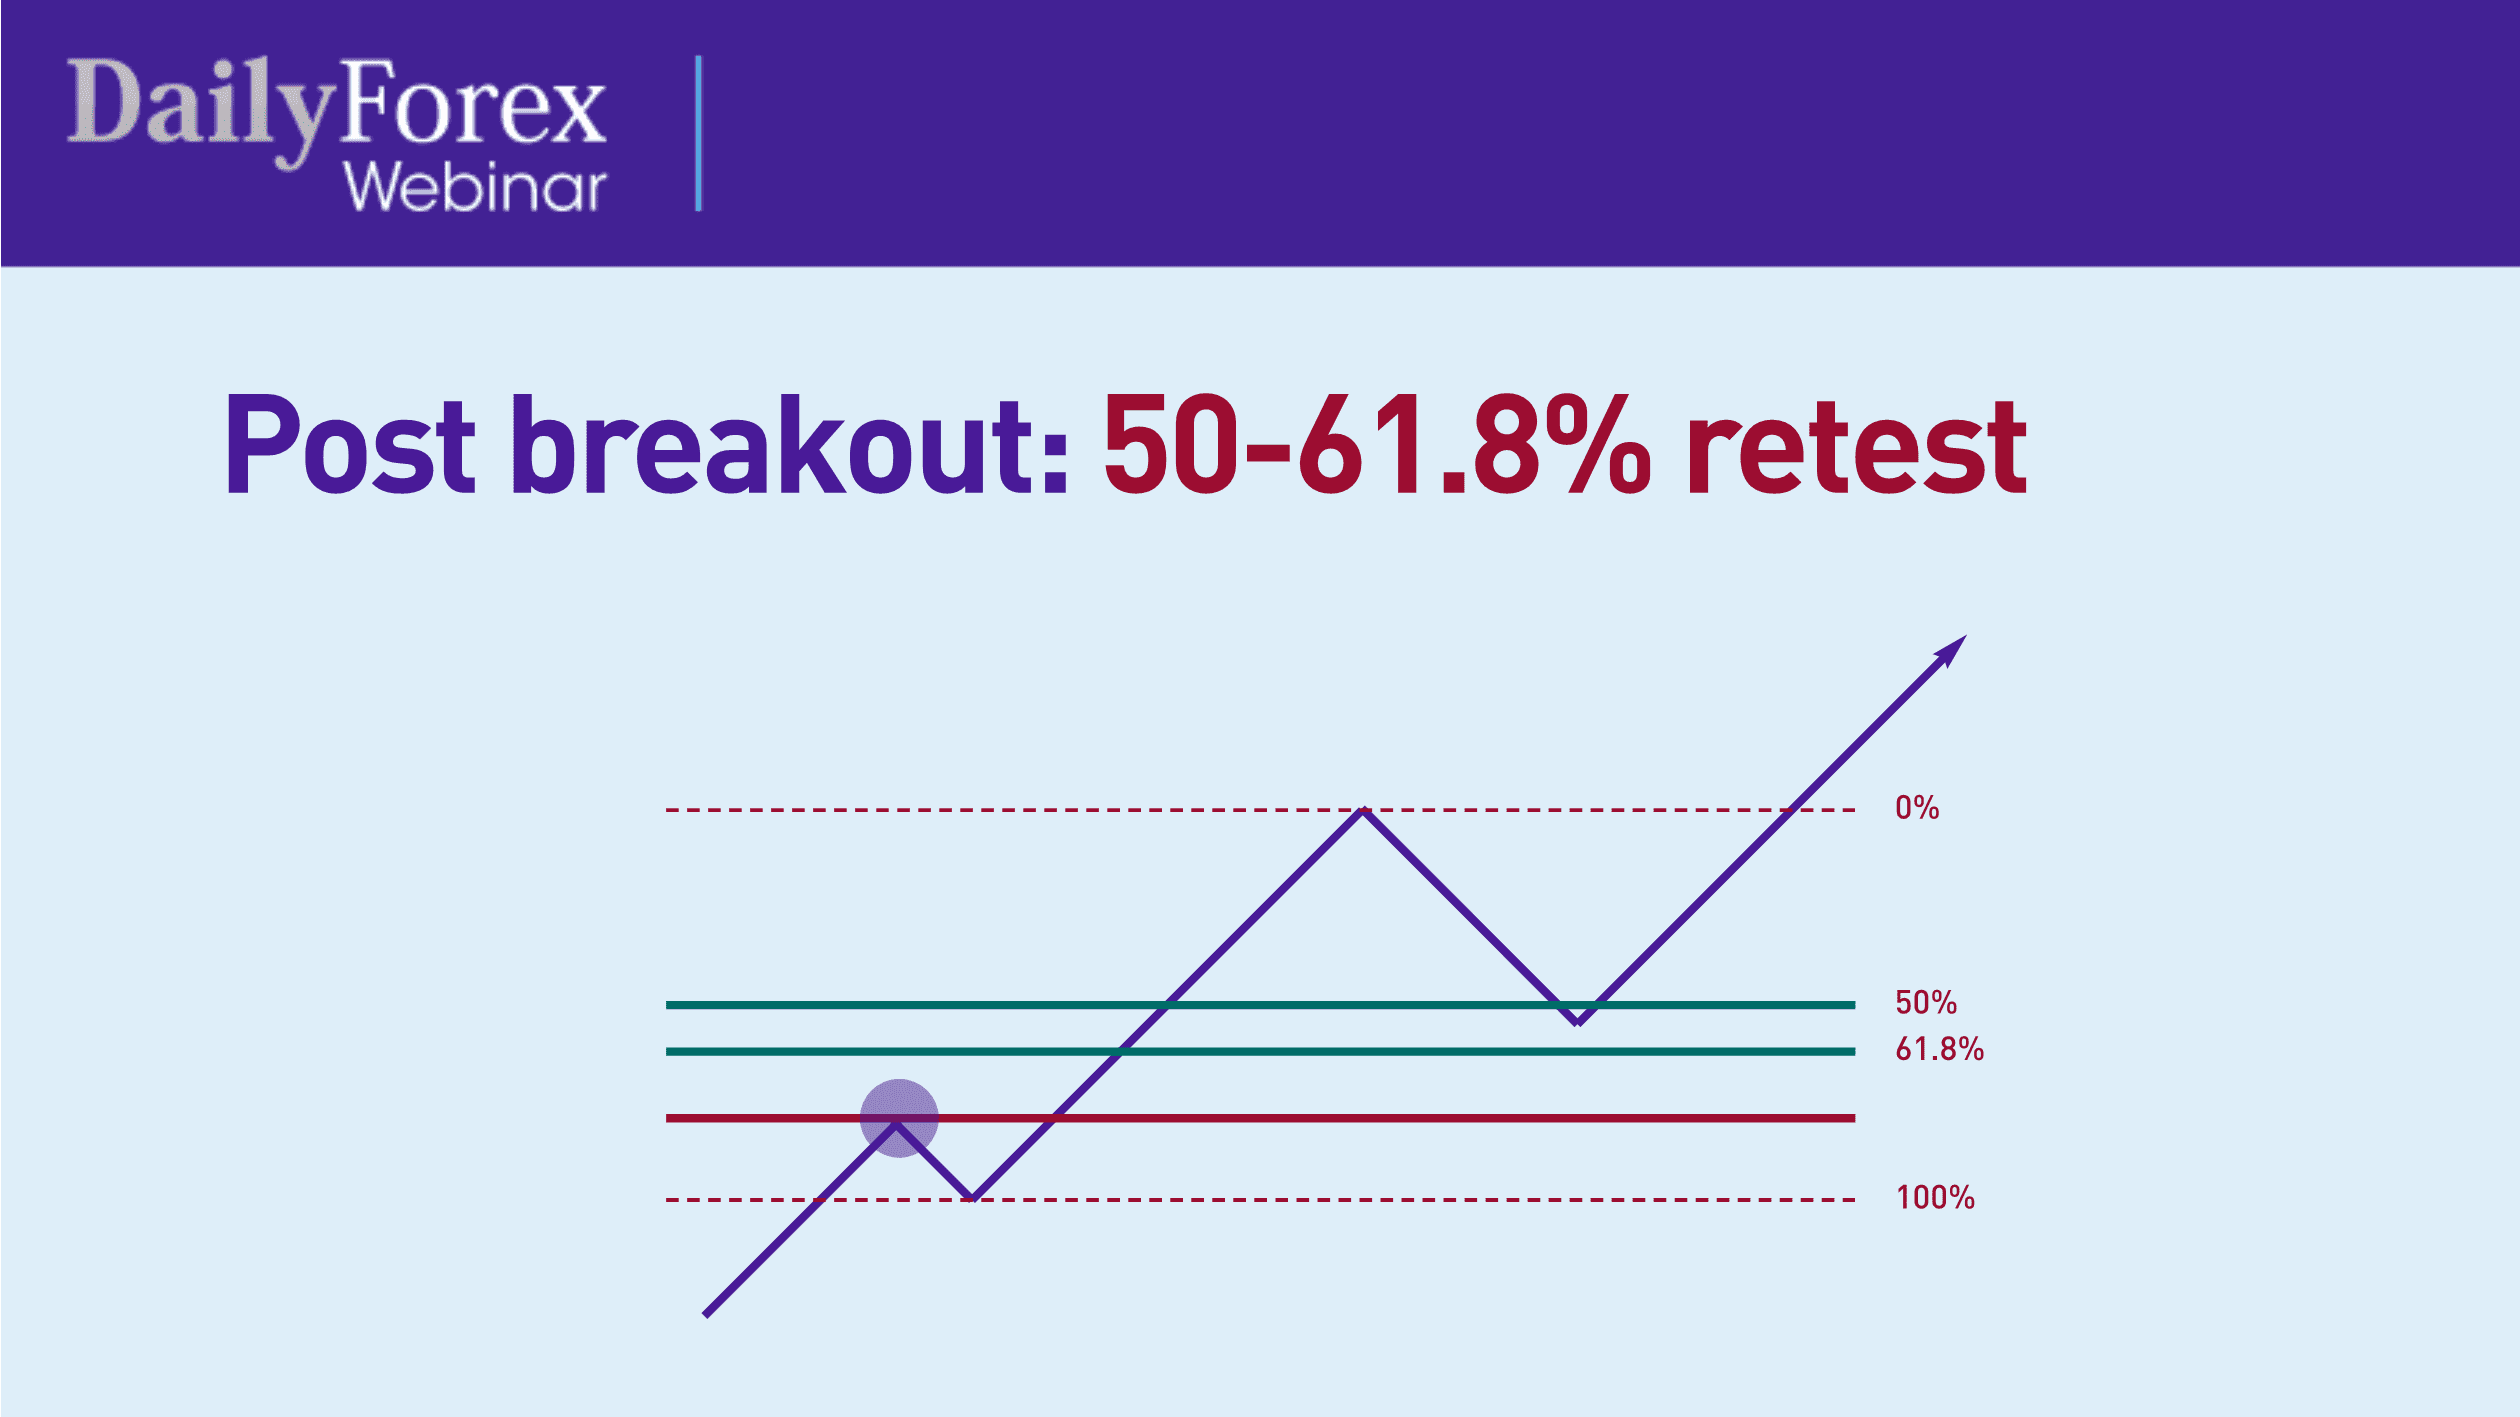
Another way of determining your entry post-breakout is by waiting for a Fibonacci re-test. I recommend waiting for the price to touch between the 50-61.8% levels, the latter being the main Fibonacci ratio, or the “golden ratio”.
In this diagram, you can see how the price has touched the resistance, retraced a bit and then broke out, retracing yet again to go between the 50% and 61.8% levels, or what I call the “entry zone”. Ideally, you want to see the price in the lower time frame bounce against the 50% level, either touching it cleanly or moving below it, and then continue moving up once you've had a chance to enter the trade.
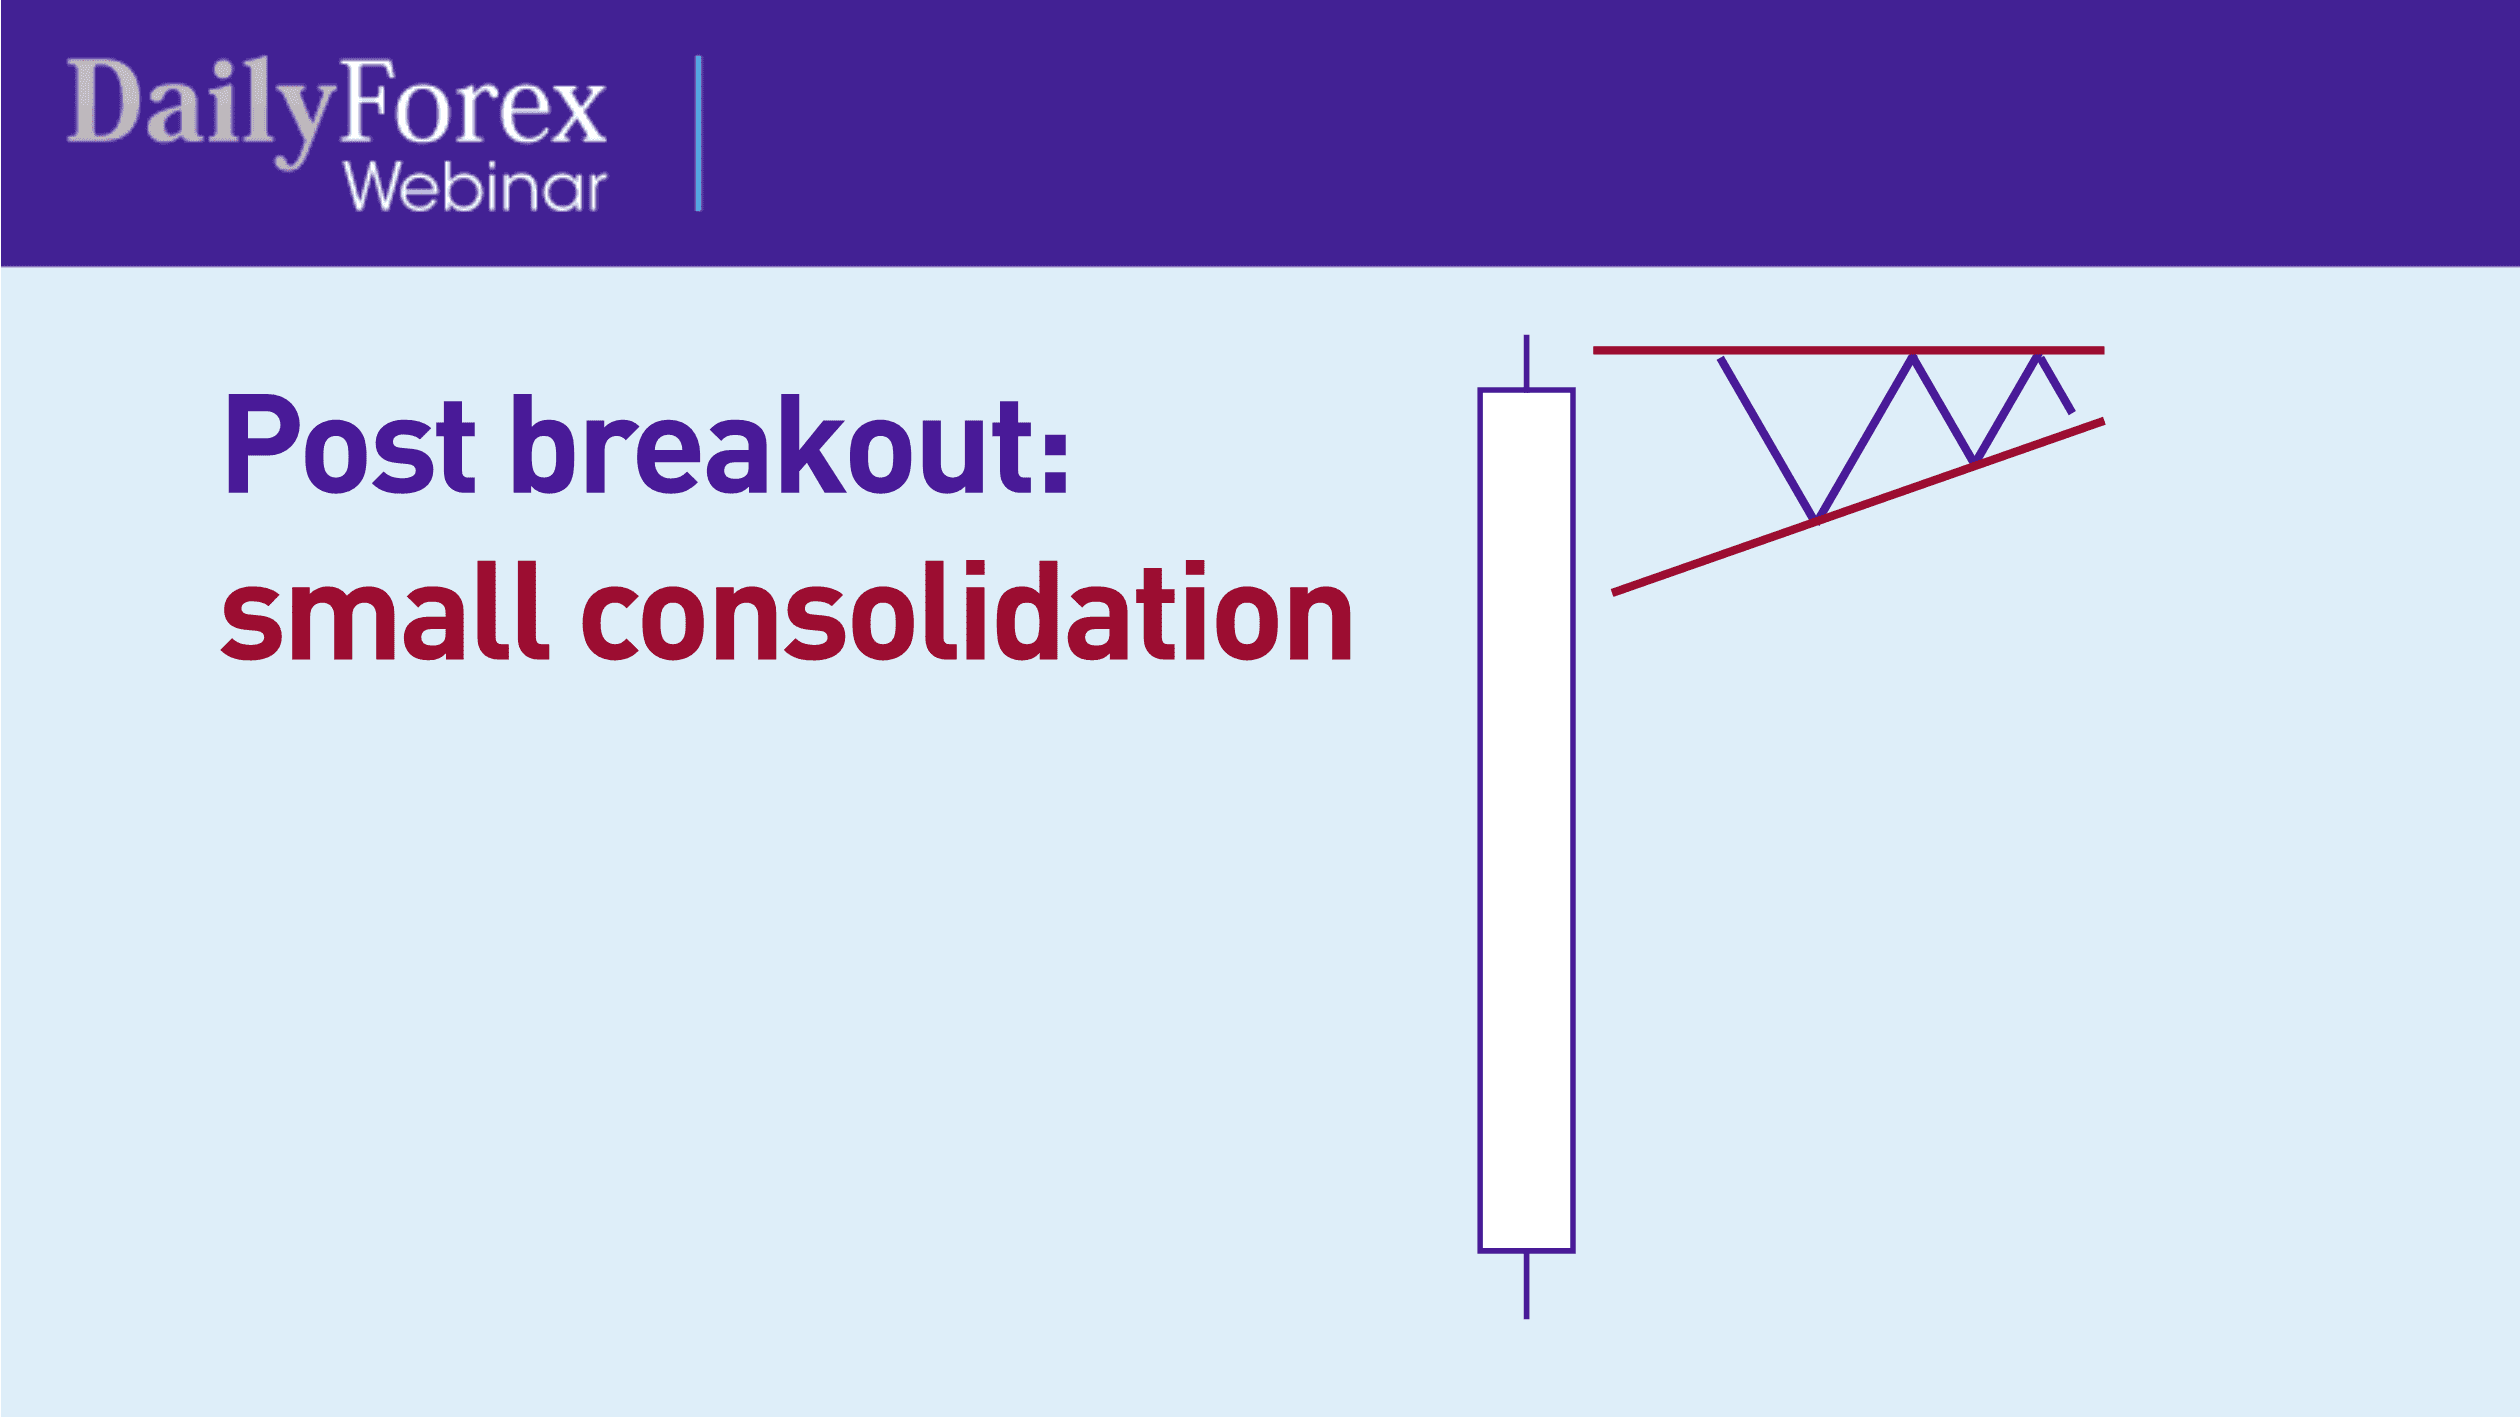
A third way to measure a breakout after it happens is to see a small consolidation in price. Say you've got a bullish candle, as shown here in the diagram below; you want to see the candle consolidate within that range and then get into that consolidation.
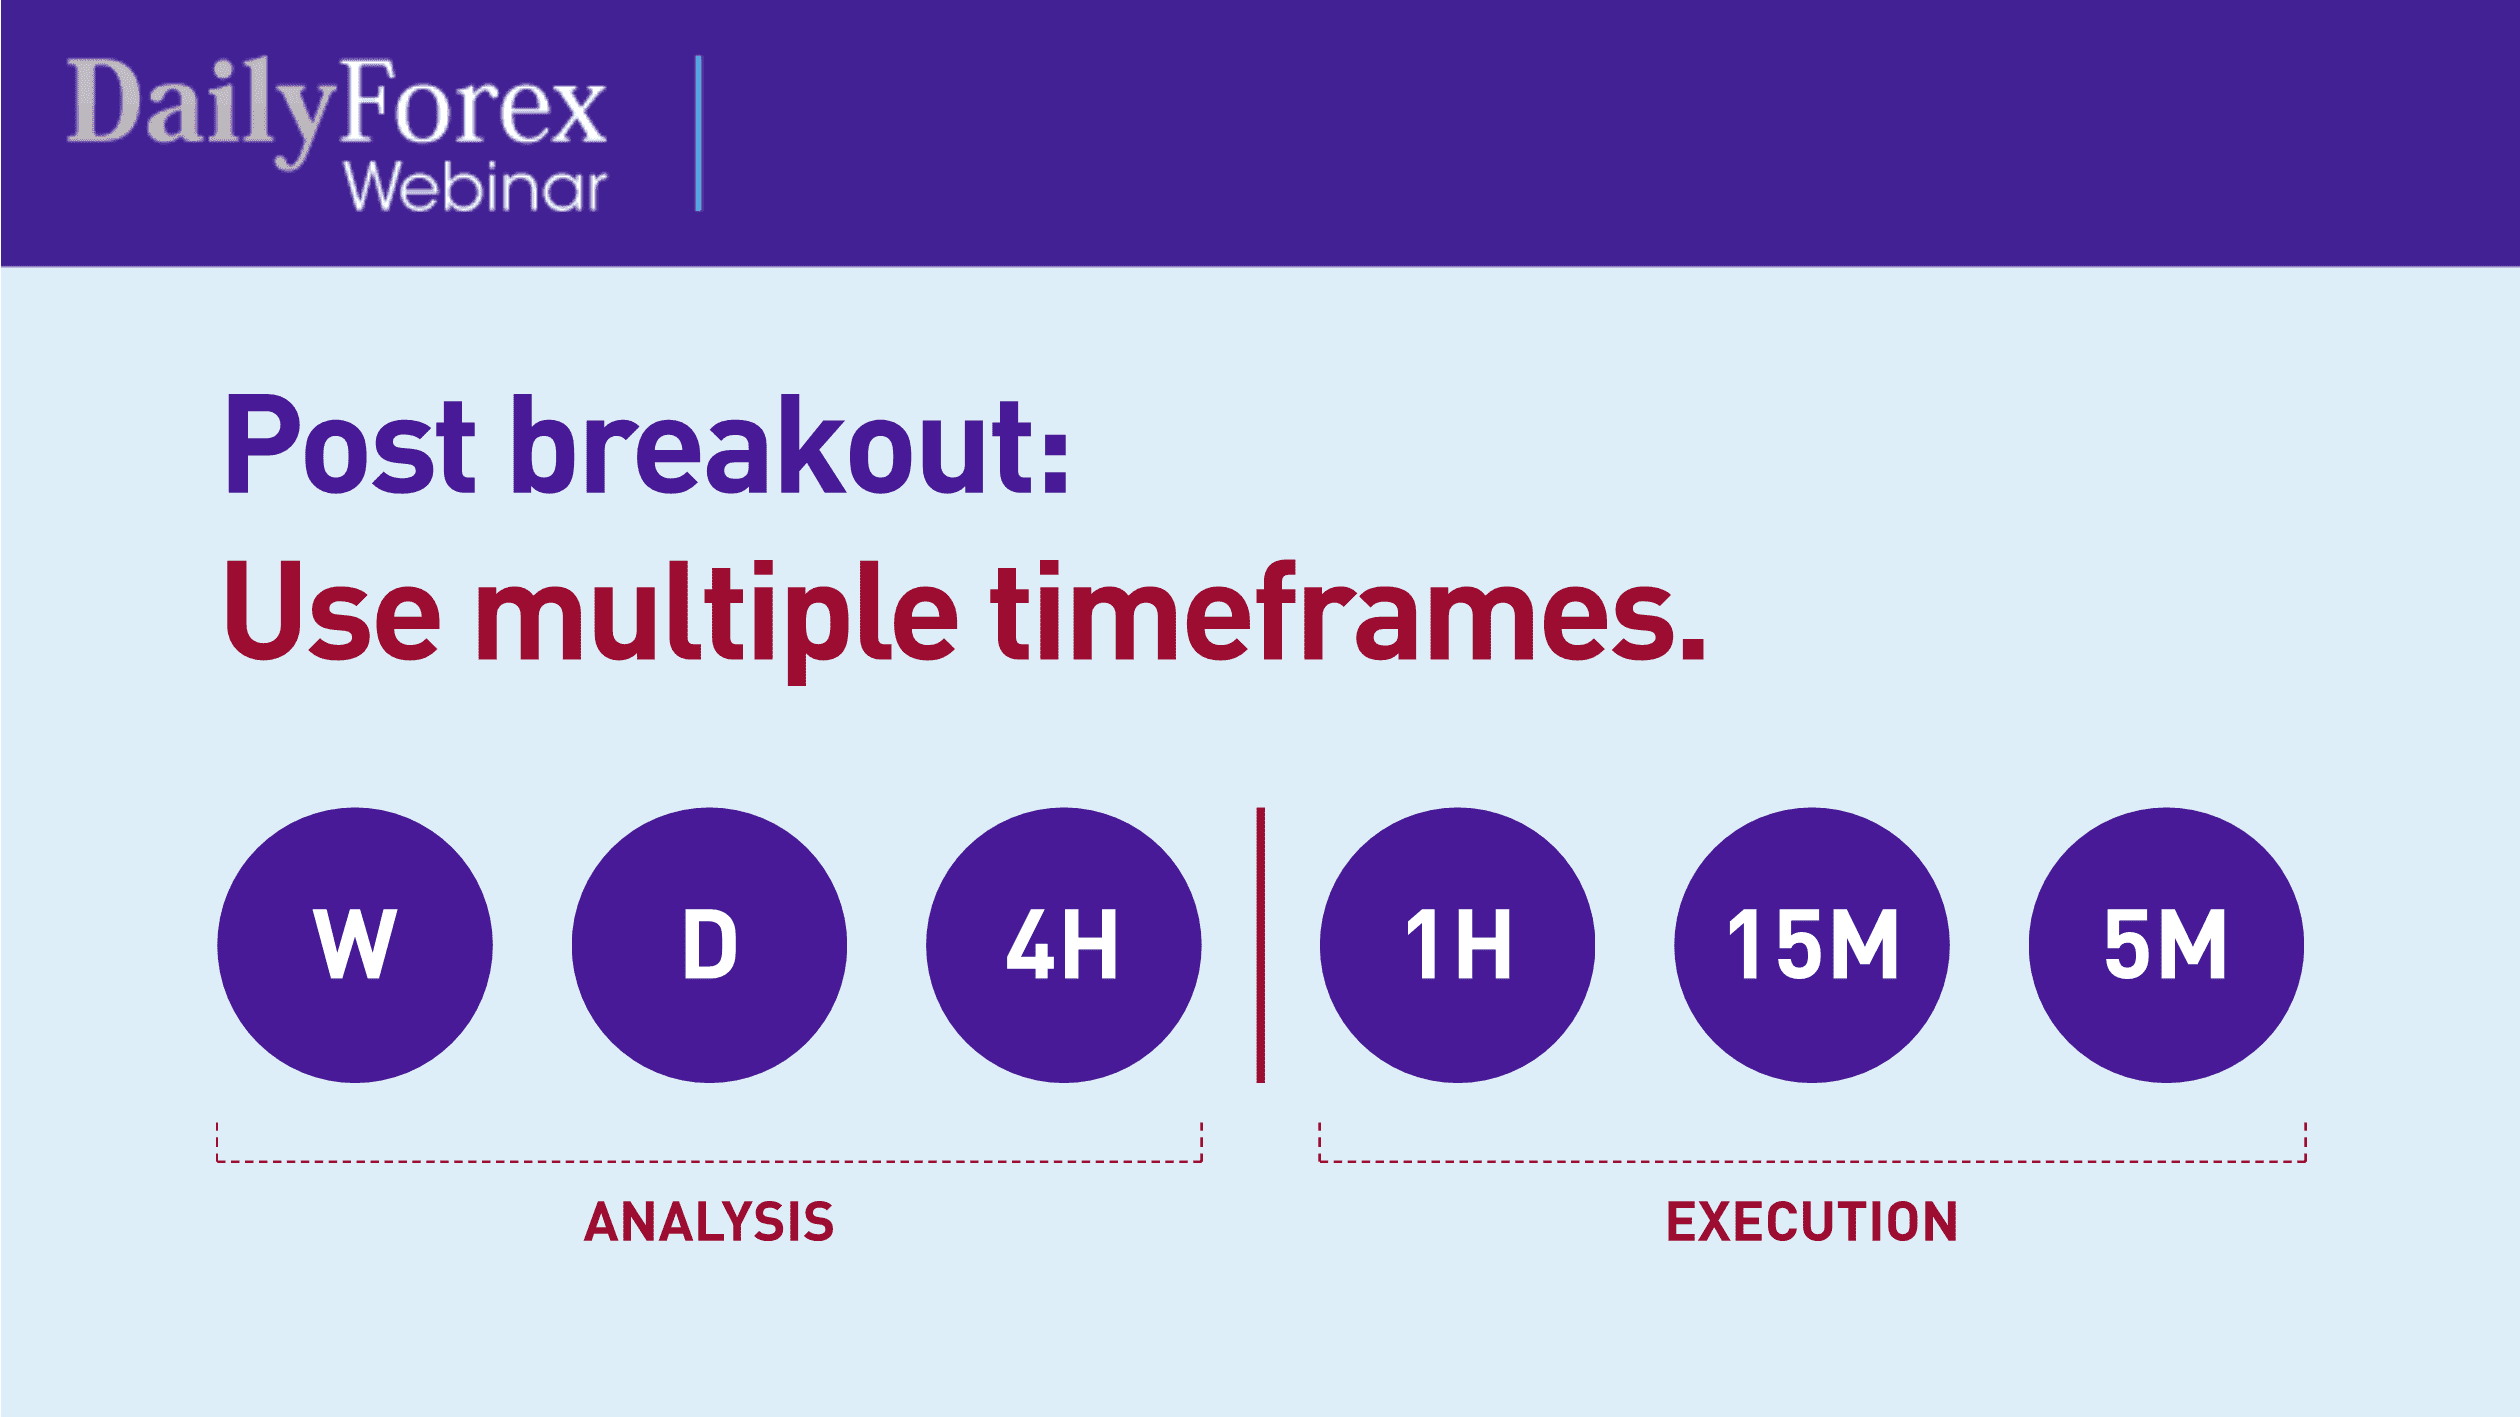
When you're looking at breakouts, you want to use multiple time frames. I draw an imaginary line between the higher time frames – the weekly, daily and 4-hour – and the lower time frames, namely, the one-hour, 15-minute and five-minute.
I typically use the higher time frames to conduct my analyses, and the lower time frames for my execution.
Now that we've discussed theory around breakouts, let's look at some charts to put it into practice.
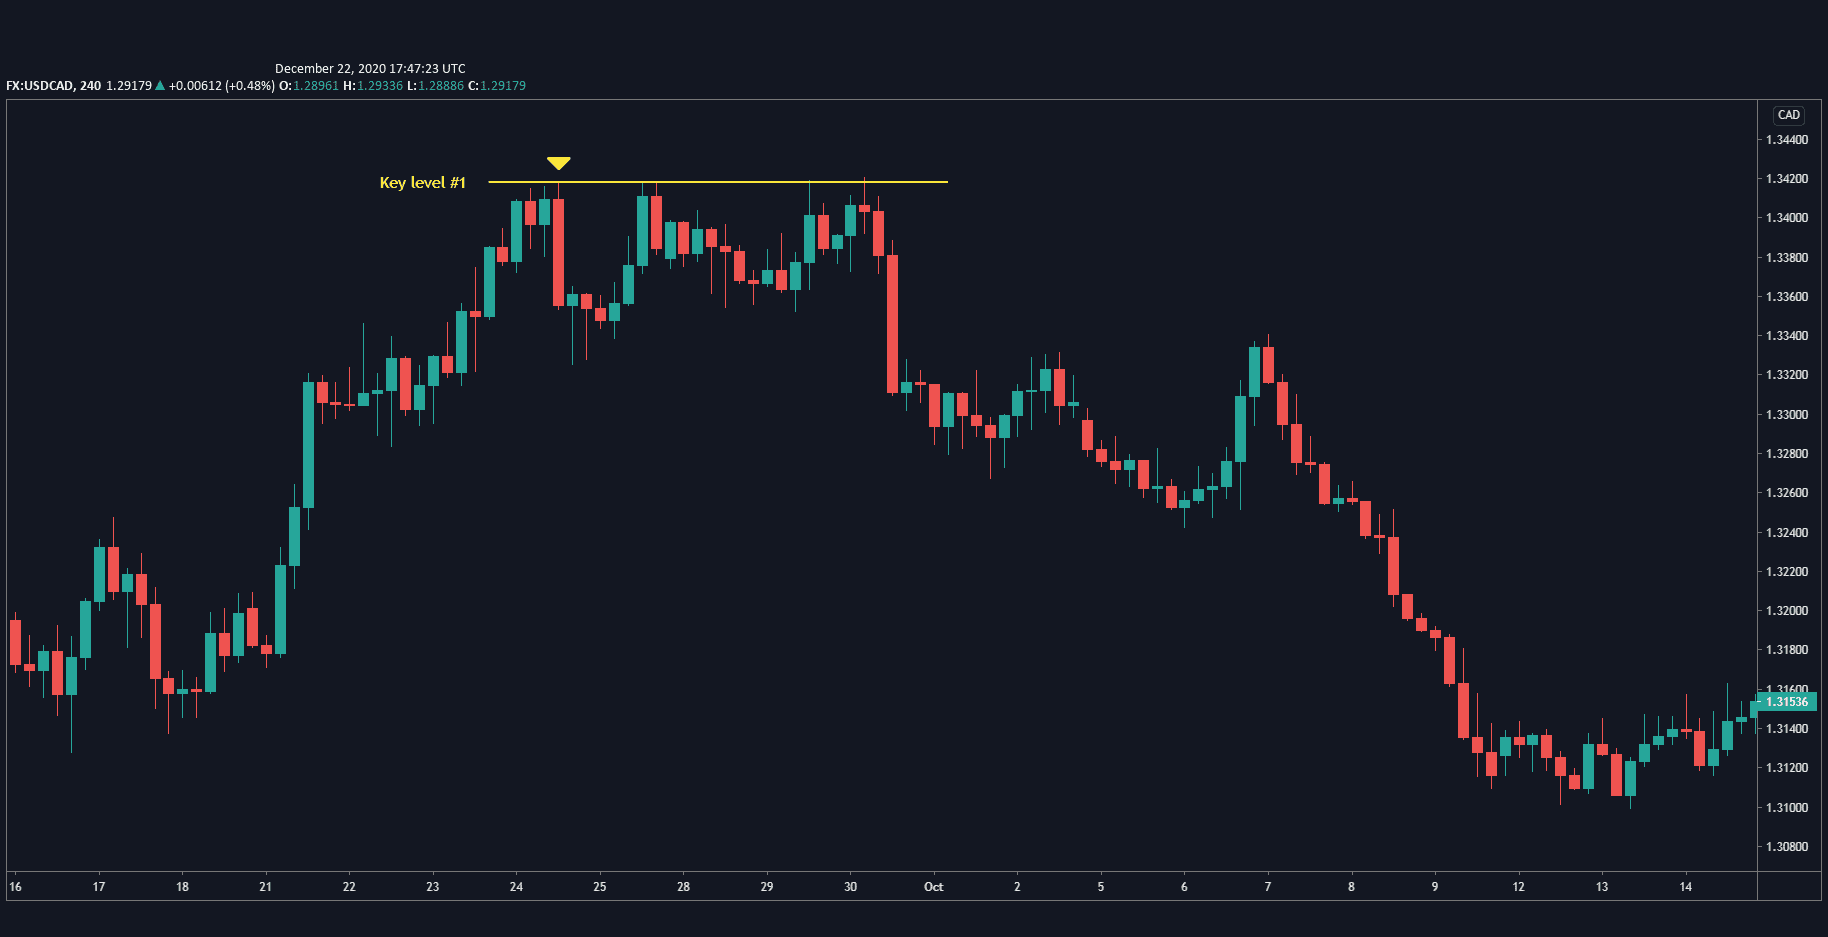
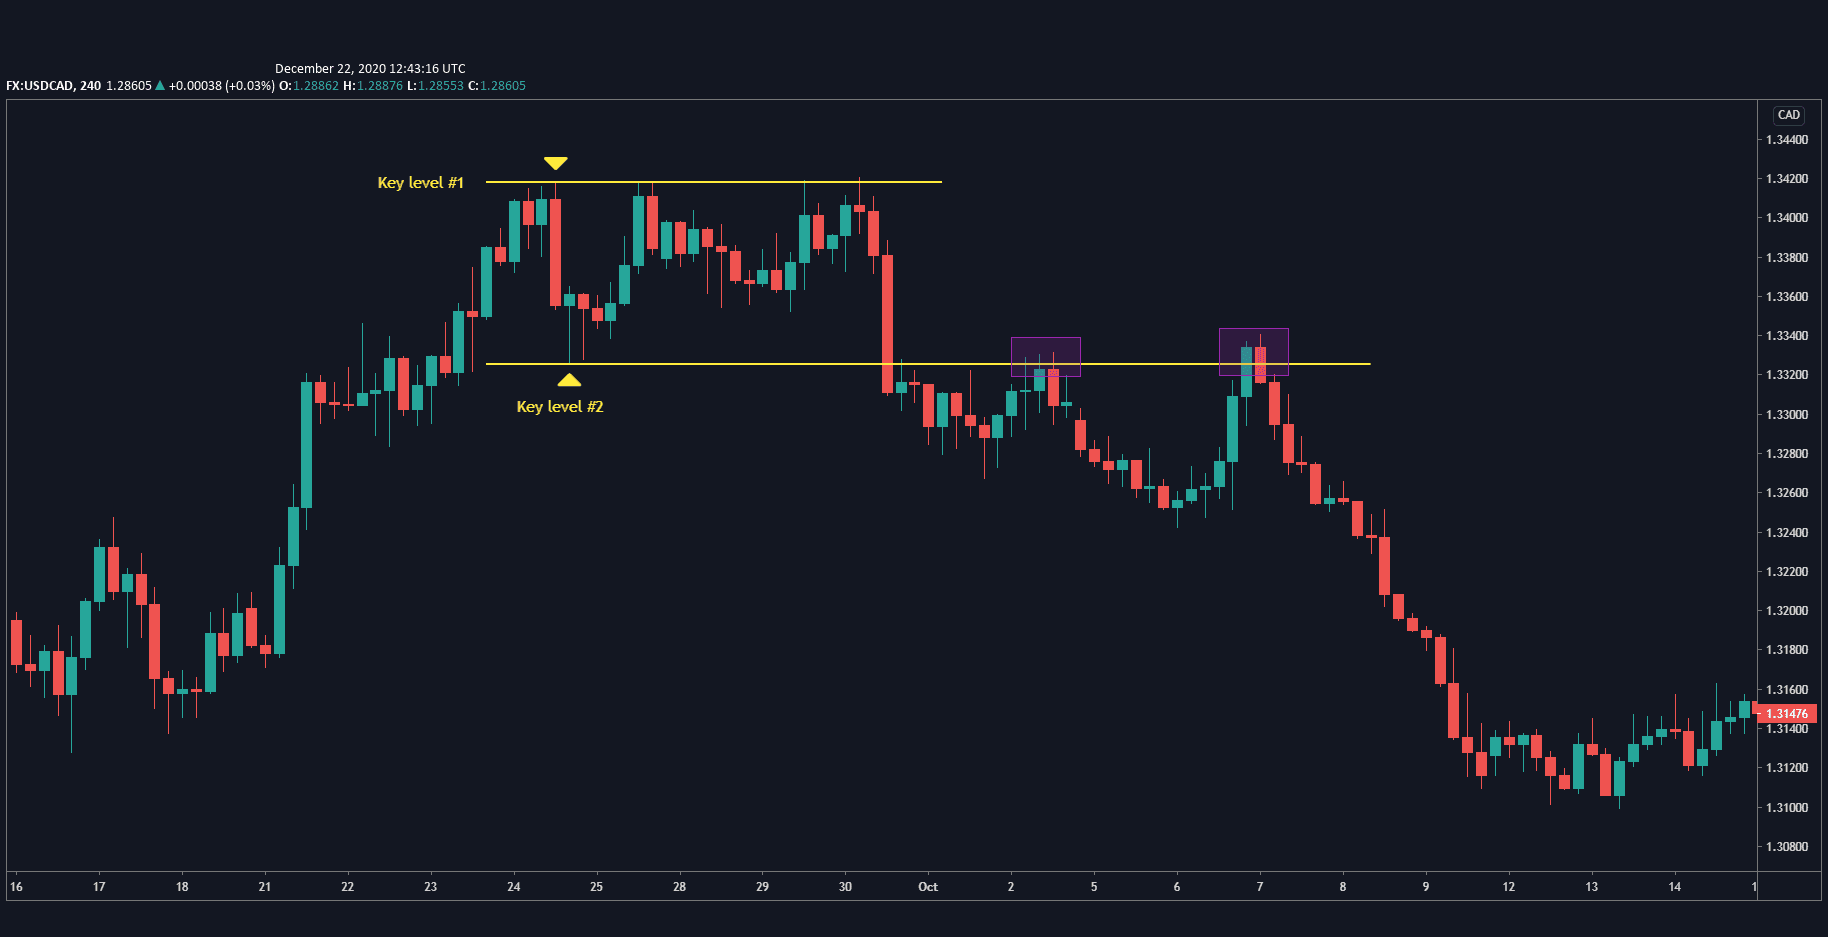
Here is the 4-hour chart for a USD/CAD trade I took:
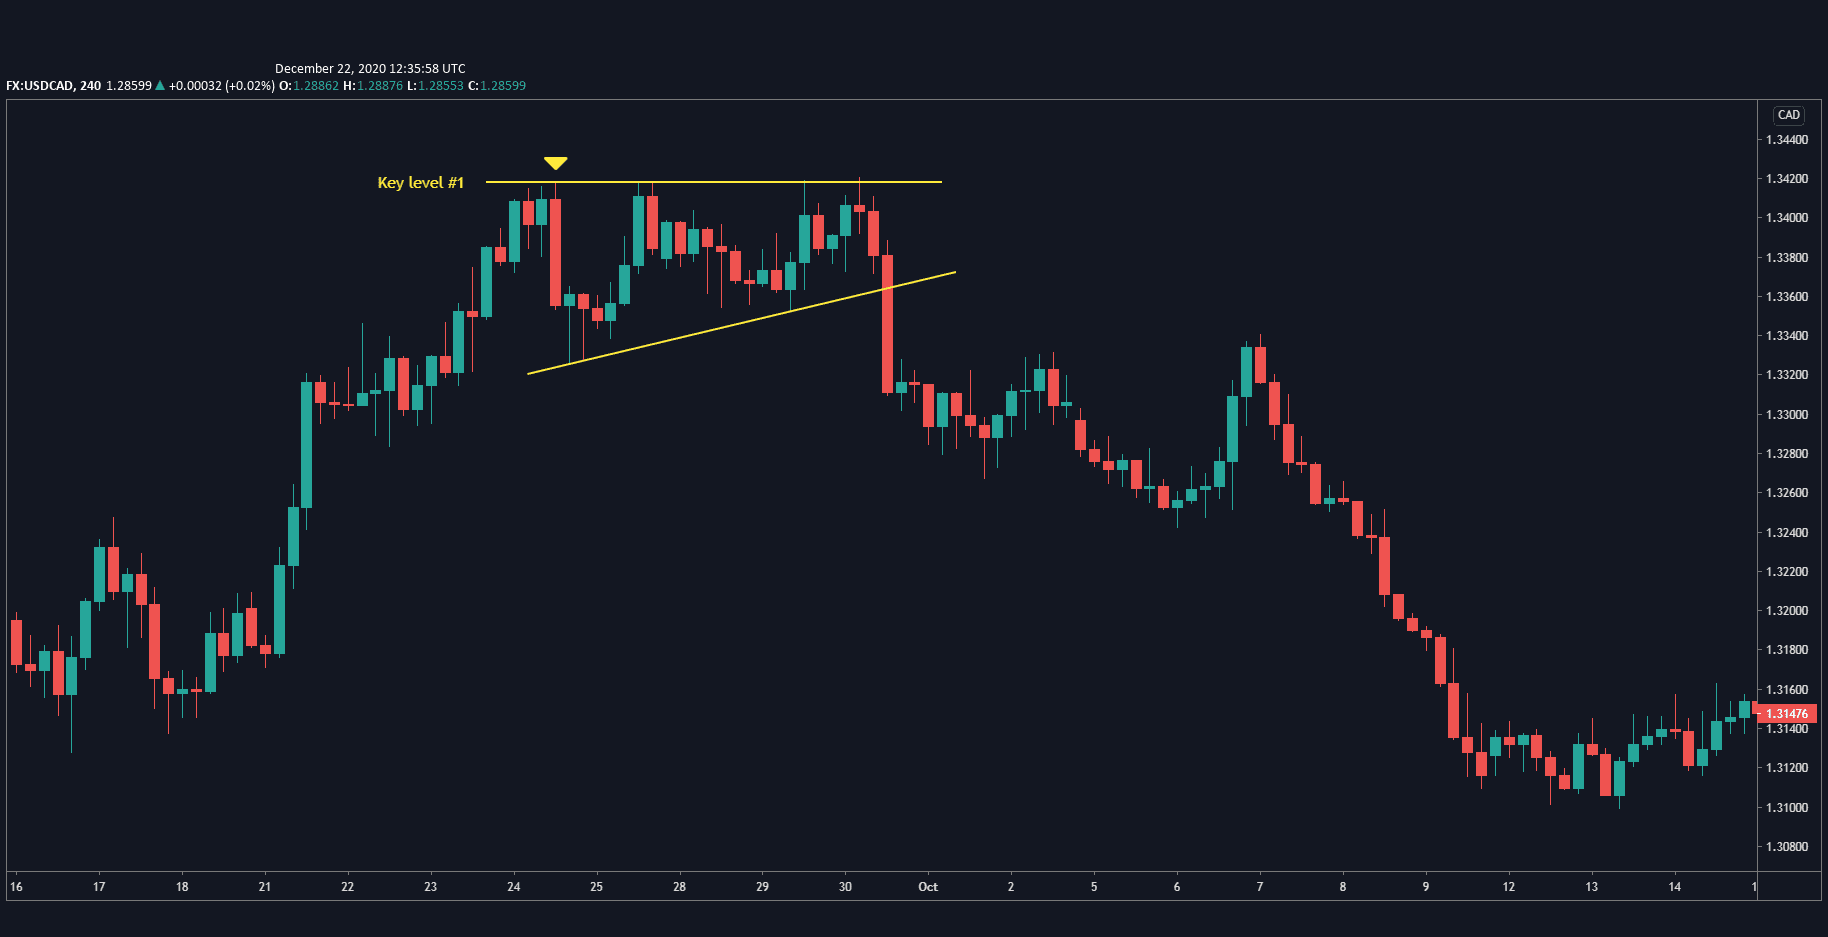
The price was trending up and made a key resistance level (as shown by the yellow line). I marked with an arrow where there was a big price reaction and the price dropped in one candle, taking out all the price action from the last two dozen candles. The price then retraced up to touch the level in four places. My expectation in this trade was that a bullish breakout candle would break above the resistance level, re-test it, and then continue going up, so I was going to buy the USD/CAD. I also noticed that the price was consolidating, as shown by the ascending yellow line, which makes an ascending triangle:
During the actual trade I had marked a support level here with this second yellow line.
As you can see, a bearish breakout candle broke through support, then came back and re-tested the level twice, as marked by the purple rectangles.
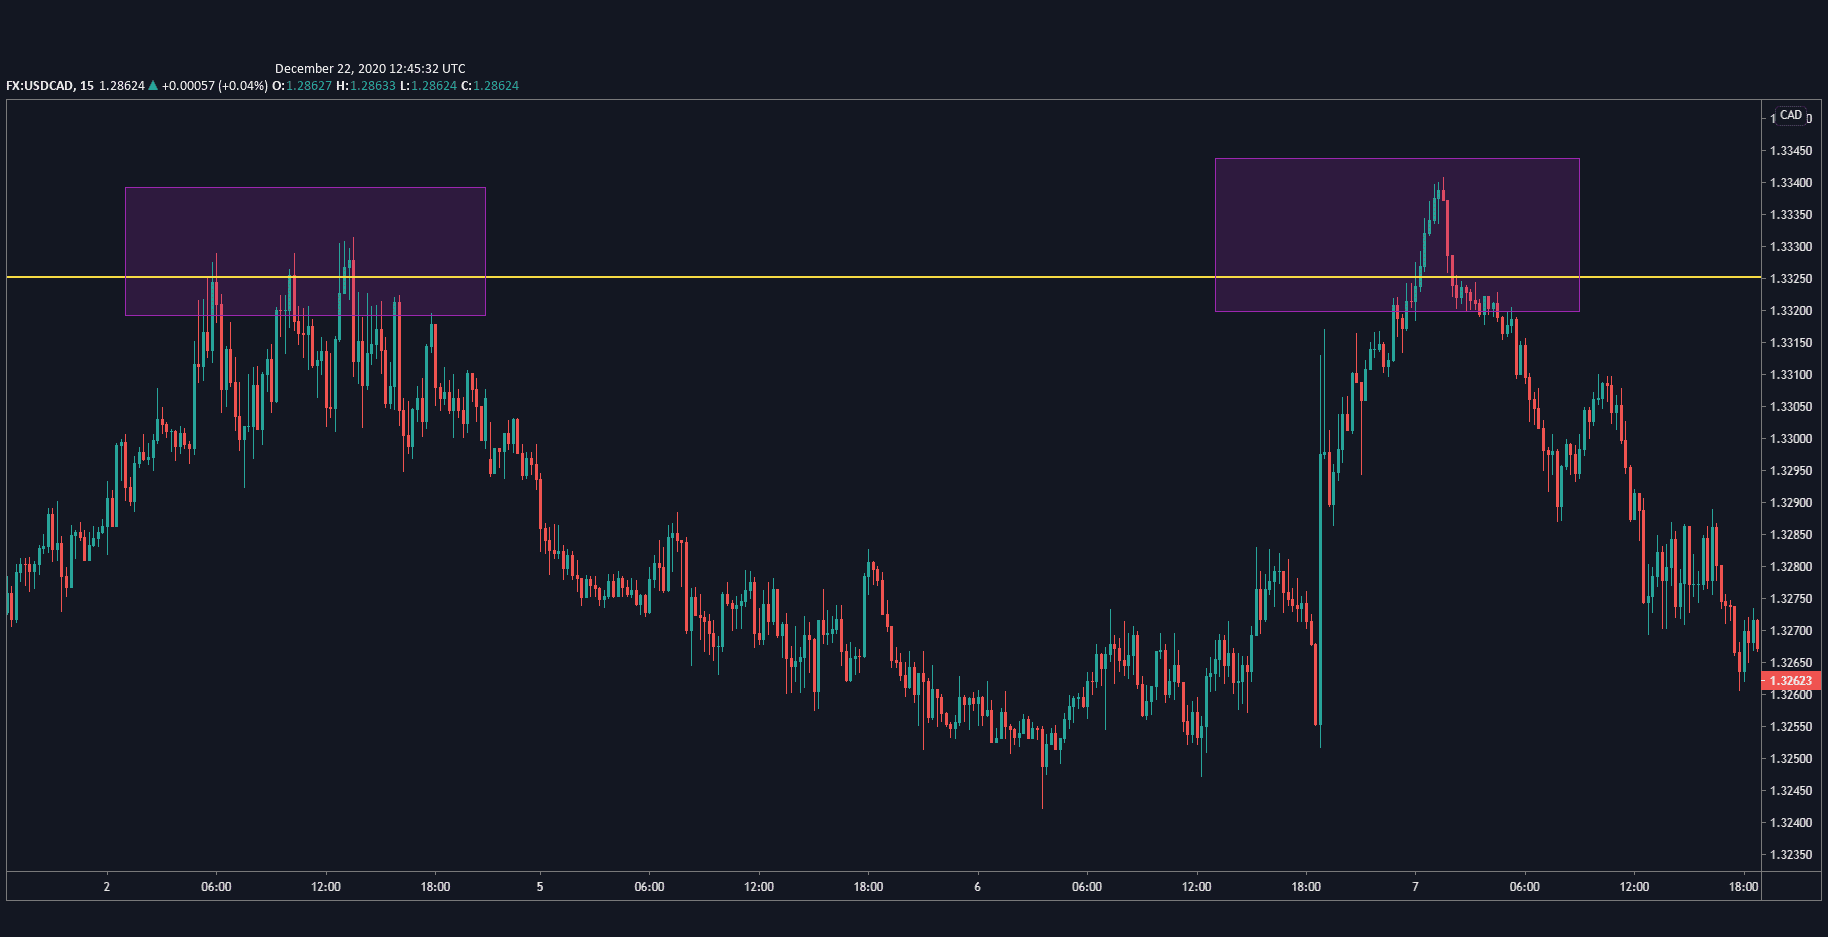
Of course, I didn't just study the 4-hour chart; I also studied the 15-minute chart, which I find to be a key chart for execution. It has enough detail so that I can find tight entries, but not so much detail that its cluttered with noise.
For our purposes, we'll look at the 5-minute chart, where you can see it broke through that key level three times:
After the second time, I found a nice, tight entry with a 1:1 ratio, meaning that I had one unit of risk against my stop loss, or in other words, my target was the same size as my stop loss.
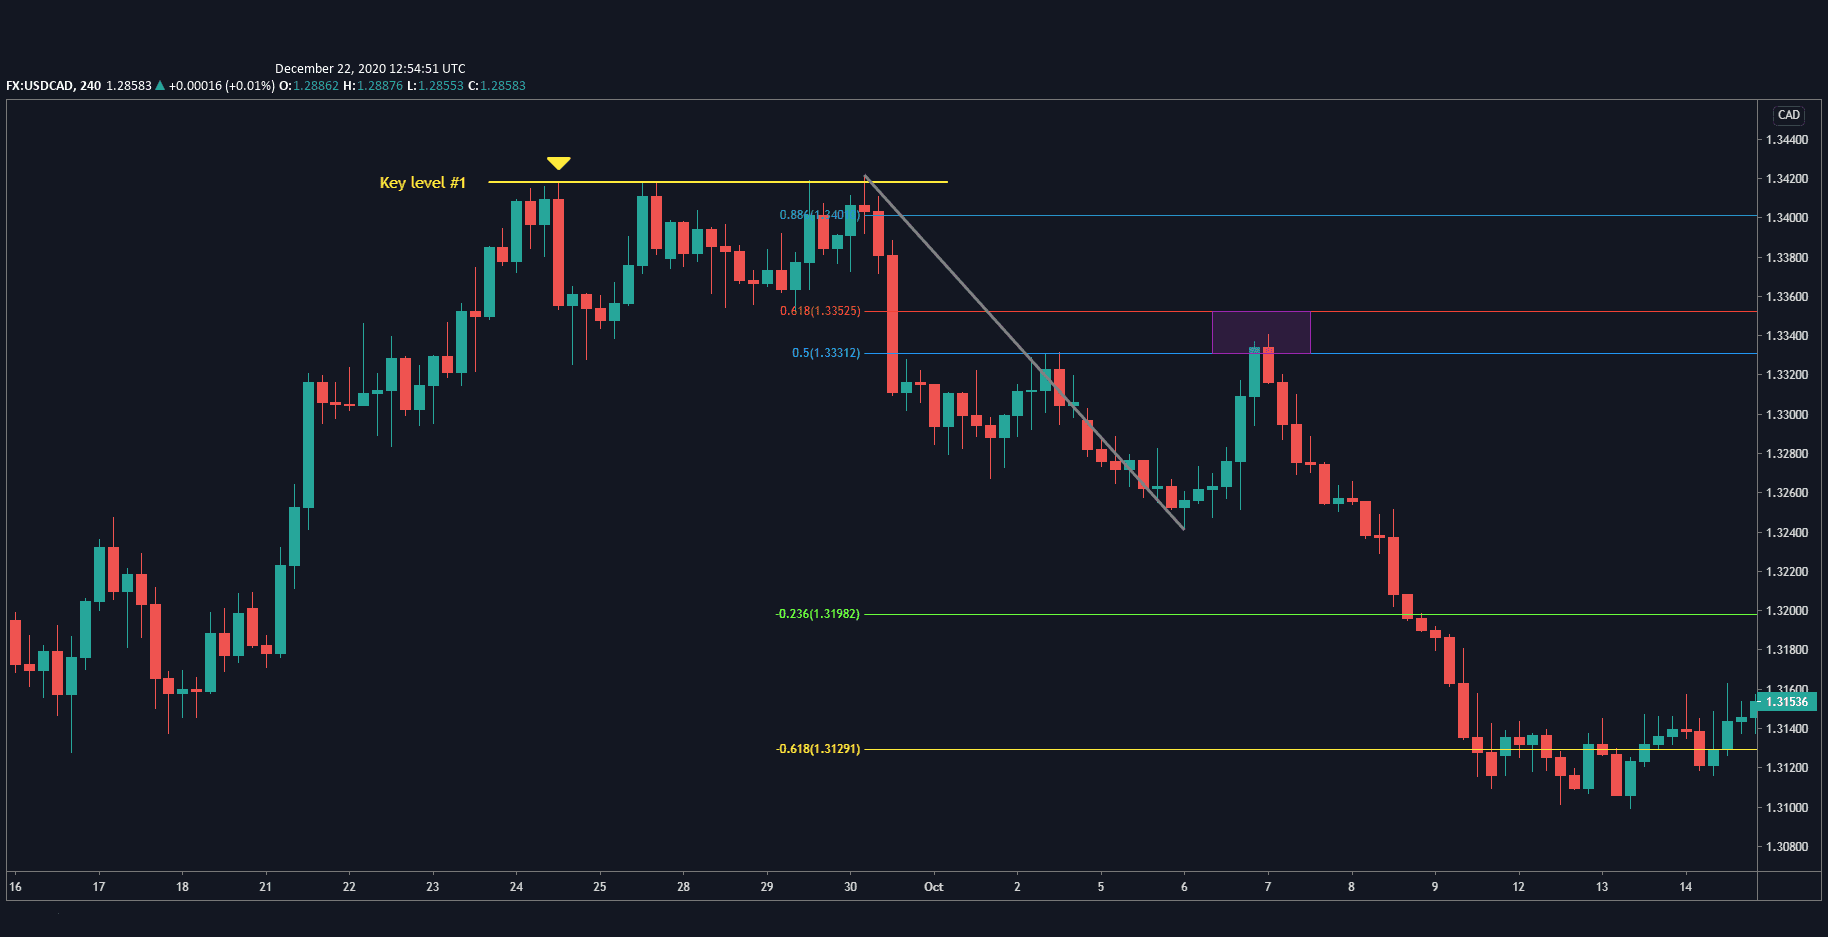
Now let me show you how you can apply the Fibonacci re-test method using the same 4-hour USD/CAD chart:
You can see how the price sat nicely between the 50% level (marked by the blue line) and the 61.8% level (marked by the red line).
What's great about this chart is that it has confluence, which means that it has multiple confirmations of the trade. In this case, that confluence takes the form of the Fib level lining up quite nicely with the second key level I marked earlier.
Looking lower on the chart, you'll see that -23.6% and -61.8% were my first and second targets.
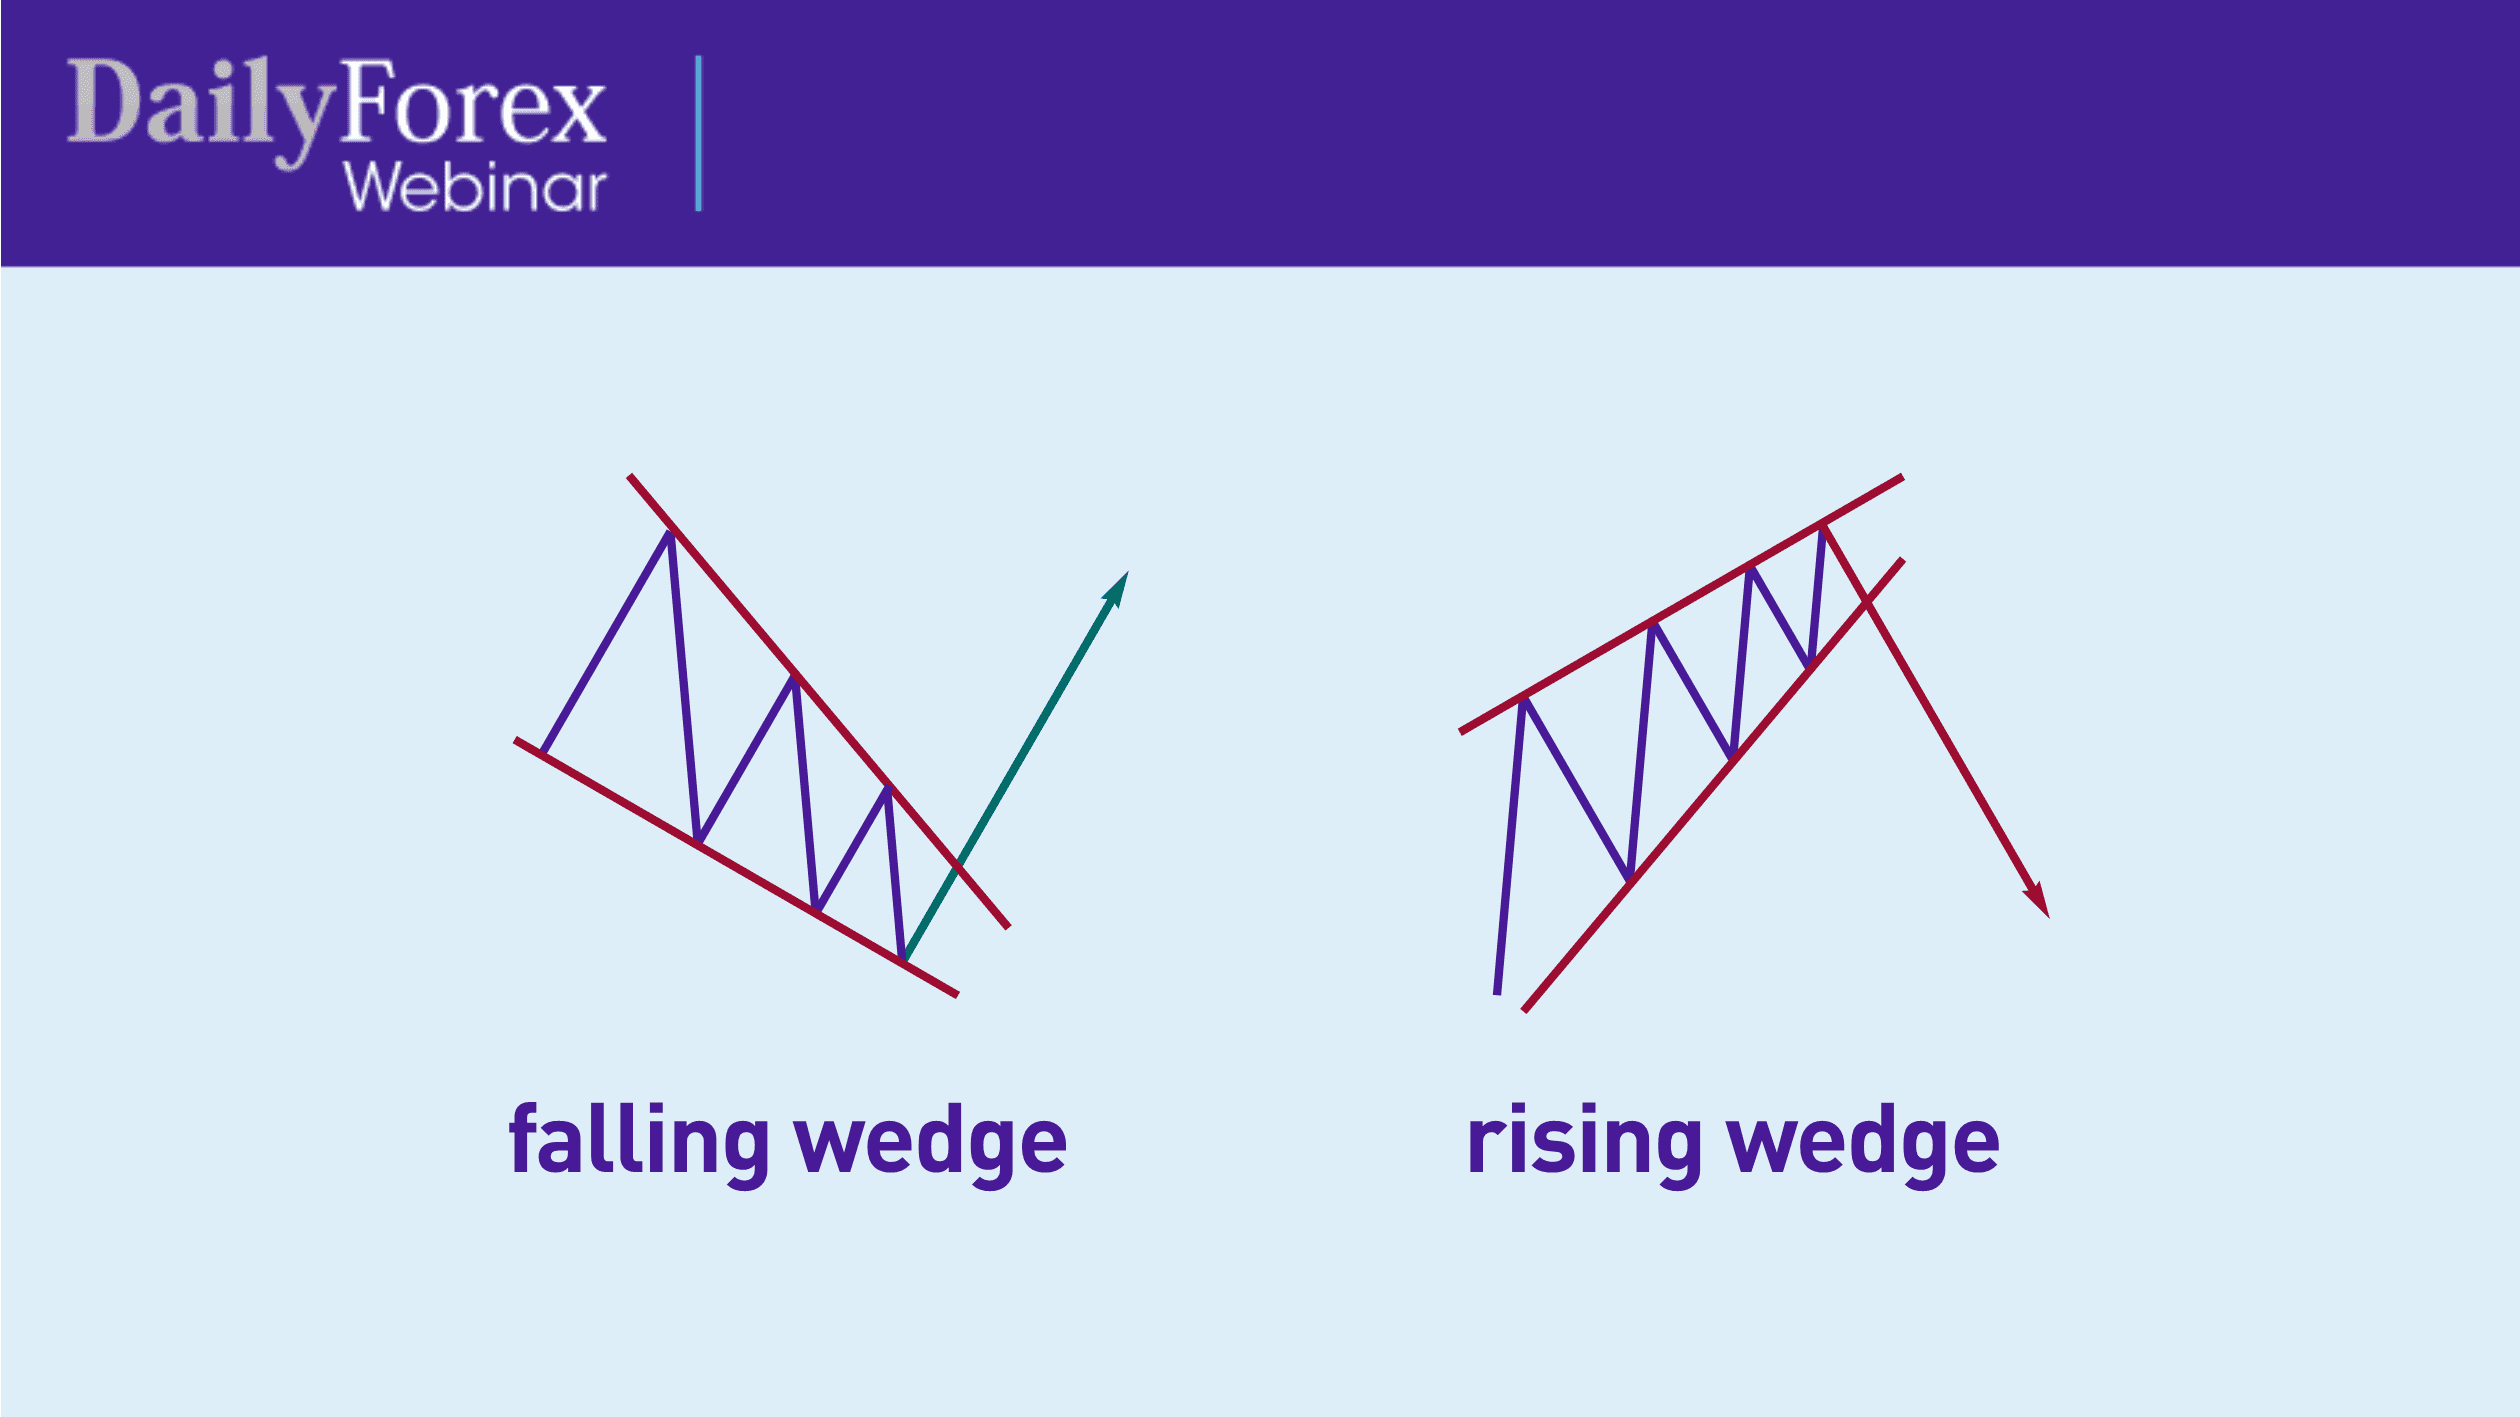
One more thing you should know about regarding breakouts is the concept of wedges, as shown in this diagram.
Unlike triangles, wedges are more angled patterns, where you still have a price contraction but the pattern also has an angle, usually described as a “falling wedge” or a “rising wedge”. Counter-intuitively, a falling wedge means you can expect a bullish breakout, whereas a rising wedge means you can expect a bearish breakout.
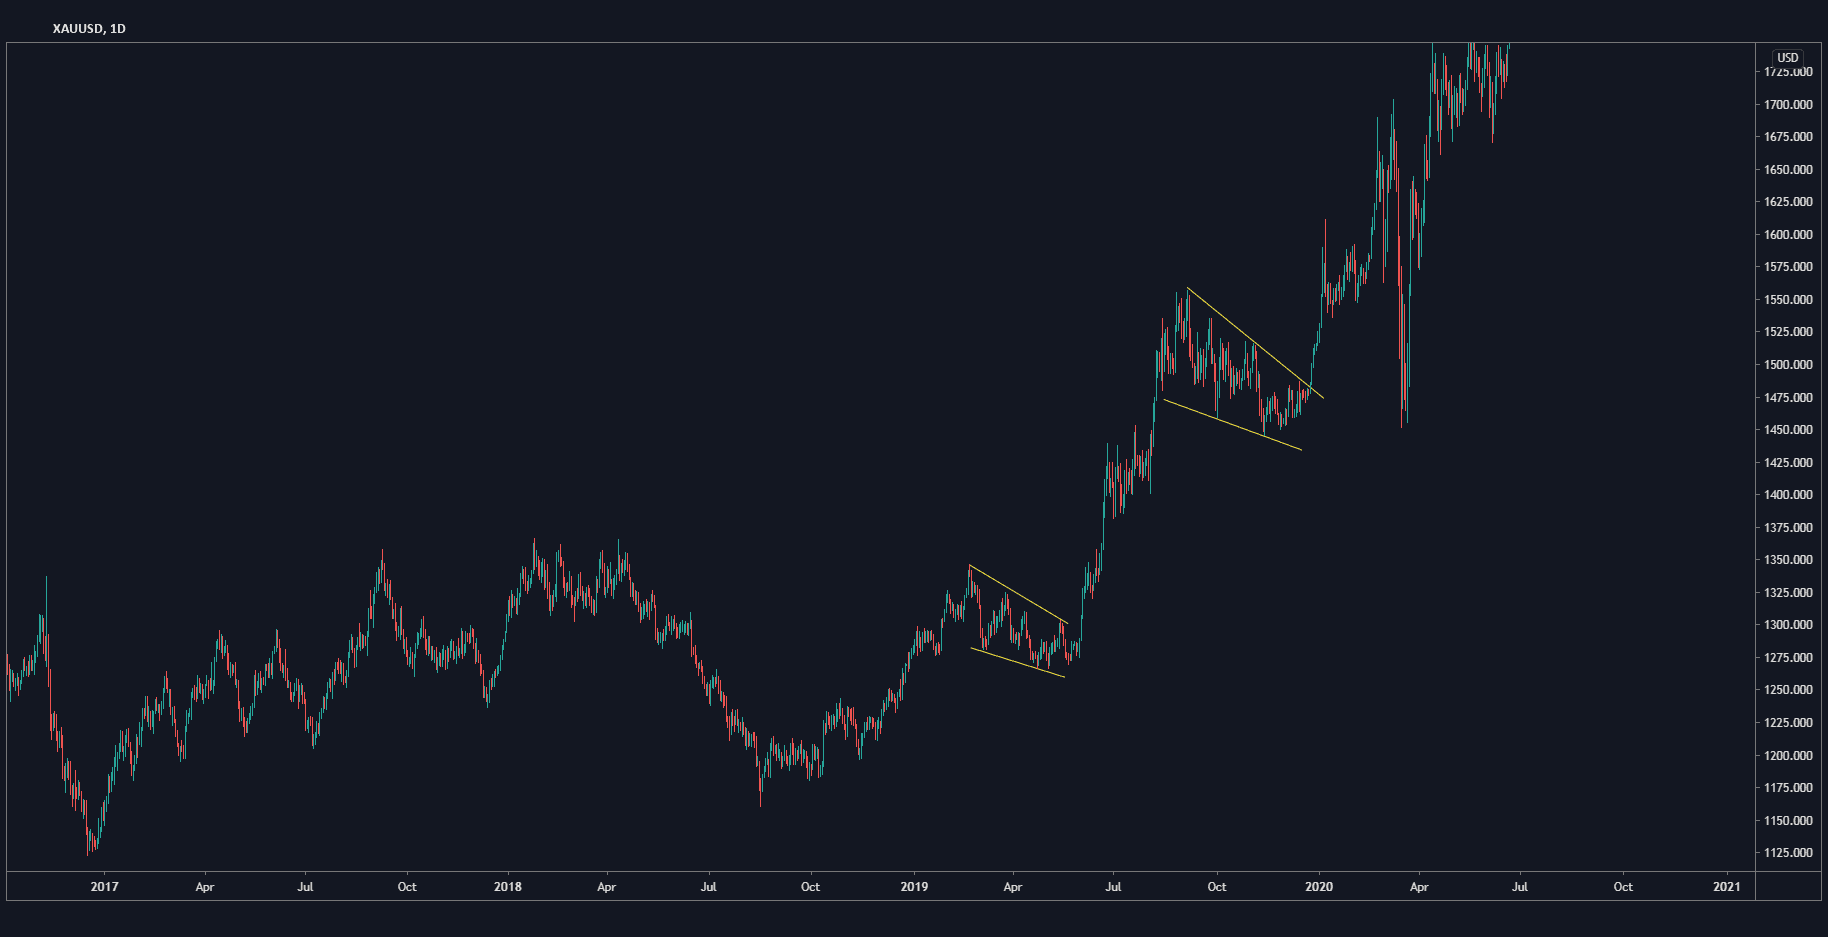
When I see a wedge, I tend to just jump in on the trade after the breakout and not wait for a re-test or retracement. Let's take the daily chart for gold as an example.
You can see how both wedges didn't really experience a retracement, rather they just had huge breakouts and kept moving up.
An important note: mind your risk. Never risk more money than you can lose and always set up a stop loss. You don't want to blow out your whole account on a single trade.
Lastly, if a chart isn't clear, stay away from it. Wait for the chart to become clear, find a chart on a different time frame or find a different trade altogether. If you're really having to stare at the chart to see if there's a breakout, or a consolidation, or a key level, then move on.
Like what you've read? Check out our other webinar recap on Trading Supporting and Resistance here!

