There are countless ways to trade financial markets, but many traders favour the Heikin-Ashi indicator as a fundamental part of their technical trading strategies, and for good reason. This educational article will delve into the intricacies of the Heikin-Ashi indicator, including its mathematical background, advantages, disadvantages, trading strategies and uses within a trading plan.
What is the Heikin-Ashi Indicator?
A Japanese rice merchant invented the Heikin-Ashi candlestick chart in the 1700s, who is often regarded as the father of the modern candlestick chart we know today. Heikin-Ashi directly translates to "average bar" in English, reflecting its purpose as a candlestick that averages out traditional candlestick movement. As opposed to conventional candlestick charts that utilise high, low, open and close (HLOC) as a structure base, the Heikin-Ashi candlestick chart incorporates these four elements built into a modified formula that eliminates noise/clatter on the chart. The exact mathematical formulae are outlined below:
Heikin-Ashi Formulae:
High = Max (High0, Heikin-Ashi Open0, Heikin-Ashi Close0)
Low = Min (Low0, Heikin-Ashi Open0, Heikin-Ashi Close0)
Open = ((Heikin-Ashi Open-1) + (Heikin+Ashi Close-1))/2
Close = (Open0+High0+Low0+Close0)/4
where: Open0 = Current period figure
Open−1 = Prior period figure
Averaging both prior and current figures allows for the unique formation of the Heikin-Ashi candlestick relative to conventional candlestick charts, which facilitates the optionality of an alternate lens to view and interpret an asset.
Top Forex Brokers
Constructing the Heikin-Ashi Chart
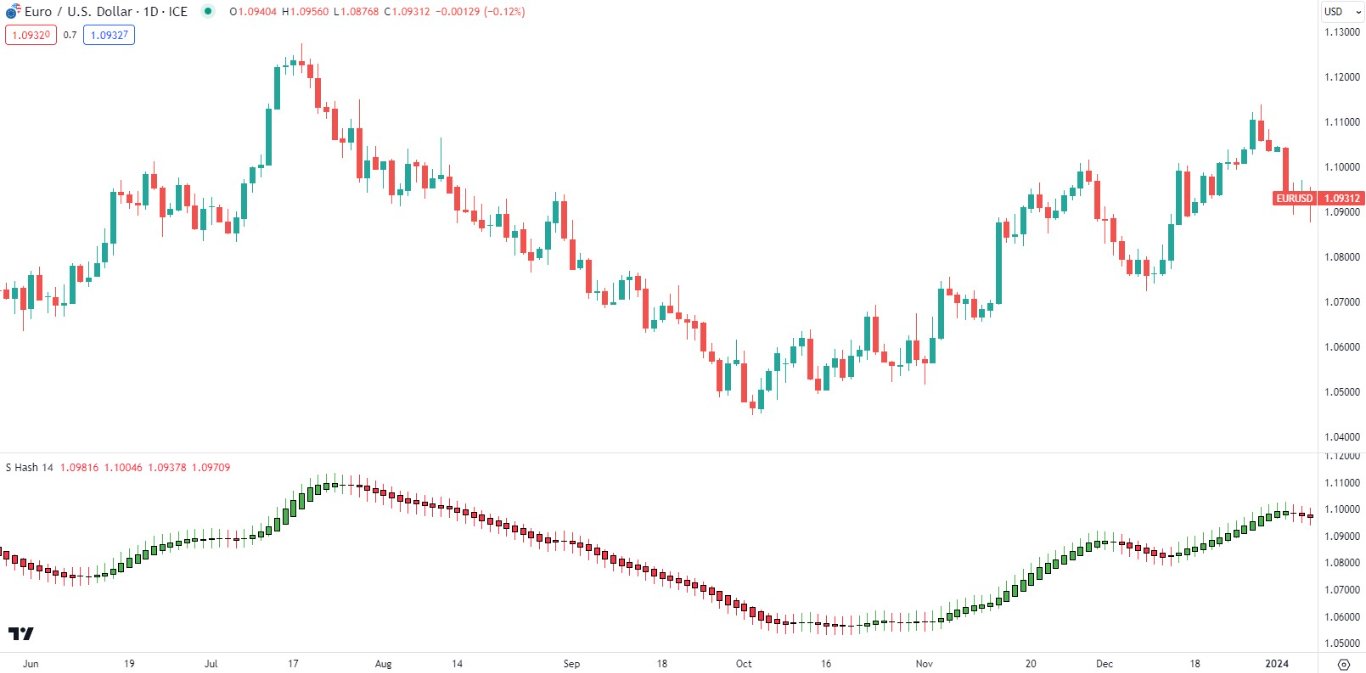
Comparing the Heikin-Ashi chart to a traditional price action candlestick chart (refer to the chart below) displays the subtle modifications resulting from the formulae above. Traditional charts tend to show a more frequent and erratic dispersion of red (close < open) and green (close > open) candles – even within a trending environment. These interjections can often lead to false signals for traders. Still, with a smoother, less 'noisy' chart (Heikin-Ashi), it can be easier to understand the price movement for better trading decisions. As a result, trend identification will be less complex and can lead to a superior trading strategy.
Heikin-Ashi Indicator Signals
The Heikin-Ashi can be used as an alternate method to identify a trend. There are three simple rules to follow when applying this indicator:
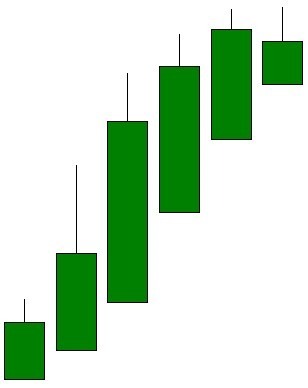
Uptrend:
- Large bodies
- Consecutive green candles
- No lower wicks
Downtrend:
- Large bodies
- Consecutive red candles
- No upper wicks
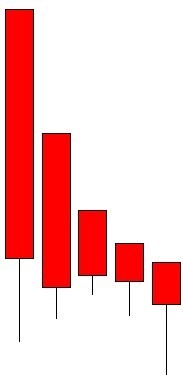
Large bodies suggest trend strength, and the lack of a wick (resulting from the formula) indicates a strong trend. On the contrary, doji candlesticks, or the presence of a wick above or below the body opposing the current trend, may imply hesitancy by the market, after which price action may change direction.
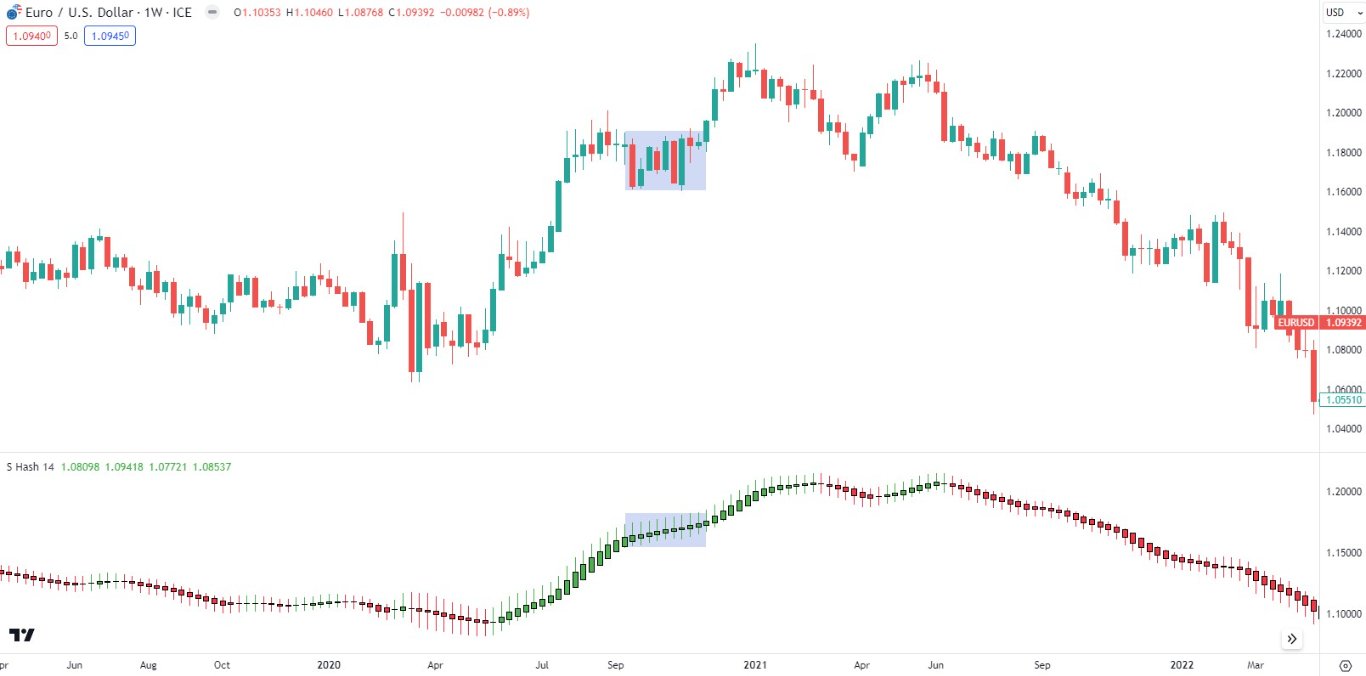
The graphic below shows the corresponding sideways price action in the presence of doji candlesticks on the traditional chart. The appearance of the doji/candle wicks in the opposite direction tends to either result in a continuation of the prior trend or a trend reversal.
What is the Heikin-Ashi Strategy?
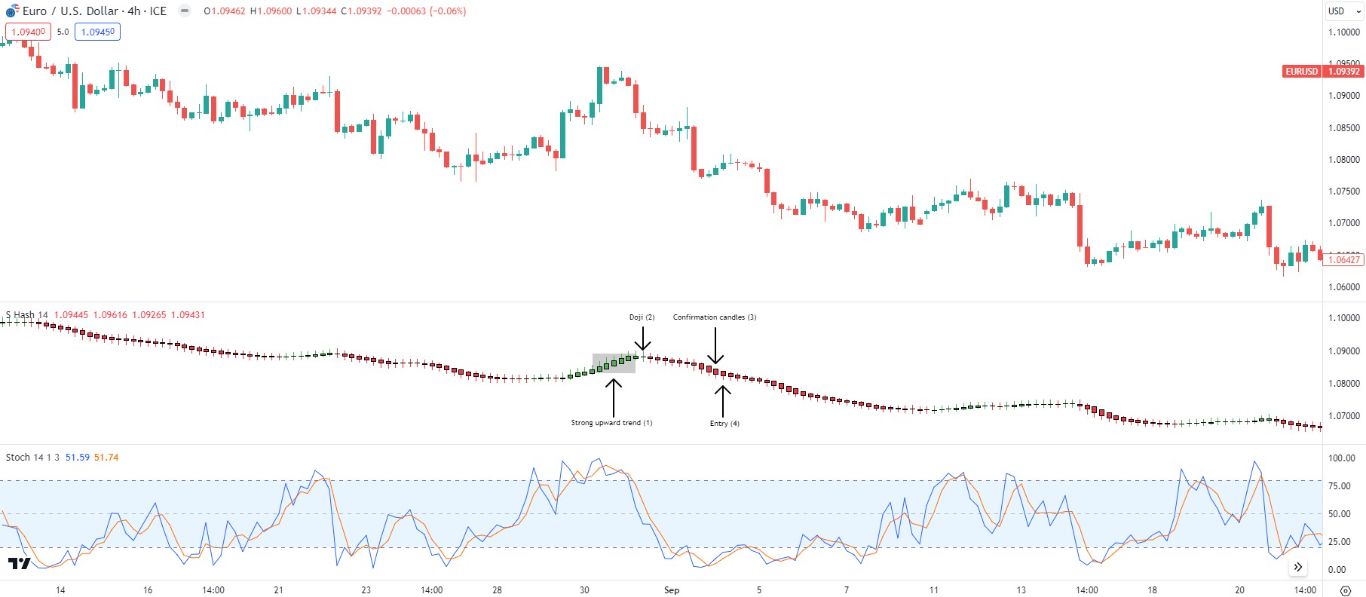
Integrating the Heikin-Ashi signals into a trading strategy, now that we have understood the characteristics of the indicator, is relatively simple in its approach.
- Identify strong trend.
- Isolate for doji candlestick.
- Wait for confirmation of reversal (2 green/red candles close post doji with only wicks at either the top (green) or bottom (red)).
- Entry.
The practical example illustrated by the chart below pinpoints each step as outlined above. Including a stochastic oscillator can aid in the timing of entry and exit. In this case, the stochastic suggests that the pair is in overbought territory at point (2) and may result in a subsequent downside. This is not the only additional component that can add value; other beneficial technical analysis techniques may be used, such as key support/resistance zones via price action or Fibonacci levels.
Benefits of the Heikin-Ashi Technique
- Ability to identify trends.
- Trend strength can be gauged by candlestick construction.
- Disregard unwanted disturbances.
- It can help avoid closing out profitable trades too early.
- Suitable for all time frames.
Limitations of the Heikin-Ashi Technique
- Requires additional indicators and technical know-how for optimal practice.
- A break in trend (candlestick change of colour or wick development) may not always signal the end of a trend.
- Trade signals can be delayed, thus negatively costing the trader.
Bottom Line
In summary, the Heikin-Ashi indicator has many advantageous traits that can assist traders in enhancing their trading methodology. Its versatility across asset classes and time frames allows for broad-based implementation. Still, with the addition of supportive technical analysis practices, the indicator's capability can be improved. That being said, any trading tool will require time and effort from traders to fully understand its distinctions, so practising in a demo environment is always prudent before live execution.
