The Market Profile indicator is one of the best tools for understanding underlying market movements in a way that is not obvious from traditional charts and indicators. Its unique structure gives price action a new layer of context, or as some traders describe it, a third dimension.
The Market Profile takes time to learn and requires practice to use proficiently, but in this article, I will provide the building blocks for starting to use it.
I will occasionally refer to “FX Market Profile” or sometimes just “Market Profile.” The main principles behind Market Profile are identical when applying it to Forex.
What Is the Market Profile?
A traditional price or candlestick chart shows the price range at regular intervals, e.g., every four hours for a 4-hour candlestick chart. In comparison, a market profile chart displays how much time the market spent at different price levels and how much volume it transacted at those prices.
Importantly, the Market Profile is not a trading strategy, system, or indicator. Rather, it’s a tool for organizing trading data.
J. Peter Steidlmayer, a trader at the Chicago Board of Trade (CBOT), invented Market Profile in the 1980s. Another CBOT and Chicago Board Options Exchange (CBOE) trader, Jim Dalton, is one of Market Profile's earliest and most vocal proponents. Today, Market Profile is a trademark of the Chicago Board of Trade.
How Does the Market Profile Work?
A Market Profile chart has two key parts: TPO blocks and Volume Distribution. TPO and volume distribution determine all the other aspects of the Market Profile, e.g., Point of Control, Value Area, etc.
Let’s examine these two elements first, then consider the other components and how to use them to assess the market's state.
Time Price Opportunity (TPO) Blocks
During the trading day, letters appear corresponding to different time increments. If the TPO setting is 30 minutes, the “A” blocks represent the first 30 minutes of the day, “B” represents the next 30 minutes, etc.
Capital letters are used for regular trading hour sessions, and lowercase letters are used for after-market hours. For example, in a US futures chart, the regular market hours are from 9:30 to 4:30, and the corresponding TPO blocks will be capital letters A to N. The after-market hours are from 6 p.m., and the TSO blocks will be from lowercase “a” onwards.
For cryptocurrencies, which is a 24-hour market without sessions, the TPOs in the first 12 hours of the day are “A” to “X,” and the second 12 hours are lowercase “a” to “x.”
Two Main Settings for the TPO
- The amount of time each letter represents. 30 minutes is the most common TPO setting for Market Profile traders.
- TPO Size: each block's price area. Although there are no hard rules for the size settings, examples include using 5 pips for major Forex pairs and $10 for Bitcoin. That means each TPO letter represents a 5-pip area in Forex or a $10 area for Bitcoin.
Other Settings
- For an FX Market Profile, traders will often set Market Profile windows for the session that interests them the most, e.g., a 10-hour window for the New York session with 30-minute TPO blocks.
- A market profile typically represents each day for markets with a set open and close each day, such as stocks.
Volume Distribution
As its name suggests, the Volume Distribution shows how much volume the market transacted at the different price levels during the period.
For clarity, traders commonly display the TPO as shaded blocks without letters and place the Volume Distribution over the TPO blocks in real-time trading.
The price chart above is a common way of displaying a Market Profile: the TPOs are now blocks instead of letters, and the Volume Distribution is overlaid as a thin line over the TPOs.
Now that I have established the TPO and Volume Distribution let's examine what I can derive from them.
Point of Control (POC)
This is the longest horizontal line of TPOs. Market Profile theory considers this the fairest price of the day because It’s been the most visited price for the entire session.
If there are two or more equally longest TPO rows, the POC is the row closest to the centre of the Market Profile.
Notice there is also a Volume Point of Control, i.e. the price at which the market traded the most volume in the session. This often aligns with the POC, as in the above case.
Generally, POC is not an entry area, as it’s the fair-value area and the most agreed-upon level. Price movement will slow down in this area and often chop. It’s a coin-flip level and where traders will usually get trapped. It's the area with the least clear bias. Instead, POC is an exit area.
Initial Balance (IB)
This is the price range of the first two periods or letters, usually the first hour, since 30-minute TPO is the most common setting.
Initial Balance is way more important for markets with an actual open or sessions, such as equities or Forex, and less critical for 24-hour markets, such as crypto.
Range Extension
This is the distance the price travels outside the Initial Balance (IB).
Tails
Tails are when two or more single-row TPOs stick out at the top or bottom of the Market Profile. However, they’re not considered Tails if that’s how the session or day finished.
Because they are single-row TPOs, we know the price movement was quick, meaning there was strong buying or selling in that area. The longer the tail, the stronger the market reacted to that area.
Tail at the Bottom
This indicates aggressive buying in that area. The price dipped to that area, but buying would not allow it to stay there for a reasonable time, so it quickly reversed.
A Tail at the Top
This indicates aggressive selling in that area. The price increased to that area, but selling would not allow it to stay there for a reasonable time, so it quickly reversed.
Value Area (VA)
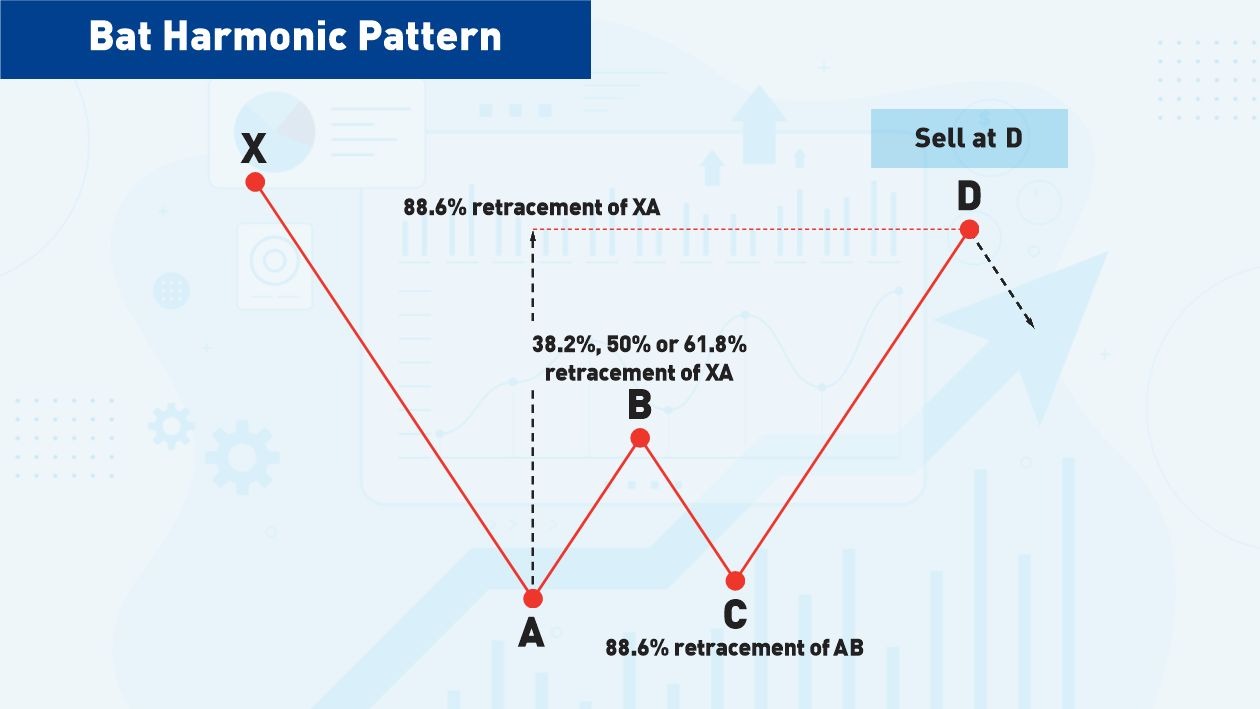
The Value Area is possibly the most important aspect of the Market Profile. It is where the price spends 70% of its time during the session, and traders consider it the fair value of the session’s range.
Value Area Low (VAL): The bottom of the Value Area.
Value Area High (VAH): The top of the Value Area.
Value Areas Act as Support and Resistance
The price often bounces between the Value Area Low and the Value Area High, especially when trading in a range. However, suppose the price breaks out of the Value Area, especially on high volume. In that case, the price will use the Value Area High as a support level for a bullish breakout or the Value Area Low as a resistance level for a bearish breakout.
New Value Areas Can Show a Potential Breakout
When the market is ranging, the Value Areas on consecutive days (assuming a daily chart) overlap and are generally in the same area and overlap. Then, if I see the market step out and create a new VA outside of previous days’ Value Areas, that shows a breakout or trending environment.
Best Entries for Most Trades Are at the Edges or Outside the Value Areas
Think of this as the opposite of entering trades at the POC, which is usually the worst area. Depending on the market view, I may range trade and expect the price to return to the current or previous day’s POC. Or I may expect the price to break out of the previous or current day’s Value Area.
The longer the price spends at the edges of the previous day’s VA, the more likely a breakout will occur. When I look for a breakout, I want to see more TPOs or volume build at the edge of a Value Area.
Place stops outside the Value Area and not within it, given that the price will commonly spend a lot of time in the Value Area.
Poor Highs or Lows
These are areas where the top or bottom extremes are blunt or flat. Poor highs or lows are significant because the market often returns to these later to “correct” them or smooth them out.
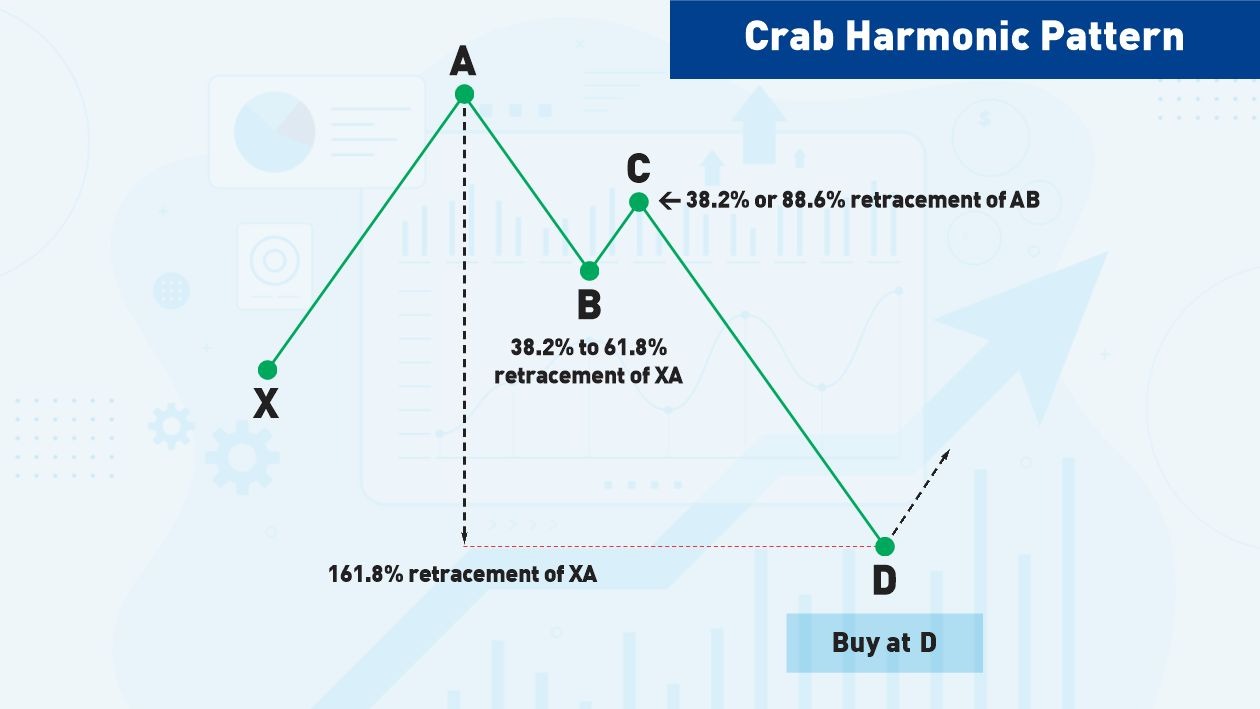
For example, if the price approaches a poor high or low, and volume picks up in that area, there’s a potential breakout in the direction of the blunt area.
Low-volume Nodes
Like Tails, low-volume nodes are areas of low TPOs within the market profile, not at the edges.
Because the low-volume node is an area where the market showed little interest, it should act as support or resistance if the price re-approaches that area - let’s say the previous day’s low-volume node. However, if the price breaks through the low-volume node, it can move swiftly through it. Low-volume nodes are a good area in which to enter higher-timeframe trends.
Market Profile Day Types
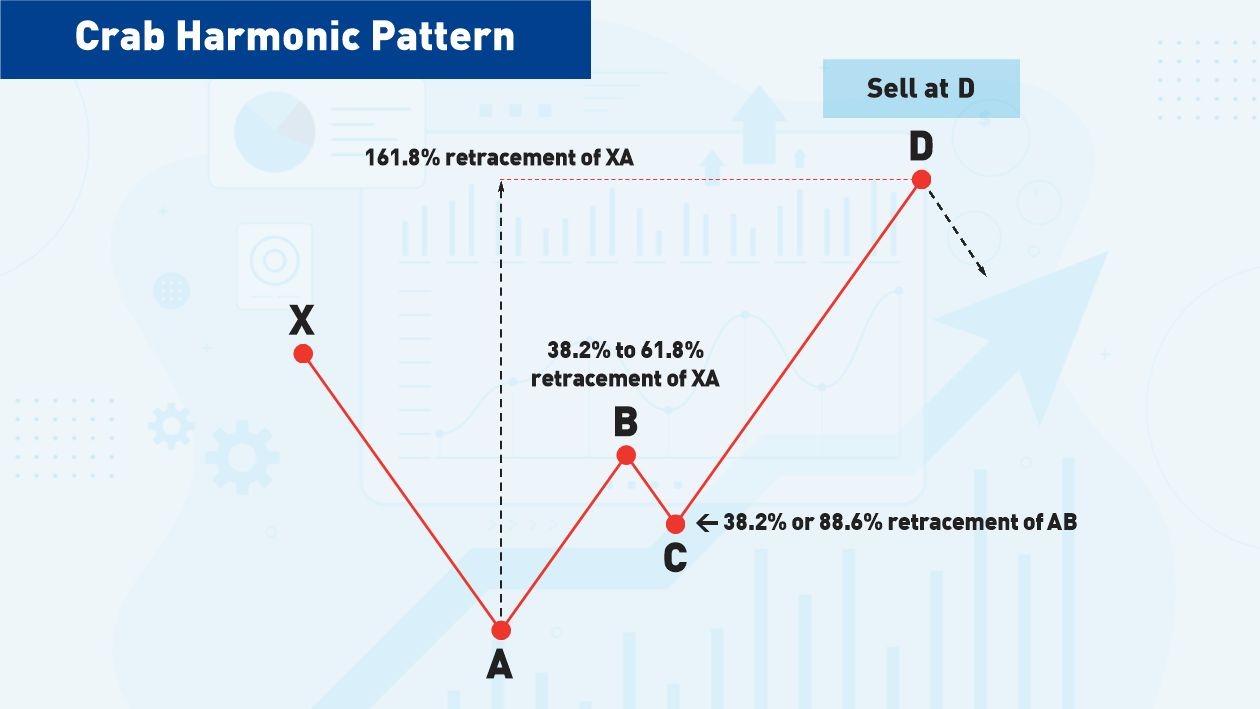
Different types of days will have differently shaped Market Profiles, and the two most important are “normal days” and “trend days”:
Normal Days
These have a symmetrical or balanced Market Profile, equivalent to a range on a traditional candlestick chart. Normal Days typically start with large Initial Balances.
Trend Days
The market profile is slimmer and vertically longer because the price spends less time in any one area as it moves into new territory.
Pros and Cons of the Market Profile Indicator
Pros
- The Market Profile reveals the significance of specific price levels that cannot be seen through traditional price or candlestick charts, such as hidden levels of support or resistance.
- Traders can use Market Profiles to locate trades, often contrary to conventional wisdom.
- The levels within ranges become much more evident when applying Market Profile Value Areas.
- Although not all trading platforms support Market Profile, some, such as the Sierra Chart platform, handle it exceptionally well.
Cons
- Like any system of analysis, the Market Profile takes time and experience to become proficient. Do not expect overnight results!
- Not all platforms support the Market Profile. For example, MetaTrader requires users to install third-party indicators, and many do not accurately represent Market Profile activity.
- As it is a method of analysis rather than a strategy, Market Profile is subjective to a trader’s skills.
Bottom Line
Market Profile analysis is a unique and powerful tool to reveal the significance of price areas that are almost impossible to detect on traditional price and candlestick charts. It can spot hidden support and resistance levels, where to avoid entries, and hard-to-spot levels within ranges. Not all platforms support Market Profile without third-party add-ons, but some have it seamlessly built into their features, such as Sierra Chart. Market Profile takes time to learn and use, but the rewards are worth it.
