Top Forex Brokers
What is the S&P 500 Index?
The S&P 500 Index is an index consisting of the five hundred largest publicly traded companies on U.S. stock exchanges. The index is weighted according to the respective market capitalizations of its member companies, and therefore effectively mirrors the market value of American big business. For example, if company A has one million shares issued which are valued at $1 each while company B has one million shares issued which are valued at $2 each, the price change of company B’s share is going to contribute twice as much towards the changing value of the index as company A’s.
As the U.S.A. has been the world’s largest and leading economy for arguably one hundred years or so, its stock market has been the subject of strong interest from international investors, especially since the deregulations of the 1970s which made retail international investment easier.
Why Should I Be Interested in the S&P 500 Index?
As a very broad index representing the leading lights of the world’s largest and most successful economy, the S&P 500 Index is extremely interesting to investors and traders worldwide, and more so than any other stock market index except perhaps the NASDAQ 100, the major American technology index.
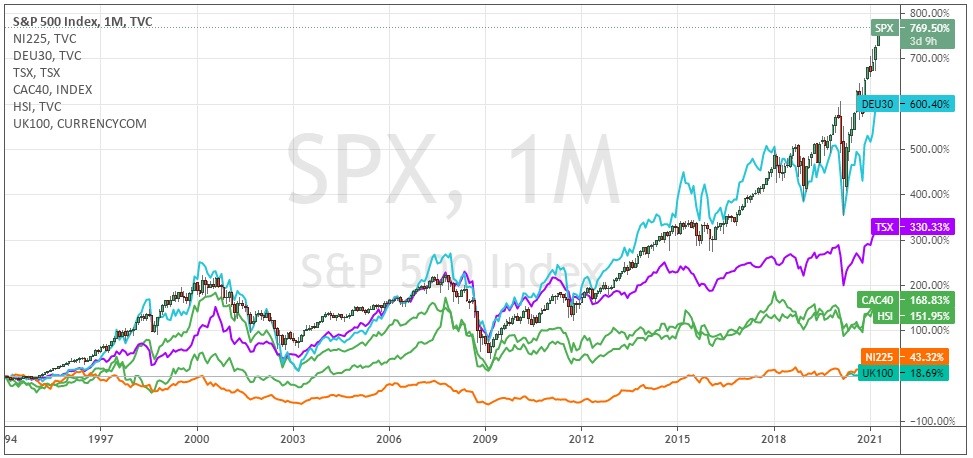
More specifically, traders and investors like you are interested in opportunities to make money. Here is a chart and table of data showing how the S&P 500 Index has outperformed a range of other countries’ major stock market indices since the early 1990s:

S&P 500 vs Major Indices 1994-2021

S&P 500 vs Major Indices 1994-2021
We can see that stock market indices in general, and the S&P 500 Index in particular, has a “long bias” – their prices tend to rise over time. This can be contrasted with Forex, another asset class available for trading at most retail brokerages, which tends to not have any directional bias. That means that traders can enjoy a statistically positive edge by doing something as simple as trading the S&P 500 long. It takes much more work than that to build a profitable edge in Forex or commodities.
The S&P 500 Index can be traded at almost every major Forex brokerage which also offers CFDs, cheaply and reliably. With such a great historical track record on the long side, why wouldn’t traders and investors everywhere be interested in it?
How Can I Invest in the S&P 500 Index?
As investment typically means buying and holding an asset for a period of months or years, it is important to invest through a vehicle which does not impose periodic holding costs, while spread and commission is not so important. That means that if you are investing in the S&P 500, you will be wise to not use brokerage CFDs, as these will almost always generate an overnight swap fee daily which will hugely eat away at long-term profits. Additionally, it is impractical and expensive for retail investors to buy a weighted sample of all five hundred shares, which is what would be required to replicate the index.
A practical solution for investors is to buy shares in exchange traded funds (ETFs), which closely reflect the performance of the S&P 500 Index. These ETFs own large amounts of the five hundred companies which make up the index. ETFs will almost always slightly underperform the Index due to the costs of buying and selling the shares they must own and other necessary administration, but for retail investors it is unquestionably the best option.
Some of the most popular ETFs tracking the S&P 500 Index which can be found at major stockbrokers are:
- SPDR S&P 500 ETF (NYSEARCA:SPY)
- SPDR PORTFOLIO S&P 500 ETF (NYSEARCA:SPLG)
- VANGUARD S&P 500 ETF (NYSEARCA:VOO)
- iSHARES CORE S&P 500 ETF (NYSEARCA:IVV)
How Can I Trade the S&P 500 Index?
As traders are looking to profit from taking several short-term positions either long or short in the S&P 500 Index, they are much more interested in accessing an instrument which is liquid and usually has competitive spread and commission. Additional longer-term costs of holding positions, such as overnight financing fees which are often known as “swaps”, become less important.
The easiest way for most retail traders to trade the S&P 500 Index is by trading it as a CFD. Happily, many Forex brokers offer CFD trading in stock market indices.
Traders with larger deposits might instead get a better cost deal by trading futures or options contracts instead of CFDs, such as the e-mini S&P 500 futures or options. The e-mini S&P 500 futures contract has a tick size of $12.50 meaning the smallest position you can take has a nominal value of approximately half a million U.S. dollars, which is much too large for many traders. Happily, since 2019 a new S&P 500 futures contract one tenth of the size has been available: the e-micro S&P 500 futures contract with a tick size of only $1.25, meaning it is possible to take a position with a nominal value as low as approximately $50,000.
Bullish and Bearish Stock Markets Meaning in the S&P 500 Index
Although we have seen that stock markets, especially in recent decades, tend to rise in value over time, analysts divide markets into “bull markets” which are going up, and “bear markets” which are going down.
The classic definition of a bear market is when the major stock index of a market is down by more than 20% from its all-time high; the market is a bull market when it has risen by more than 20% from the last bear market low. Another technical definition which is frequently used are the relative positions of the 50-day and 200-day simple moving averages (SMAs): if the 50-day SMA is above the 200-day SMA, it is a bull market; if below, it is a bear market.
It is useful to categorize stock markets into bull or bear markets because the historical data of the S&P 500 Index shows that you can time the market, contrary to what your stockbroker might tell you. No matter which of the previously mentioned definitions is used, bull markets have significantly outperformed bear markets. This can be useful to investors, and even more useful to traders, who might take only long trades in bull markets and only short trades in bear markets.
S&P 500 Index Investment and Trading Strategies
The S&P 500 Index has had a long bias ever since it was created. This bias has become even stronger in recent decades and suggests that only looking to buy or trade long the Index is a good approach.
The following statistics are based upon the historical daily price behavior between 1957 and 2021, which includes more than fifteen thousand data points:
- On average, the price of the index rose by 0.03% each day.
- 52.98% of days saw rises in price, giving an overall edge in favor of buyers of almost 6%.
- Looking only at days where the Index is in a bull market as defined by the 50-day moving average being above the 200-day moving average (after a bull cross), and where the previous day saw a rise in price, the price rose by 0.08% on average each day, and 55.36% of such days saw a rise in price.
- Days that closed at a new 5-year high produced a further rise on average of 0.04% the next day, with 53.43% of such days being winning days. However, days which closed higher between the 50-day and 200-day moving averages, while the 50-day average was above the 200-day average, produced an average gain the next day of 0.10% with 56.42% of days winning days.
- Days with unusually large price ranges are followed by days of stronger and more probable price rises. In practical terms, this can mean that buying sharp, fast dips can be an excellent trading strategy. For example, days where the price range is more than double the 15-day ATR (average true range), have been followed by up days giving an average gain of 0.13%, with 56.47% of such days producing a gain.
- It has not been possible to construct any simple strategy which trades the S&P 500 Index short over the past several decades that has a proven record of profitability, due to the Index’s persistent long bias. However, it should be noted that falling markets tend to be sharper and shorter than rising markets. The price is more likely to fall when it is below the 200-day moving average than when it is above it.
How to Day Trade the S&P 500 Index
The S&P 500 Index can be a great asset to day trade, although when traded as a CFD it can have a comparatively higher spread than Forex currency pairs. This means that you are probably better off as a day trader to adopt a relatively conservative trading style which enters few trades, perhaps a maximum of only one per day when conditions seem right.
Day trading is challenging, and there is no realistic chance of success without paying attention to higher time frames. Therefore, day traders are likely to be most successful by looking to go long only when the previous day closed above its open, and when the 50-day moving average is above the 200-day moving average. Successful short trading is notoriously difficult and is probably only worthwhile when the market is falling very strongly, and the price is below the 200-day moving average.
Many day traders fail because they struggle with timing trade exits. The best way to deal with this is to forget about trying to get out right at the top. The best trades will keep going further and further into profit as the day goes on, so why not just sit tight until just before the day’s close and exit at that point. This can take a lot of stress out of trading and ensure you do not miss the big wins. Using a trailing stop can also be a good exit strategy.
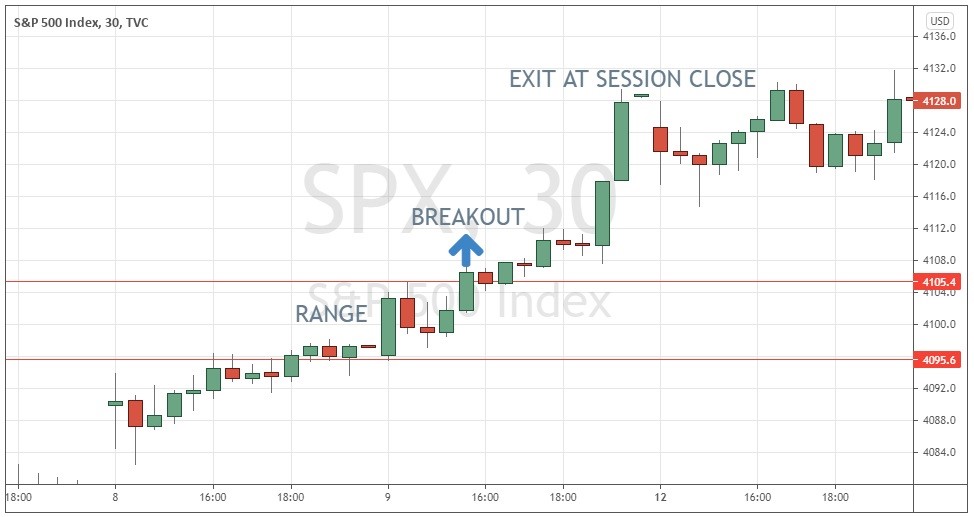
Day traders looking for an entry strategy might do well to wait for the end of the first hour after the NYSE’s open at 10:30am New York time when the previous day closed above its open and the 50-day moving average is above the 200-day moving average, and trade this opening range breakout by putting a pending buy order just above the high of the range, and a hard stop loss just below it.

S&P 500 Opening Range Breakout Trade, 9th April 2021
If the price reaches the stop loss before the entry is triggered, cancel the buy order, and forget trading for the day. Another trick that can be used for more profitable day trading, is to lower the position size of the pending trade entry the longer the day goes on without the entry being triggered. This helps increase profitability because the best trades get triggered earlier in the day’s trading session.
Although day traders can trade the S&P 500 Index at almost any hour of the day, it is a good idea to stick to the hours that the NYSE is officially open, from 9:30am to 4:30pm New York time, as this is usually the time of highest liquidity and volume.
Seasonality of the S&P 500 Index
Many analysts have noted that stock markets seem to tend to perform differently over different months of the year. This tendency is known as “seasonality”. One well-known expression about stock markets is “sell in May then go away”, meaning that markets often do well during the first four or five months in the year before declining over the summer.
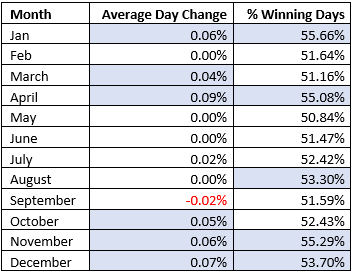
The below table shows how the S&P 500 Index has performed on an average day in each calendar month between 1957 and 2021:

S&P 500 Index Monthly Seasonality 1957-2021
These findings show that the Index has tended to perform better early and late in the calendar year, while the summer months have typically produced little or no return. It seems that “sell in May then go away” might not be bad advice for investors. However, it would probably not be wise to let these statistics stop you taking what otherwise would seem a good buying opportunity based upon technical analysis, especially bullish momentum.
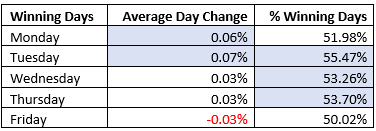
Historical data from the same period also shows that the Index tends to perform better earlier in the week, with average outperformance on Mondays and Tuesday, while Friday has been the only day of the week which has averaged a negative performance:

S&P 500 Index Weekday Seasonality 1957-2021
Again, it is worth being aware of these statistics without trying overly hard to base a trading strategy upon them.
Final Thoughts
Traders do not need to pick stocks to profit from the stock market but can instead trade broad market indices such as the S&P 500 to diversify away some market risk while being exposed to the strong upside in stock markets seen over recent years and decades. Now that most Forex brokers offer trading in the world’s largest and best-performing Index, the S&P 500, retail traders can join in and take advantage of the opportunity. Due to the Index’s recent long bias, trading short should be done with extreme caution, if at all. Plenty of money has been made trading the Index long after bearish retracements begin to turn around on the daily chart.
FAQs
Can You Just Invest in the S&P 500? How Do You Invest in the S&P 500?
You can invest in the S&P 500 Index easily by purchasing shares in any of several ETFs (exchange traded funds) which own shares in the 500 component companies and are designed to closely mirror the performance of the Index.
How Do You Trade in S&P Futures?
You can trade in S and P futures in the same way as you can trade in an S&P 500 CFD, you just need to open an account with a broker which offers direct trading in S&P 500 futures. These brokers tend to be based in the U.S. and require larger minimum deposits than Forex / CFD brokers.
Is the S&P 500 a Good Investment?
The S&P 500 Index has produced an average annual return of approximately 8% since 1957, which is generally considered to be a good historical performance for an investment. Whether it remains a good investment depends upon your view of the future of the largest corporations in the U.S.A.
